Odaily specially invited market analyst Conaldo, a master's degree holder in financial statistics from Columbia University in the United States, has focused on quantitative trading in U.S. stocks since college and has gradually expanded to digital assets such as Bitcoin. He has built a systematic quantitative trading model and risk control system through practical experience; he possesses keen data insights into market fluctuations and is committed to continuous in-depth research in the professional trading field, pursuing stable returns. He will delve into changes in BTC technology, macroeconomics, and capital flow weekly, reviewing and demonstrating practical strategies, and forecasting significant recent events for reference. 
Core Summary:
• From a macro technical perspective (see Figure 3 below): In the daily chart of Bitcoin, the rising trend line representing a long-term bull market (since the end of 2022) is about to intersect with the descending trend line defining recent adjustments (since the October 2025 high). The market is currently in a repair and oscillation period after breaking the long-term trend, with Bitcoin's price under dual pressure. Before the price can strongly break through this dual pressure with volume, all upward movements can only be viewed as a rebound under a bearish pattern, with the effective breakthrough of these two key trend lines serving as the final basis for judging the market's mid-term directional choice.
• Core viewpoint verification: The core judgment proposed last week that "the market is likely to shift into a consolidation adjustment pattern" is highly consistent with the actual market trend. The bulls and bears repeatedly contested the $87,500 to $89,000 area, and the mid-week adjustment low of $84,456 had a relative error rate of about 1.18% compared to the predicted support area upper limit of $83,500.
• Strategy execution effectiveness verification: Last week's trading strictly followed the established strategy, successfully completing four operations, with a cumulative profit of 2.14%.
The following will provide a detailed review of market predictions, strategy execution, and specific trading processes.
I. Bitcoin Market Review for Last Week (12.15–12.21)
- Review of last week's trend predictions and operational strategies:
In last week's forward-looking analysis, it was clearly pointed out: the market is likely to shift into a consolidation adjustment pattern. The $87,500 to $89,000 area was defined as a key observation area, and the outcome of the bulls and bears contesting this area will directly determine the market's short-term directional choice. It is particularly important to note that if this area is effectively broken down, it will directly affect the strength and depth of subsequent price adjustments. Below is the strategy review and analysis.
① Review of trend predictions:
• Core resistance level: The first resistance is seen at the $92,500 to $94,500 area; the second resistance is seen at the $96,500 to $98,500 area.
• Core support level: The first support is seen at the $87,500 to $89,000 area; the second support is seen at the $80,000 to $83,500 area.
② Review of operational strategies:
• Mid-line strategy: Maintain a mid-line position of about 65% (short position).
• Short-line strategy: To respond to market trends, we initially drafted two short-line operational plans, A/B. Based on the actual evolution of the market, we ultimately executed Plan B as the core strategy.
• Opening position: If the price breaks below the $87,500 to $89,000 area and is confirmed, establish a 30% short position.
• Risk control: Set the stop loss above $89,000.
• Closing position: When the price drops to the $80,000 to $83,500 area and shows resistance, close all short positions to take profits.
- Last week, we successfully completed four short-line operations according to the established plan (Figure 1), achieving a cumulative profit of 2.14%. The specific trading details and review are as follows:
Bitcoin 30-minute candlestick chart: (Momentum Quantitative Model + Spread Trading Model) 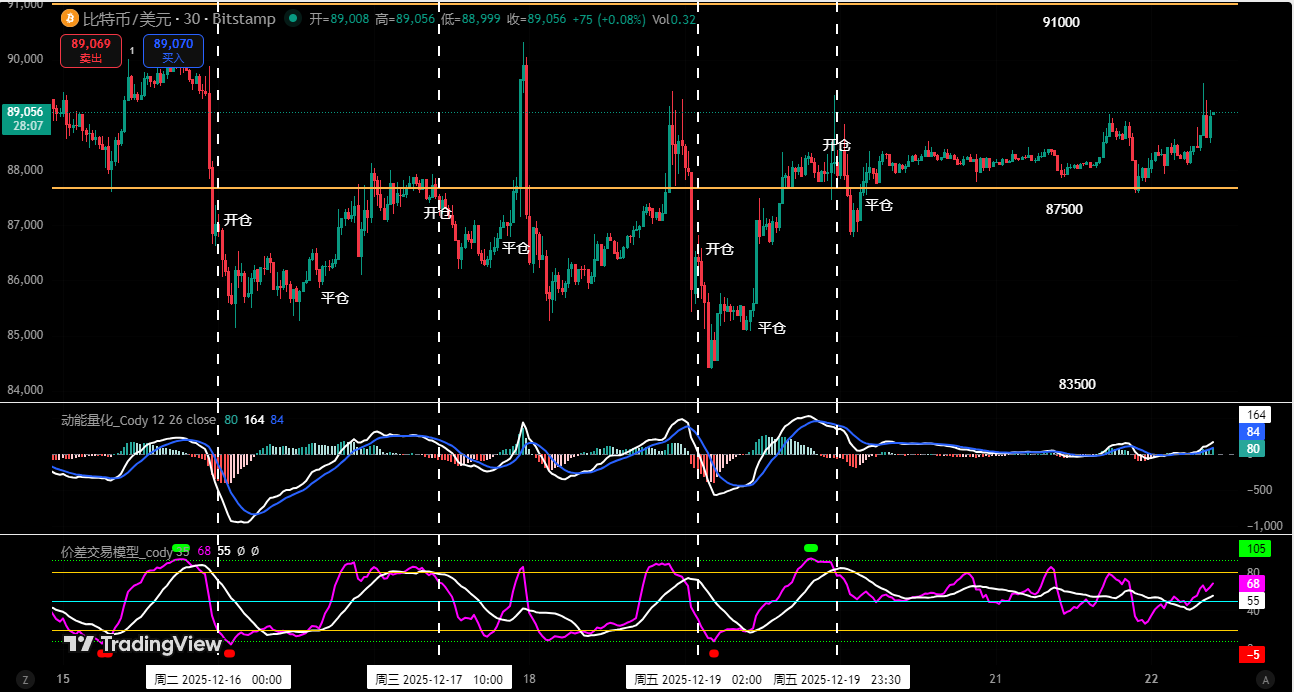
Figure 1
① Summary of trading details:

② Short-line trading review:
• First trade (Profit 0.73%): We strictly adhered to the principle of "effectively breaking key levels and shorting in the direction of the trend." When the market triggered, the spread trading model simultaneously issued a top signal, and we decisively established a 30% short position, ultimately taking profits when the price fell back near the previous low support area.
• Second and third trades (Cumulative profit 1.41%): Based on the "shorting when rebounding to core resistance areas" operational model. When the price hit resistance in the $87,500 to $89,000 area, combined with the resonance signals from the two models, we successfully completed these two trades.
• Fourth trade (Profit 0): The logic for this position was consistent with the previous two trades. It is particularly emphasized that in this trade, we strictly executed the principle of "when floating profits reach 1%, immediately move the stop loss to the opening cost price," resulting in this trade ultimately being closed at breakeven.
II. Quantitative Technical Analysis: Based on Multi-Model and Multi-Dimensional Operations
Combining last week's market operation, I will comprehensively use multi-dimensional analysis models to conduct an in-depth analysis of the evolution of Bitcoin's internal structure.
Bitcoin weekly candlestick chart: (Momentum Quantitative Model + Sentiment Quantitative Model)
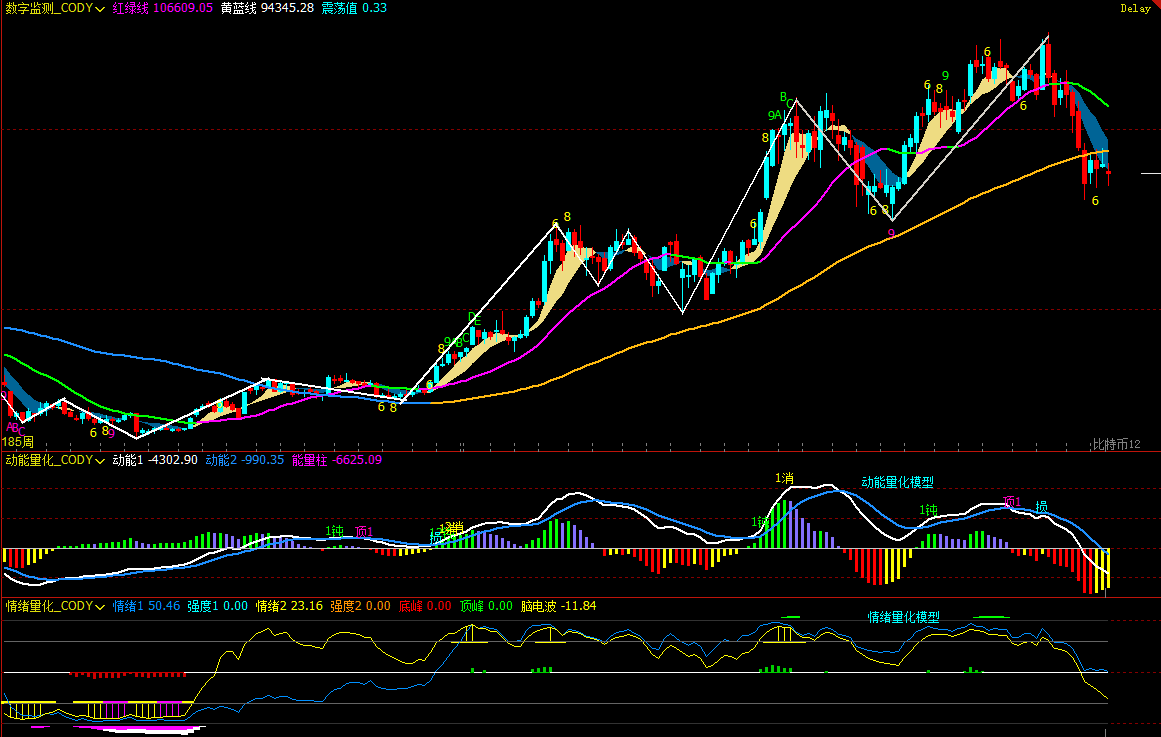
Figure 2
- As shown in (Figure 2), from the weekly chart analysis:
• Momentum quantitative model: After last week's adjustment, the two momentum indicator lines continue to operate below the zero axis. Although the rebound trend in previous weeks has not yet shown a significant increase in negative momentum bars, the current market structure remains weak, and we need to be cautious of the risk of further release of adjustment pressure.
Momentum quantitative model indicates: Price decline index: High
• Sentiment quantitative model: The blue sentiment line value is 50.46, with an intensity of zero; the yellow sentiment line value is 23.16, with an intensity of zero, and the peak value is 0.
Sentiment quantitative model indicates: Price pressure and support index: Neutral
• Digital monitoring model: As shown in the figure, the price has been below the bullish-bearish (yellow-blue line) boundary for 5 weeks, with an increasing probability of effective breakdown. Short-term bottoming digital signals (above 9) have not yet appeared.
The above data indicates: Bitcoin is in a downward trend, entering a bearish market at the weekly level, and caution is advised regarding adjustment risks.
Bitcoin daily candlestick chart:
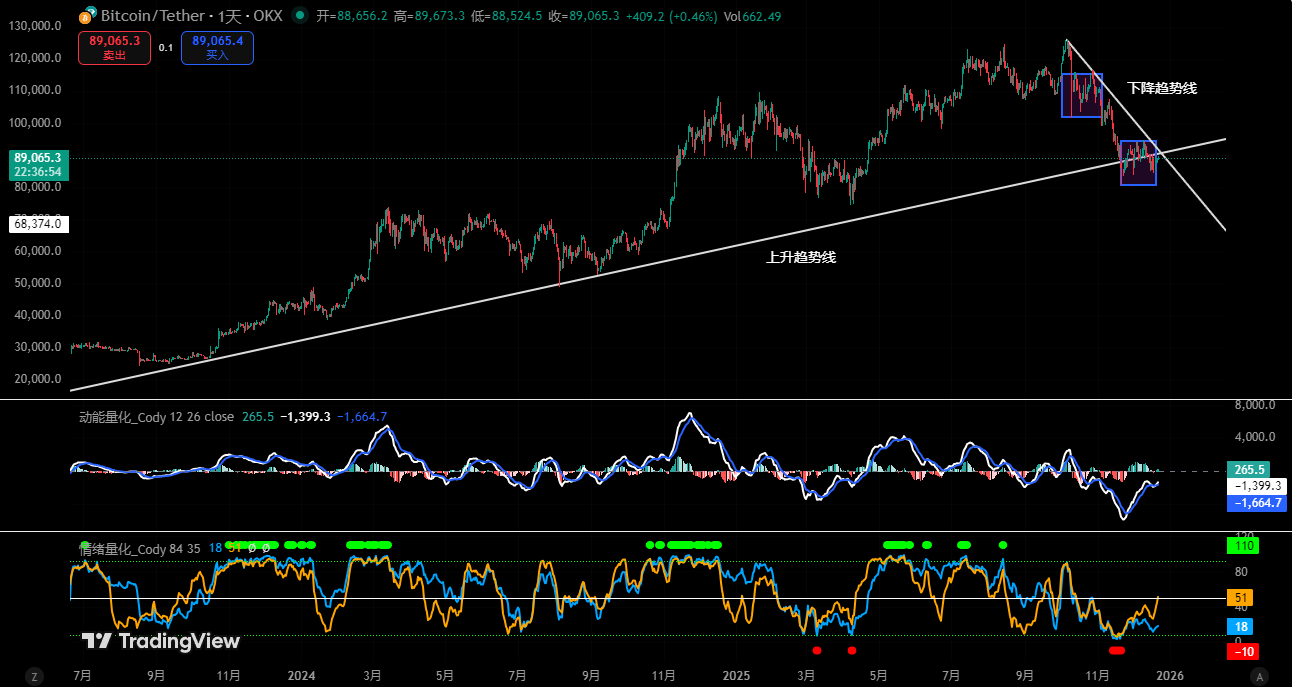
Figure 3
- As shown in (Figure 3), from the daily chart analysis:
• Momentum quantitative model: In last week's market, the two momentum lines experienced a repeated crossing process of "golden cross—death cross—golden cross" below the zero axis, with no significant increase in trading volume, and the growth of positive momentum bars is not obvious.
Momentum quantitative model indicates: Both bulls and bears are fiercely contesting market control, with weak buying momentum.
• Sentiment quantitative model: After last week's Sunday close, the blue sentiment line value is 17, with an intensity of zero; the yellow sentiment line value is 45, with an intensity of zero.
Sentiment quantitative model indicates: Pressure and support index: Neutral
The above data suggests: The daily level is in a bearish market, and the short-term market trend may still fluctuate.
III. Market Forecast for This Week (12.22–12.28)
- It is expected that the market will mainly present a wide-range oscillation pattern this week. The core observation range is $89,500 to $91,000, and the outcome of the contest in this area will determine the short-term direction:
• If effectively broken down: It will mean that the adjustment strength is increasing, and the expected adjustment range will expand, with the cycle accordingly extending.
• If effectively stabilized: The market is expected to continue oscillating and rebounding, but the rebound space is expected to be relatively limited.
- Core resistance levels:
• First resistance area: $89,500 to $91,000
• Second resistance area: $93,000 to $94,500
• Important resistance area: Near $97,000
- Core support levels:
• First support level: $86,500 to $87,500
• Second support level: $83,500 to $84,500
• Important support level: Near $80,000.
IV. Operational Strategy for This Week (Excluding Sudden News Impact) (12.22–12.28)
Mid-line strategy: Maintain a mid-line position of about 65% (short position).
Short-line strategy: Utilize 30% of the position, set stop-loss points, and look for "spread" opportunities based on support and resistance levels. (Using 30 minutes as the operational cycle).
Focus on observing the contest and outcomes between bulls and bears in the $89,500 to $91,000 area. To respond to market conditions, we have drafted two short-line operational plans, A/B:
• Plan A: If this area effectively stabilizes:
• Opening position: If the price rebounds to the $93,000 to $94,500 area and encounters resistance, establish a 30% short position.
• Risk control: Set the stop loss for the short position above $96,000.
• Closing position: When the price drops to the $89,500 to $91,000 area and shows resistance, close all short positions to take profits.
• Plan B: If this area is effectively broken down:
• Opening position: If the price breaks below this area and is confirmed, establish a 30% short position.
• Risk control: Set the stop loss above $92,000.
• Closing position: When the price drops to the $83,500 to $84,500 area and shows resistance, consider partially or fully closing positions to take profits.
V. Special Reminders
When opening a position: Immediately set the initial stop loss.
When profits reach 1%: Move the stop loss to the opening cost price (breakeven point) to ensure capital safety.
When profits reach 2%: Move the stop loss to the position of 1% profit.
Continuous tracking: After this, for every additional 1% profit, the stop loss will be moved 1% accordingly, dynamically protecting and locking in existing profits.
(Note: The above 1% profit trigger threshold can be flexibly adjusted by investors based on their own risk preferences and the volatility of the asset.)
VI. Macroeconomic Outlook and Key Events for This Week (12.22–12.28 | Christmas Week)
- The Christmas holiday compresses trading hours, significantly reducing liquidity.
This week, U.S. stocks will close early on Wednesday and remain closed all day on Thursday. The combination of holiday factors and year-end settlements results in overall low market liquidity, making prices more susceptible to emotional and unilateral capital movements. Caution is advised regarding "false breakouts" and amplified short-term volatility under low trading volumes.
- Expectations for Federal Reserve Chair Nomination Heat Up, Policy Continuity Becomes Market Focus
The market is watching whether Trump will announce the next Federal Reserve Chair during the Christmas holiday. Currently, Kevin Hassett is clearly leading in nomination probability, with his policy stance viewed as leaning towards "predictable gradual adjustments."
(If the nomination is confirmed, it may help stabilize interest rate expectations and risk appetite in the short term; if an unexpected candidate emerges, it could trigger temporary fluctuations in interest rates and the dollar.)
- U.S. Third Quarter Data Wrap-Up, Validating "Soft Landing" Narrative
The U.S. third quarter GDP, personal consumption expenditures, and core PCE revised data released on Tuesday will be used to confirm whether economic resilience and inflation paths align with previous assessments.
(If the data shows mild revisions, the market is more likely to maintain pricing for next year's interest rate cuts; if there are significant upward revisions, it may raise long-term interest rates.)
- Employment Data as a Year-End Marginal Observation Indicator
The initial jobless claims data released on Wednesday, while not trend-significant, still serves as an auxiliary signal to observe whether the labor market shows signs of loosening around the holidays.
(Currently, the trend leans towards "stability rather than deterioration," with expected limited impact on the market.)
- Bank of Japan Dynamics Provide Global Liquidity Reference
The remarks of Bank of Japan Governor Kazuo Ueda and the November unemployment rate data will continue to influence market judgments regarding the pace of Japan's monetary policy normalization.
(If yen volatility amplifies, it may create emotional disturbances for global risk assets, especially U.S. stocks and the cryptocurrency market.)
Financial markets are ever-changing, and all market analyses and trading strategies must be dynamically adjusted. All viewpoints, analytical models, and operational strategies mentioned in this article stem from personal technical analysis and are for personal trading log purposes only, not constituting any investment advice or operational basis. The market carries risks; investment should be cautious, DYOR.
免责声明:本文章仅代表作者个人观点,不代表本平台的立场和观点。本文章仅供信息分享,不构成对任何人的任何投资建议。用户与作者之间的任何争议,与本平台无关。如网页中刊载的文章或图片涉及侵权,请提供相关的权利证明和身份证明发送邮件到support@aicoin.com,本平台相关工作人员将会进行核查。


