If the Bank of Japan raises interest rates, will it trigger a significant decline in the cryptocurrency market? To what level can we go long? And if the decline is relatively small, where can we short on the rebound?
Today, we will analyze the market around this theme. Today is December 19, 2025, and there may be a significant correction.
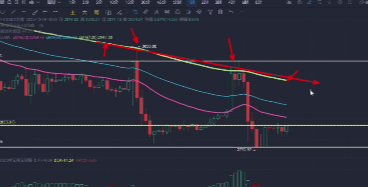
Let's take a look at the major support levels on the monthly chart. The strong support level on the monthly chart should be placed in the range of 2,300-2,370, 2,380. This is the position.
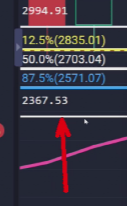
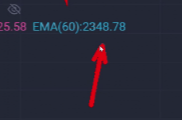
This corresponds to the EMA 60 on the monthly chart, where the support level is 2,348.
This is where the large bullish candle once started, and the lowest point of this large bullish candle is 2,367. If we are a bit more generous, the area around 2,380 and 2,400 is worth considering for medium to long-term positioning.
Assuming it doesn't drop that deep, where will it fall to? If it breaks below 2,600, 2,620, which is the low from last month, the first support we will see is around 2,500. The support around 2,500 is 2,484, so we are looking at the range of 2,380 to 2,500. In this range, we can gradually position ourselves in spot or medium to long-term trades with low leverage. Of course, we need to control our positions, keeping them at 5% or 10%. Depending on our personal risk management, we can divide our entries into two, three, or five batches. If it were me, I would suggest positioning in several tiers around 2,380, 2,480, and 2,500, with a position not exceeding 10%, and for spot trading, not exceeding 30% of the position. Assuming it doesn't drop in the short term, and the expectation of Japan's interest rate hike aligns with market expectations, where can it retrace to? If the expectations are not that severe, where can it retrace to? Let's look at the support from the weekly K chart. From the support structure of the weekly K chart, its MACD has dropped below the zero line.
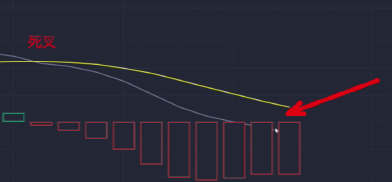
The white line dropping below the zero line means that the yellow line may also drop below the zero line, so we can determine that if the weekly K level closes like this next Monday, it may create a new low, with the first target being 2,571.
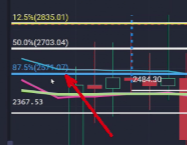
This is roughly around 2,600, which would create a small new low, then pull back to 2,600, and continue to oscillate within this range.
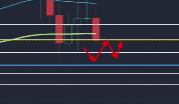
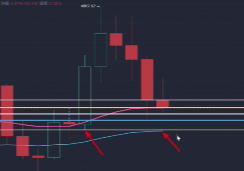
So how should we operate in the short term? For short-term trading, we need to look at the hourly level. From the current structure at the hourly level, it looks quite unfavorable. If we want to do ultra-short-term trading, I would suggest waiting for a pullback to this position, where there is support at 2,780, with a stop loss at 2,770. This is for short-term trading.
For intra-day ultra-short-term trading, where should we short? It has been oscillating around the hourly level for the past two days.
At the hourly level, the 120 moving average has reached this position and then pulled back.
For intra-day short positions, we are still looking around 2,947, 2,930, waiting to short at this position.
For short positions, around 2,900, but we must monitor the market closely.
For more strategies and market trends, follow the public account BTC-ETH Crypto.

免责声明:本文章仅代表作者个人观点,不代表本平台的立场和观点。本文章仅供信息分享,不构成对任何人的任何投资建议。用户与作者之间的任何争议,与本平台无关。如网页中刊载的文章或图片涉及侵权,请提供相关的权利证明和身份证明发送邮件到support@aicoin.com,本平台相关工作人员将会进行核查。