Ethereum #Bitcoin #Ethereum Real-time Analysis #Bitcoin Real-time Analysis
Hello everyone, I am Lao Lv. This drop came too quickly; we were just a little bit off with our medium-term short! It was only a difference of a few dozen dollars. However, there’s nothing we can do; the head and shoulders pattern on the daily chart is just that fierce. This trend can be referenced against the daily movements of Ethereum in August and September this year, with 4958 as the head, which is a very good head and shoulders pattern. However, that daily movement was much longer, unlike now, which is a one-time event, and it directly broke below the support of the 3020 neckline. We clearly indicated that after the break, it not only signifies a major medium-term decline but also that it would waterfall! The plan is just this plan; the original plan was to follow this trajectory this week, but I didn’t expect it to happen so quickly. A one-day drop directly reached the target. The entry point for the medium-term short was missed, but Lao Lv's reminder was still timely. On the short term, the support at 3110 cannot be broken, including the reminder of the break at the 3020 major bottom. At the very least, it prepares you for a big short, rather than selling everything to go long! Otherwise, you would get scolded again. A slight difference in points is okay; even if it’s a five-dollar matter, it can still lead to a fifty-thousand-dollar job. Currently, the price dropped from a high of 3178 dollars directly to 2871, a drop of 300 dollars, which is quite significant. Our previous article planned to enter a medium short to see if it breaks the previous low of 2600. However, from the daily perspective, it will reach that point, but not immediately. There will be some struggles on the weekly and monthly charts, meaning that the daily chart will likely oscillate up and down first, rather than going straight to the target. If it were to go directly to the target, how would we play it afterward? Would everyone sell their houses to buy the dip? Isn’t that plot a bit too simple? In December, we still lean towards neither being overly optimistic nor pessimistic.
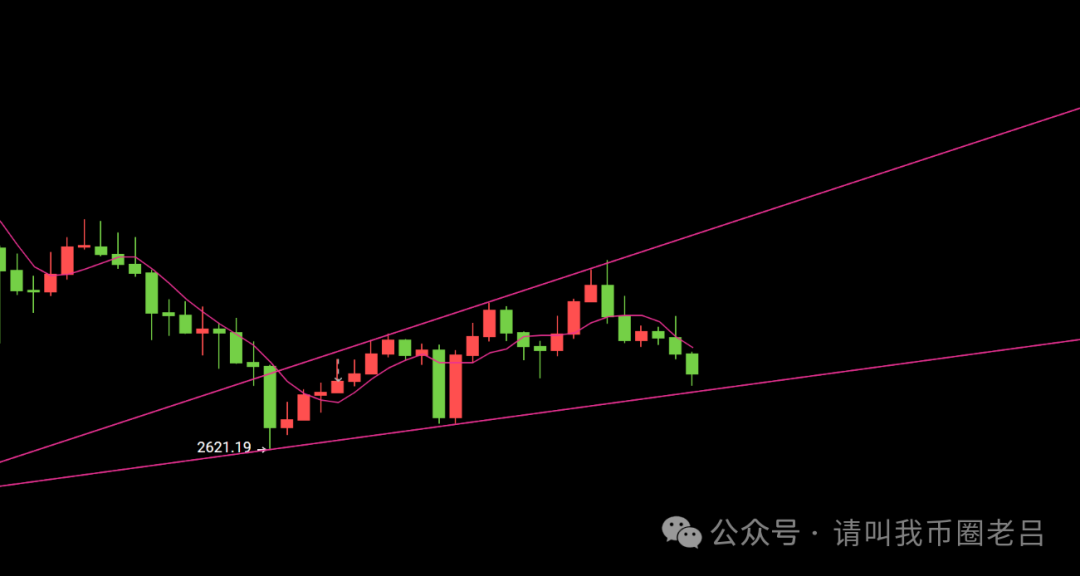
Ethereum, we have covered all the technical points in the past few days, and the previous daily head and shoulders pattern has also been discussed. The right shoulder pattern appeared at the price of 3180, rather than our expected range of 3220-3230, resulting in a small price difference and missing this big drop! However, our overall left-side trading prediction was completely fine. Let’s first look at the weekly chart. At the beginning of this week, it finally managed to stand above the five-day moving average, but yesterday’s drop directly pierced through the moving average. Therefore, it is expected to continue oscillating. The moving average is likely to maintain a flat state before the end of this month. A real big trend needs the monthly line to close in December to pull down the five-day moving average on the monthly line; otherwise, the distance between the moving average and the K-line price is too far, which deviates from the technical aspect. But from the monthly line, it is still a big bear market. However, paying attention to the monthly line has no significance in operations. With a 1000-point fluctuation on the monthly line, who can withstand it in the contract field? What can be seen with the eyes is not very reliable because everyone has eyes. Therefore, we continue to focus on the daily and four-hour levels. On the daily chart, it is currently a funnel shape, and as we approach the bottom of the funnel, we still want to try a long position, after all, this aligns with our previous statement of not looking at big rises or falls, but rather which side the price is closer to technically, we take action on that side first. The support at the bottom of the funnel: around 2850. From the four-hour level, it is the same, and it is a diverging upward funnel! At the same time, we need to pay attention to the strong resistance above: around 3060. Finally, we focus on the seven bearish and seven bullish nodes on the daily chart. According to the previous seven bullish rises at 2621, the turning point is on the seventh day, so tomorrow happens to be the seventh day of the bearish trend, so we need to put a question mark on tomorrow.
Ethereum 2870-2850 Long
Bitcoin, the entry for the long position is slightly off, but this round of decline still hasn’t broken the 84000 support. Therefore, we will first layout longs according to the major daily support. From the four-hour K-line perspective, it is still just oscillating; it’s just that the price amplitude is large, so it looks a bit intimidating. We continue to focus on which side the price is closer to. Support area: 84444-84888; just use the numbers you like! The entry area is still here. As time goes by, the support level continues to move up, meaning that as long as the price doesn’t reach here in a day, the support level will continue to move up. If it doesn’t drop to the entry point today, the support level will continue to rise to 85000 tomorrow. Therefore, in terms of entry, it should be flexible based on the changes in time.
Bitcoin 84444-84888 Long
Today: Written by Lao Lv on the evening of December 16, 2025, at 18:10. Note that all strategies are effective once and cannot be reused! Check the text version and specific entry prices in the lower right corner of the image or video.
免责声明:本文章仅代表作者个人观点,不代表本平台的立场和观点。本文章仅供信息分享,不构成对任何人的任何投资建议。用户与作者之间的任何争议,与本平台无关。如网页中刊载的文章或图片涉及侵权,请提供相关的权利证明和身份证明发送邮件到support@aicoin.com,本平台相关工作人员将会进行核查。