Yesterday's market analysis updated at noon provided a low strategy. Before the Federal Reserve announced the interest rate cut in the early morning, the good news was realized in advance, and our strategy also successfully secured a good profit margin. Congratulations to those who followed along.
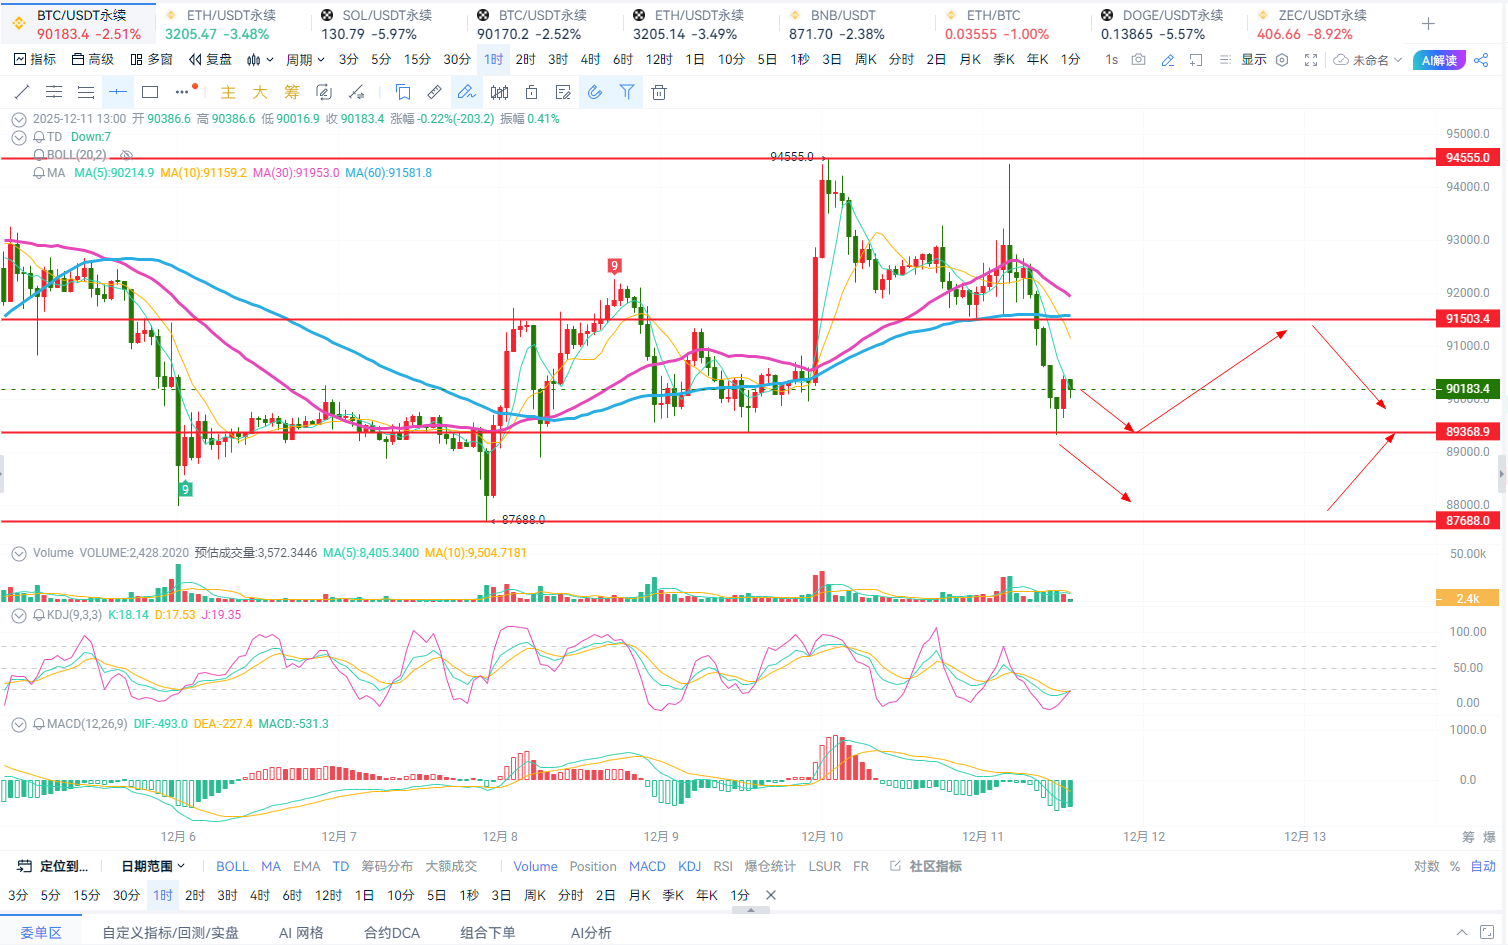
This interest rate cut was originally a market celebration, with the old routine of "buy the expectation, sell the fact" playing out again. The previous rise was due to speculation on the Federal Reserve continuing to inject liquidity; now that the news has landed, some funds immediately retreated to observe. This led to the market once again experiencing sharp fluctuations. Currently, the daily level of Bitcoin has retreated to the middle track of the BOLL band. In terms of indicators, the KDJ is leaning towards a short-term pullback, and the MACD is in a bullish contraction state. Combined with the 12-hour chart, the current market still leans towards slight oscillation and decline.
On the 4-hour chart, Bitcoin is currently running near the lower track of the BOLL band. The MACD and KDJ are showing a short-term pullback sentiment, but the MA30-day moving average is still showing a slight upward trend. Combined with the hourly chart, the current market is leaning towards a slight box range oscillation adjustment. The high point resistance is referenced at the 91500-94500 line, and the low point support is referenced at the 89300-87500 line. Only with a volume breakout above the box oscillation range pressure and support can the market develop a decent unilateral trend. Therefore, regarding the intraday trend, my personal view is still to maintain a short-term wave, focusing on low strategies primarily and high strategies secondarily.
Operational strategy: Buy near 89500-89000, target: 91000-92500, stop loss: 88500
Short positions are referenced near resistance levels.
Ethereum's short-term trend is basically in sync with Bitcoin, with high point resistance referenced at the 3280-3420 line and low point support at the 3170-3100 line. It is expected that the overall trend will first pull back and then rebound to test the strength of the resistance. Therefore, regarding the intraday trend, my personal view is still to maintain a short-term wave, focusing on low strategies primarily and high strategies secondarily.
Operational strategy: Buy at 3180-3150, target: 3260-3330, stop loss: 3130
Short positions are referenced near resistance levels.
For the current trend, it is expected to be sufficient, and follow-up will continue.
Personal views are for reference only; there may be delays in article review and push notifications. The market changes rapidly, so specific entry and exit points should be based on real-time guidance. Caution is advised when entering the market. Analysis is not easy; everyone is welcome to like and follow the public account for surprises!

免责声明:本文章仅代表作者个人观点,不代表本平台的立场和观点。本文章仅供信息分享,不构成对任何人的任何投资建议。用户与作者之间的任何争议,与本平台无关。如网页中刊载的文章或图片涉及侵权,请提供相关的权利证明和身份证明发送邮件到support@aicoin.com,本平台相关工作人员将会进行核查。


