In the past few weeks, the price of Bitcoin has significantly retreated, dropping from the area of over $120,000 to a low of around $80,000. Naturally, market sentiment has also shifted. Discussions on social media have turned from frenzy to panic, with timelines changing from "a $200,000 price is inevitable" to "is this the top?"
However, despite the price movements breaking the norm and news reports exacerbating the panic, one signal has surprisingly remained stable—indeed, it has even been quietly rising:
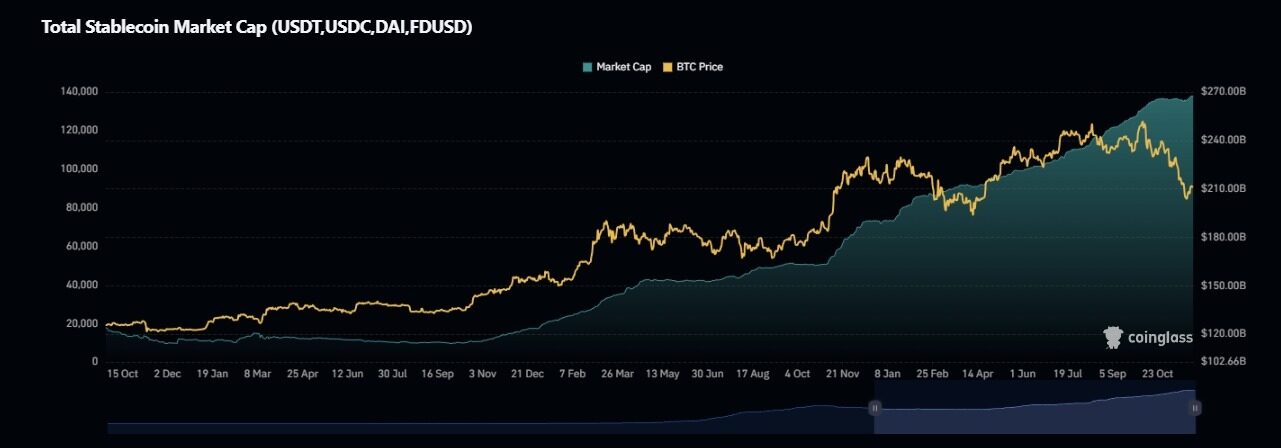
The total market capitalization of major stablecoins has not collapsed.
On the contrary, it continues to climb—currently around $26.749 billion.
This detail changes the interpretation of this pullback. It suggests that the recent movements may not reflect a complete trend reversal, but rather:
A rotation, a pause, not an exit, nor a bear market.
And this distinction is crucial.
Why Stablecoins Are So Important
Stablecoins are often viewed as a dull corner of the cryptocurrency space—merely "digital cash."
But in reality, they serve a vital role: the monetary foundation of the crypto economy.
Whether you are a retail trader conducting on-chain token trades or an institution looking to scale up investments, almost no one directly buys Bitcoin, Ethereum, or other cryptocurrencies with fiat currency. Instead, the first step is almost always the same:
Exchanging real-world currency for stablecoins (primarily USDT or USDC).
Stablecoins represent on-chain equivalent liquidity, foreign exchange reserve capital, and available funds.
Therefore, when the total circulating supply of stablecoins increases, it usually signifies one thing:
New capital is flowing into the cryptocurrency system.
And when it declines, it sends the opposite signal:
Capital is not just taking profits—it is leaving the ecosystem entirely.
Because unlike Bitcoin or altcoins, their supply will never disappear, while stablecoins can possess both characteristics simultaneously: minting and burning.
And this mechanism is key.
The Flow Behind the Supply
To understand why the supply of stablecoins is a reliable macro signal, you need to grasp how issuance works—especially for USDT.
The process is simple but strict:
An institution wires money to Tether's banking partner.
Tether confirms receipt.
USDT is minted and put into circulation.
The only time the dollar enters their system is after minting occurs—this means whether supply growth happens? Not considered in advance, this is a reaction to capital inflow.
Conversely, the opposite is also true:
- If an institution wants to exit → they will redeem USDT.
- The issuer returns fiat currency and burns tokens.
- Supply decreases—permanently removing liquidity from the cryptocurrency economy.
And most people overlook the subtlety here:
Buying and selling BTC with USDT does not change the total supply of stablecoins.
It only changes ownership.
Thus, the only moment that matters for supply is:
Minting → Real-world currency enters the cryptocurrency system
Funds exit the system, re-entering the fiat currency system
Everything else—trading, arbitrage, swapping, hedging—is internal activity.
This is why stablecoin charts reflect the macro pulse, rather than price charts.
How to Interpret This Signal
Once you understand the mechanism, the movements of stablecoins become a cyclical indicator.
Overall, the market can be divided into four possible states:
1 — Supply Increases + Bitcoin Price Rises → Expansion Phase
This is the cleanest, healthiest bull leg.
New capital flows in, stablecoin supply increases, demand drives Bitcoin prices up.
Characteristics of this phase include:
- Strong inflows
- Higher forex balances
- Organic growth rather than just leverage
In the early expansion phase of every bull market cycle, you will clearly see this pattern.
2 — Supply Increases + Bitcoin Price Falls → Accumulation or Waiting Phase
Things start to get interesting here—and this seems to be the phase the market is currently in.
Even with price declines, the supply of stablecoins continues to grow.
This usually means:
- Capital is not flowing out—it is just waiting.
- Institutions are not capitulating, but repositioning.
- Liquidity has not dried up—it is just on the sidelines.
Historically, this structure forms before significant continuation moves—especially when macro catalysts (like interest rate cuts, ETF fund flows, or a weakening dollar index) have yet to appear.
In previous cycles, this phase lasted from weeks to months—a silent accumulation of momentum.

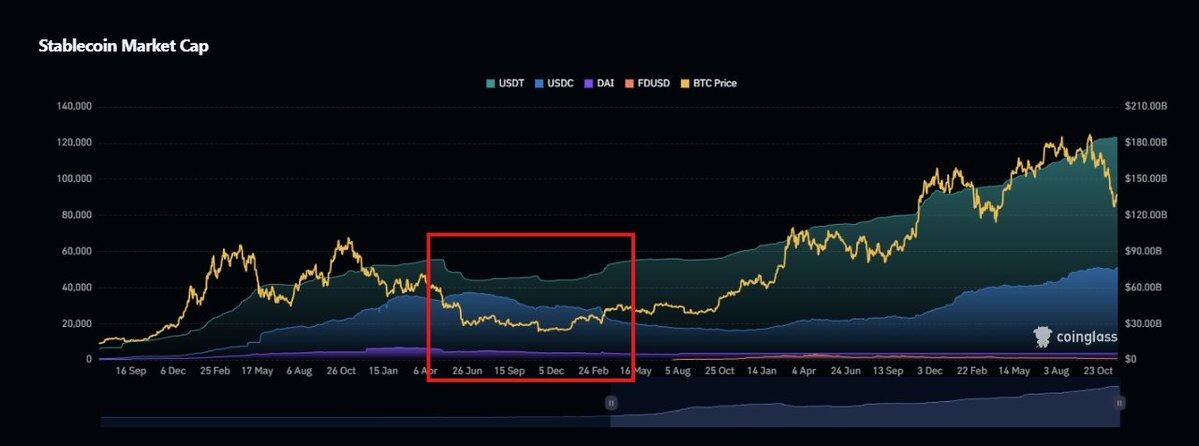
3 — Supply Decreases + Bitcoin Falls → True Bear Market
This is the textbook definition of a cryptocurrency winter.
- Bitcoin falls
- Confidence collapses
- Investors exchange stablecoins back to cash
- Supply contracts for months, sometimes even years.
This situation occurred after the end of 2021 and lasted until early 2023.
That was not "volatility." That was capital withdrawal.
4 — Supply Decreases + Bitcoin Price Rises → Late Cycle Warning
This pattern is rare and dangerous.
It indicates that price increases are not due to capital inflows, but because:
- Speculation has overheated
- Leverage is accelerating
- The same liquidity is being actively recycled.
A market barely sustained by weak momentum like this will eventually stagnate.
Sometimes slowly, sometimes violently.
So what phase are we in now?
What we know:
- The supply of stablecoins is still increasing
- No significant burn events have been recorded.
- Liquidity has not truly exited the system.
- The decline in Bitcoin has not triggered liquidity outflows.
The current structure is closer to:
Phase Two → Waiting/Repositioning Phase
Not Phase Three. In other words:
This does not look like a true bear market, but more like a pause.
And the distinction between a pause and a reversal is precisely the difference between early accumulation and panic selling.
What Happens Next?
The supply of stablecoins alone cannot predict timing—only the condition.
To further confirm direction, the following signals are worth watching:
- Dollar Index (DXY)
- ETF fund inflows and outflows
- Federal Reserve interest rate decisions and policy tone
If these factors align with the current trend of stablecoins, then this downturn may last longer than many previous instances:
This is a shakeout before moving forward—not the beginning of winter.
Final Takeaway
Cryptocurrency prices are not volatile because the charts appear to be trending upward.
It will move funds in, out, or stay in the system.
Despite the current market volatility, spreading panic, and price declines:
Money hasn't left; it is still waiting.
As long as liquidity remains in the market, a cycle will not end—it is building momentum.
免责声明:本文章仅代表作者个人观点,不代表本平台的立场和观点。本文章仅供信息分享,不构成对任何人的任何投资建议。用户与作者之间的任何争议,与本平台无关。如网页中刊载的文章或图片涉及侵权,请提供相关的权利证明和身份证明发送邮件到support@aicoin.com,本平台相关工作人员将会进行核查。


