Original | Odaily Planet Daily (@OdailyChina)

On October 11, during the black swan event, a whale involved in circular lending was forcibly liquidated for approximately 101 USD, losing 32,000 AAVE. However, this address did not exit the market. Instead, starting from November 24, it began to accumulate AAVE again through circular lending. As of now, its total holdings have risen to 333,000 AAVE, equivalent to about 62.59 million USD at the current price, with an average holding cost of approximately 167 USD.
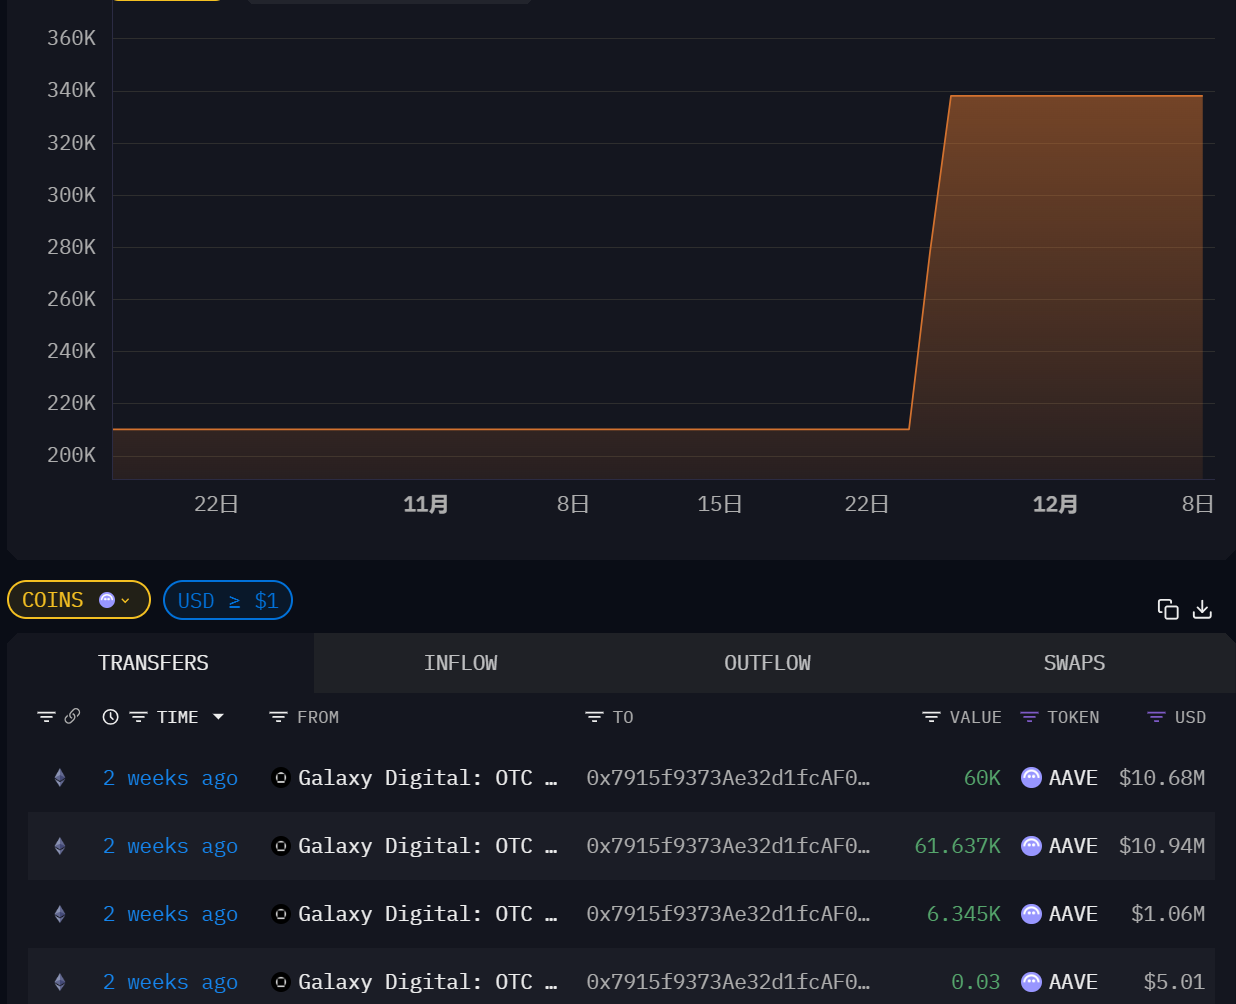
Around the same time, the well-known crypto investment firm Multicoin Capital also began to continuously invest in AAVE: since October 17, it has gradually increased its holdings through the Galaxy Digital OTC channel, currently holding about 338,000 AAVE, valued at approximately 65.3 million USD.
These transactions have occurred over the past month and a half. Given these clear signs of capital accumulation, can we interpret this as "smart money" establishing a structural bottom around AAVE? Is AAVE worth investing in?
Aave Protocol: The "Quasi-Infrastructure" of On-Chain Lending
If we consider on-chain lending as the closest track to "native finance" in DeFi, then Aave has almost become the recognized standard in this field. Whether it’s TVL, revenue, market share, or lending, every metric confirms Aave's success.
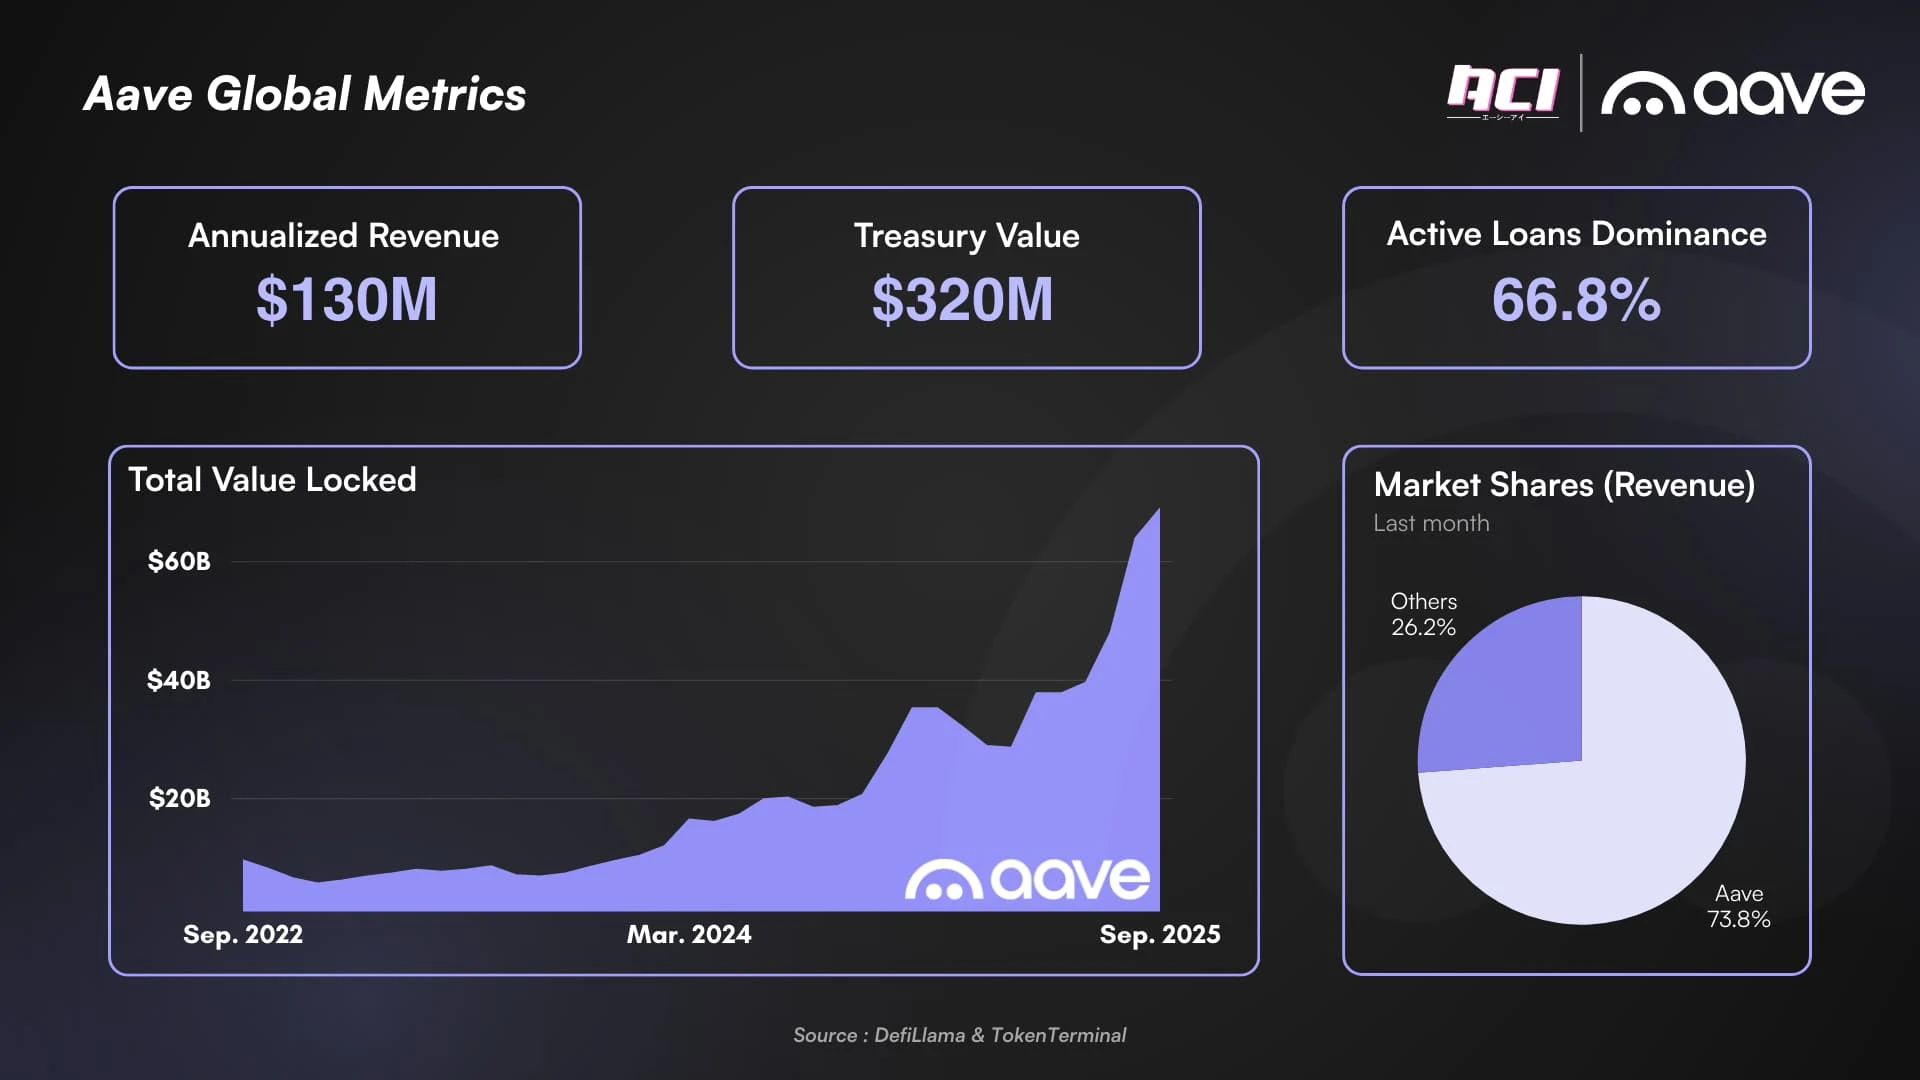
Especially in terms of revenue. As the core metric for measuring the value of DeFi protocols, Aave holds an absolute dominant position in the lending market. About 79% of the revenue in the lending market comes from the Ethereum mainnet, with 87% of that belonging to Aave itself.
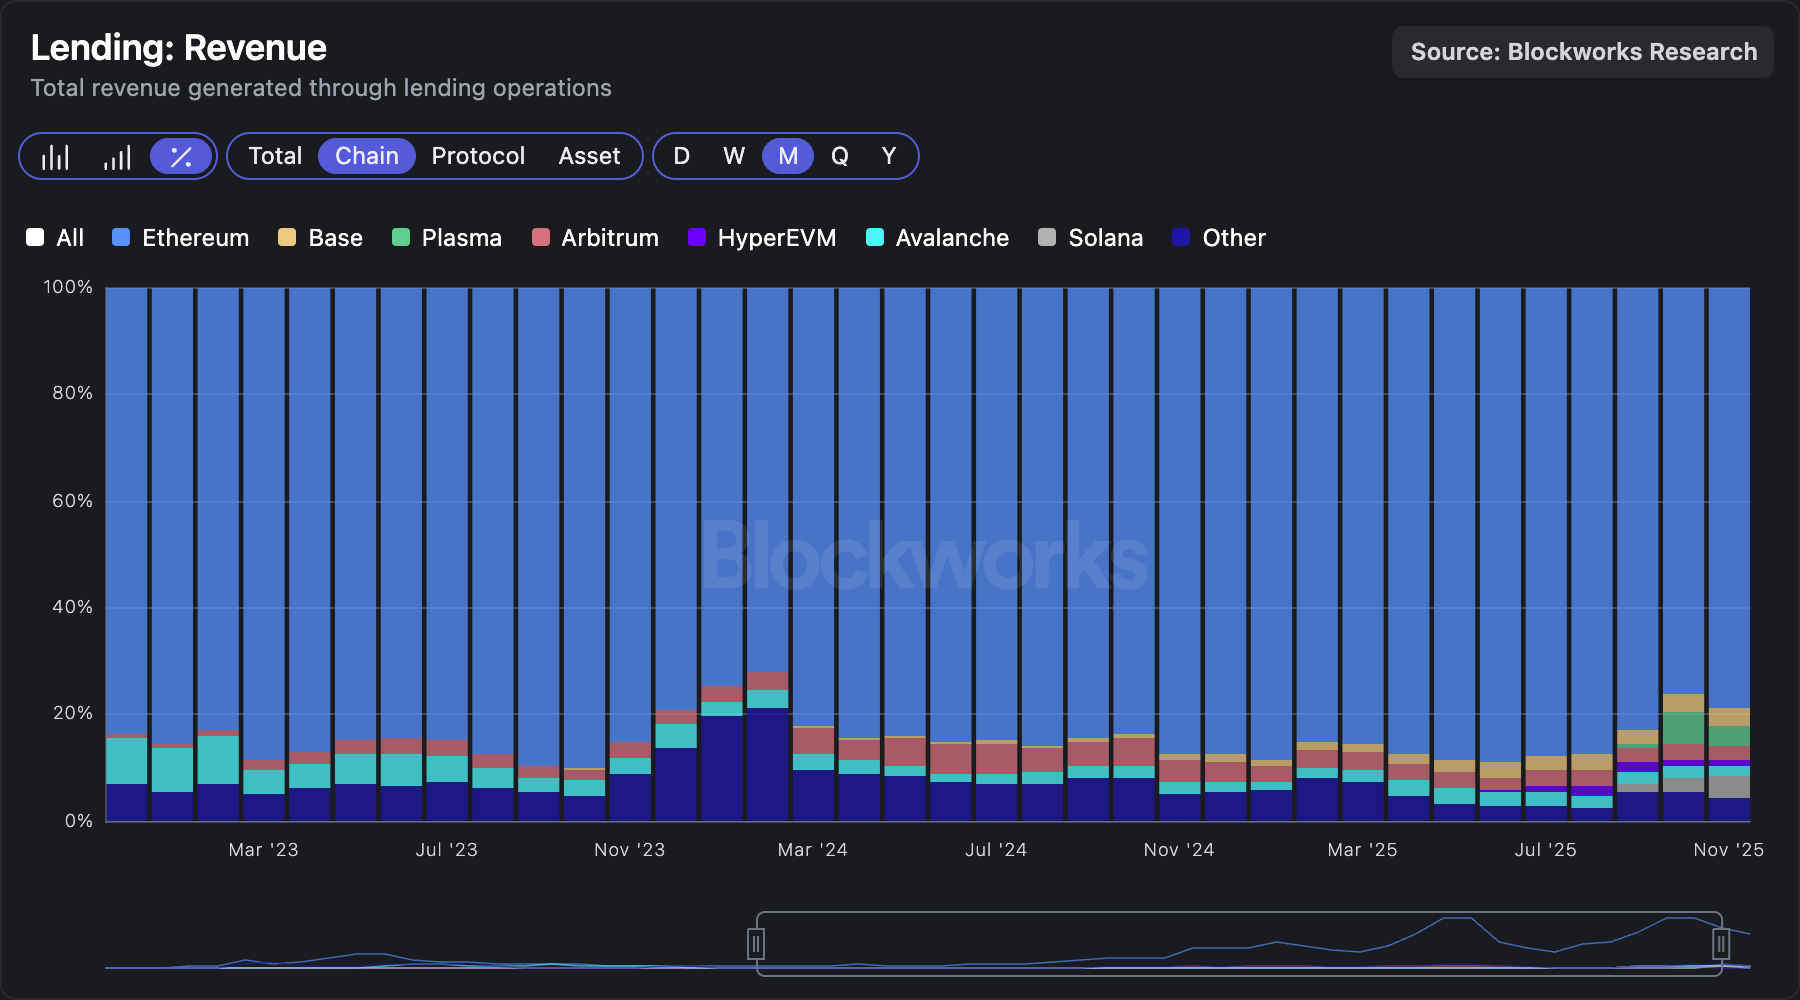
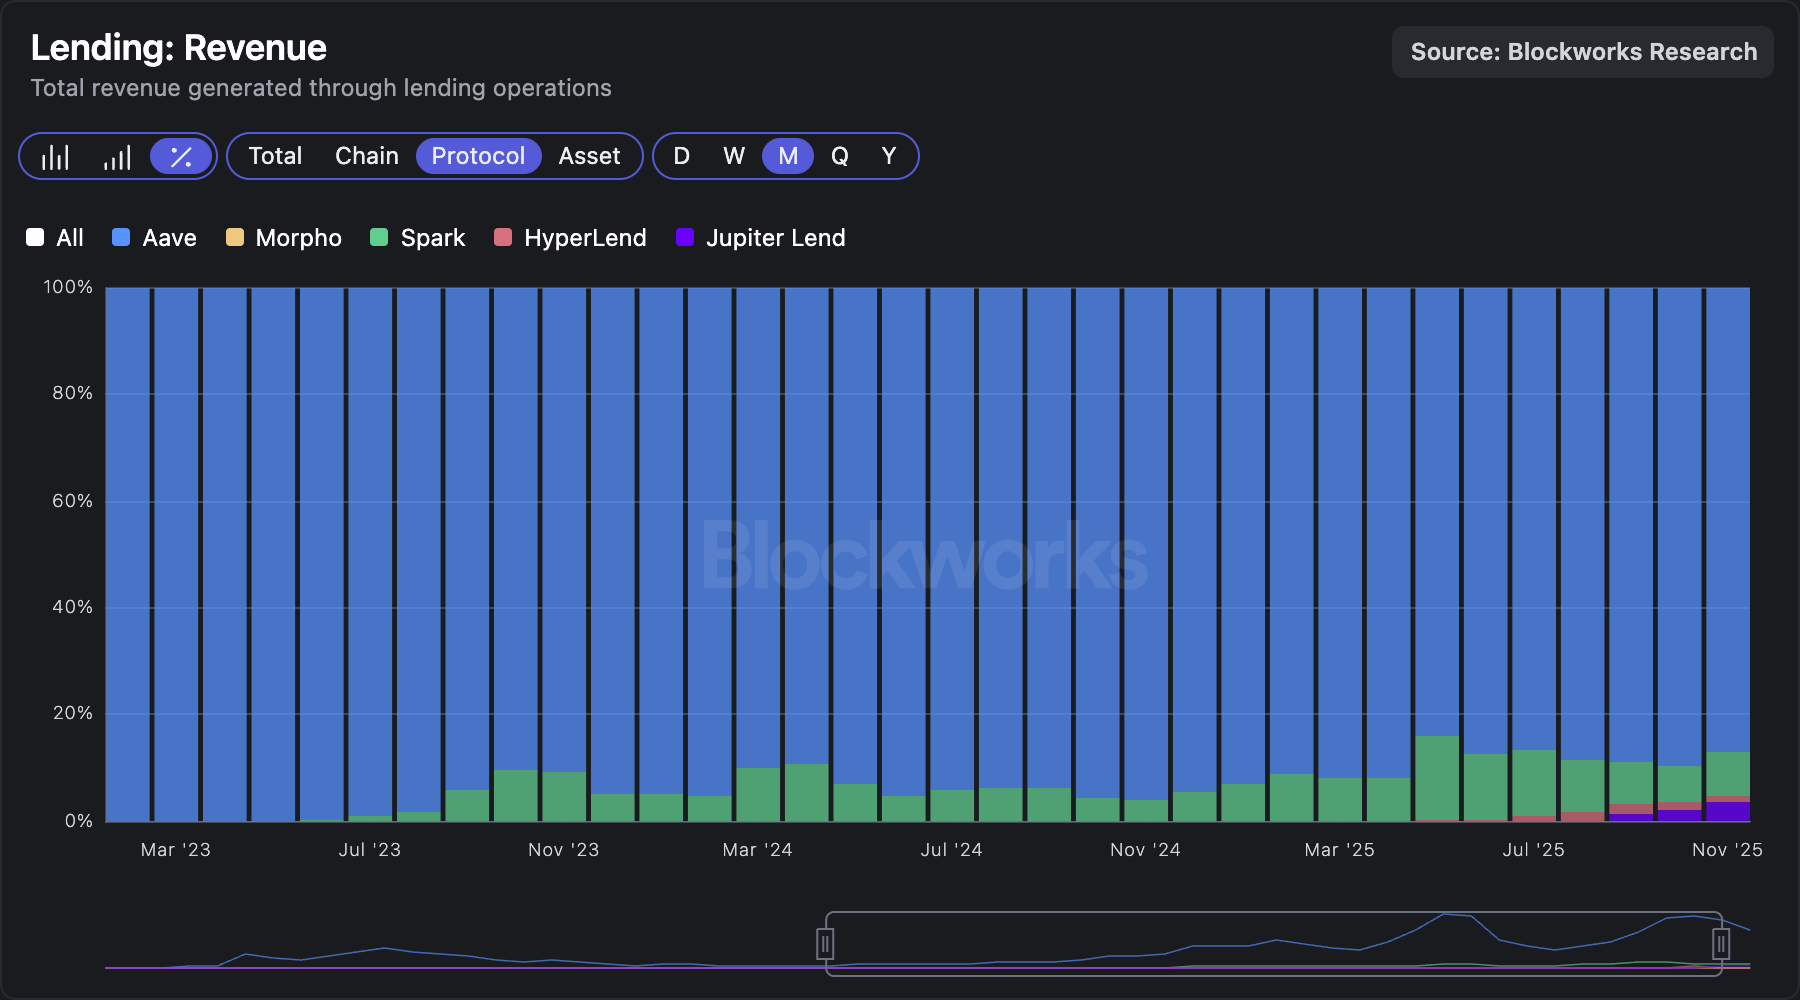
Data from Blockworks
This structure means that Aave is not just a "top project," but is closer to a foundational protocol that the market defaults to as a liquidity layer. However, the question remains: Can this advantage be transformed into a more certain cash flow logic to support the investment value of AAVE?
To avoid being misled by market noise, crypto user @intern_cc systematically deconstructed Aave's long-term financial structure, assessing whether its current growth is structural or merely a cyclical rebound, starting from "the protocol's ability to generate profit."
The core analytical framework includes: 1) Revenue forecasting model, constructed based on historical rolling multiples, specifically calibrated for diminishing marginal returns in mature markets; 2) Product integration capability, assessing the stability of GHO and its role in vertically integrating protocol revenue; 3) Capital efficiency metrics, reviewing the execution effectiveness of the token buyback plan and comparing it with annual targets.
Odaily Planet Daily has compiled the key data as follows:
Revenue Structure: Cyclicality Remains Strong, but the "Bottom" is Rising
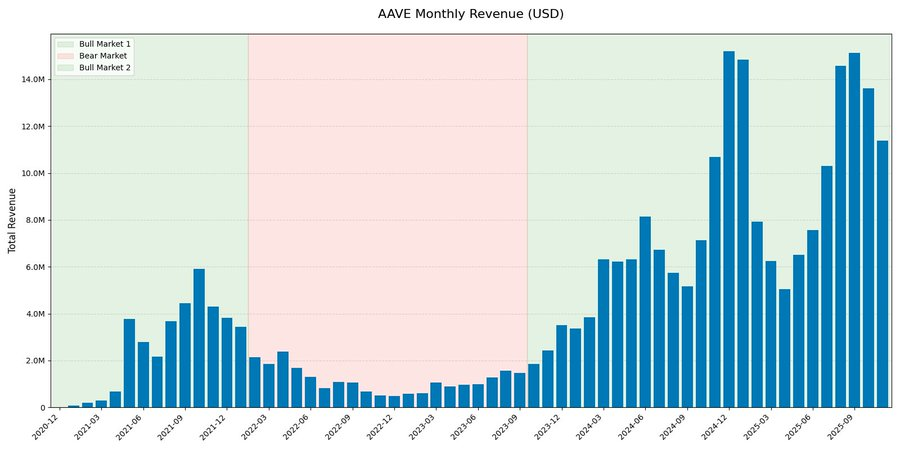
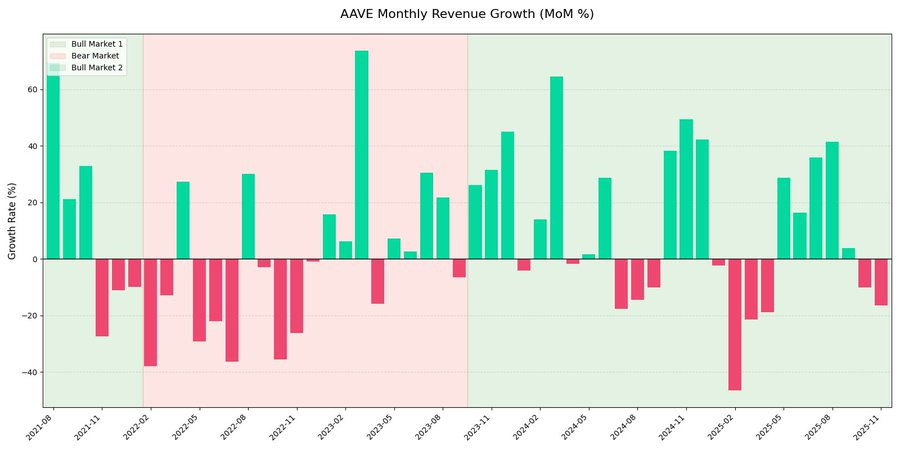
Looking back at Aave's monthly revenue data, it shows a strong cyclical characteristic. However, what is more noteworthy is that a clear structural leap has occurred.
In the current cycle ("second bull market"), Aave's monthly revenue has seen explosive growth, peaking at nearly 15 million USD, more than twice the peak in 2021. Despite the significant growth, the month-on-month revenue chart clearly shows: revenue remains highly volatile, primarily driven by market activity rather than exhibiting a linear steady expansion characteristic.
This data also indicates that protocol revenue has a clear reflexive characteristic across different market cycles.
The author also points out that even for blue-chip DeFi protocols like Aave, it is difficult to completely eliminate cyclical fluctuations in future bear markets. Newer protocols like Ethena and Pendle may face more severe survival tests in future bear markets but will experience significant prosperity during bull market cycles. The only blue-chip DeFi protocol that has seen relatively mild declines in trading volume and revenue during bear markets is actually Uniswap.
GHO: The Key Variable for Aave's Shift from "Horizontal Expansion" to "Vertical Integration"
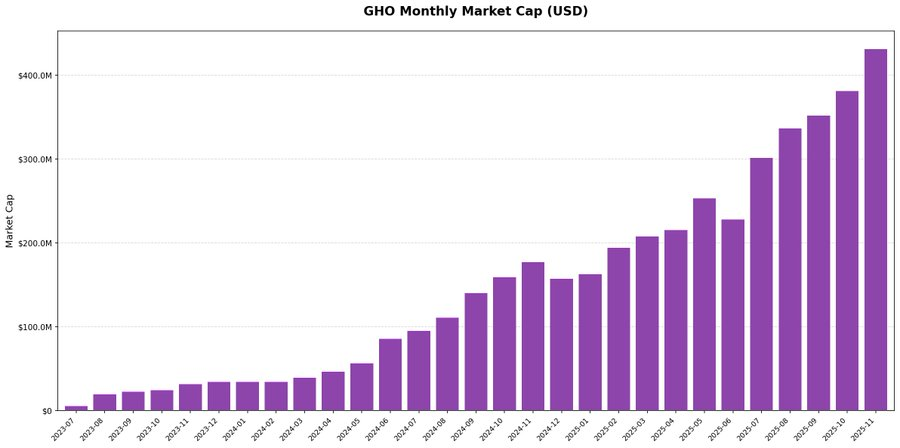
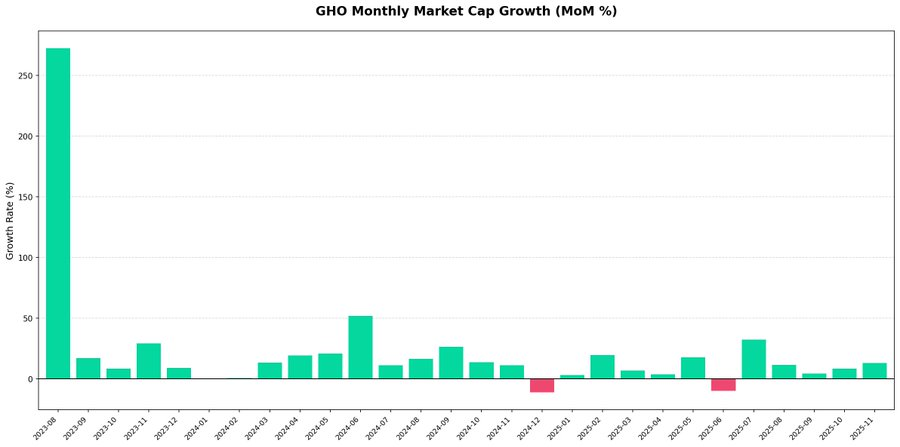
Since its launch in the third quarter of 2023, GHO has maintained a steady upward trajectory, with its market cap surpassing 400 million USD by the end of 2025.
Month-on-month data shows extremely low volatility, with almost no significant signs of capital outflow, indicating that demand is sustainable and not driven by short-term speculative capital rotation.
This trajectory validates that Aave's strategy of promoting vertical integration is effective. The growth of GHO is characterized by natural growth, with no abnormal spikes in TVL.
A horizontal comparison of GHO with crvUSD reveals that CDP-type stablecoins from blue-chip DeFi protocols exhibit a clear structural demand foundation. 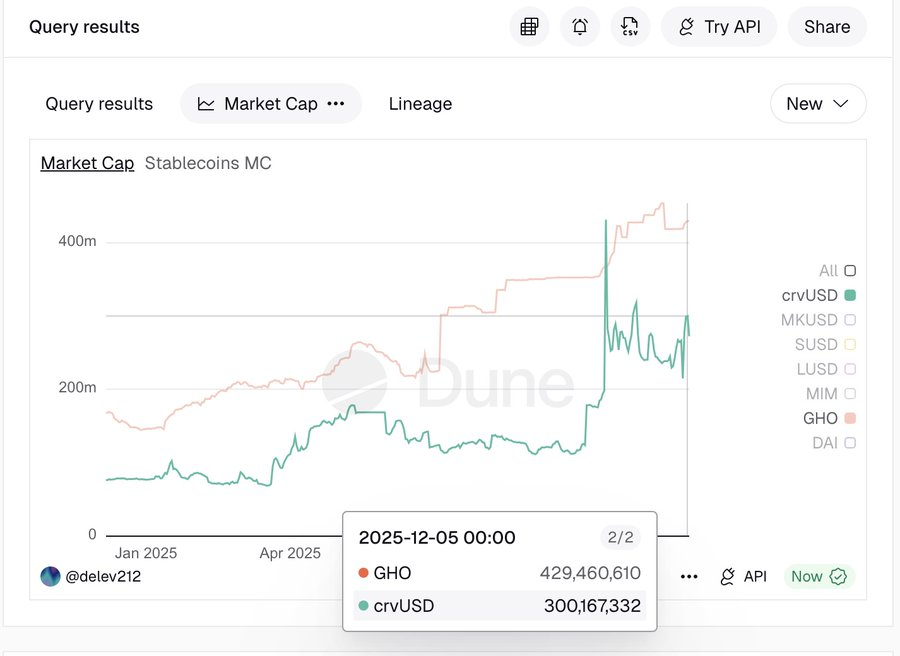
Revenue Forecasting Model: Aave is Entering the "Mature Protocol Range"
The author conducted rolling window modeling across historical cycles, believing that rather than subjectively assuming future growth rates, it is better to accurately measure the protocol's real revenue performance in each 12-month cycle across historical market cycles and to break it down into bear market contraction phases and bull market expansion phases.
In terms of scenario setting, three scenarios were selected based on historical sample distribution:
- Conservative scenario (25th percentile)
- Benchmark scenario (median)
- Optimistic scenario
It is worth noting that the optimistic scenario does not use the common upper quartile (75th percentile) but is deliberately limited to the 60th percentile range to filter out extreme outliers. The core purpose of this design is to reflect the law of diminishing marginal returns, ensuring that the model reflects the growth trajectory after the protocol enters a mature stage, rather than early explosive abnormal returns.
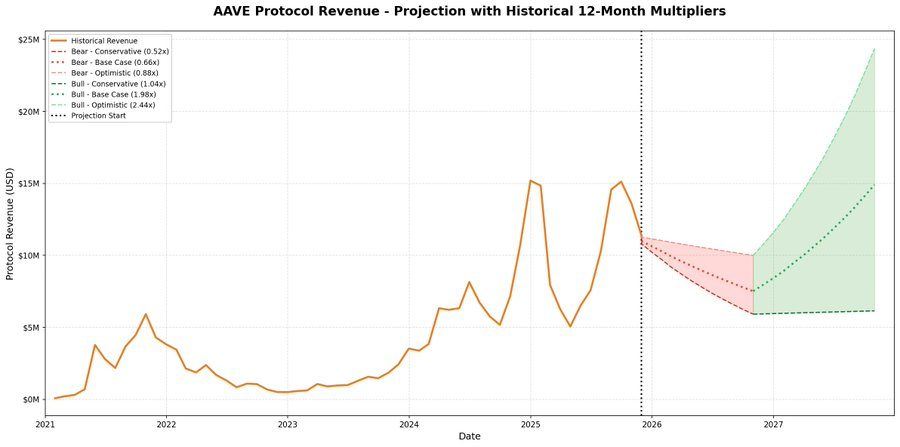
The results of this model show: Aave has clearly matured compared to the first bear market cycle. Future revenue may still decline, but the extent of the pullback will be significantly milder.
Notably, even under the bear market scenario assumption (0.52x–0.88x multiple range), the predicted revenue bottom is about 6 million USD/month, still higher than the historical peak during the 2021 bull market.
AAVE Buyback: The Real Execution Power of the Deflationary Mechanism
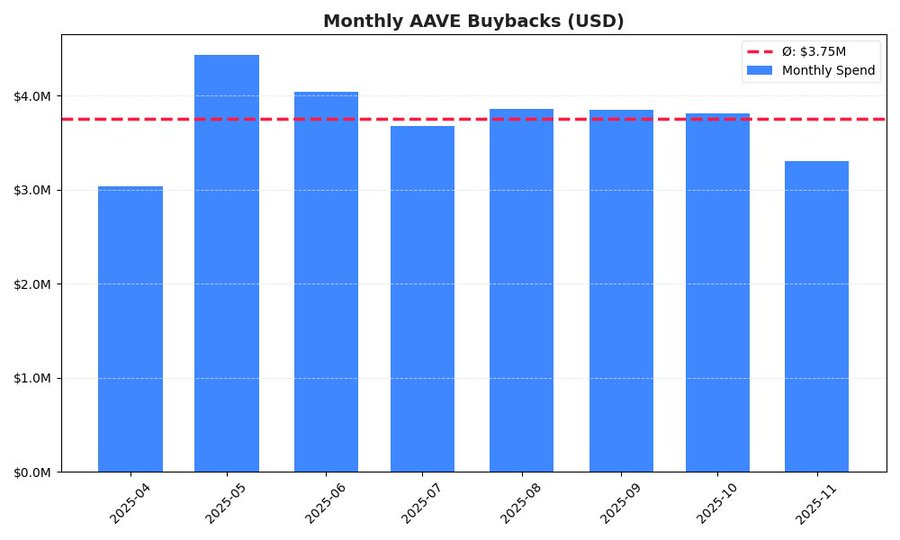
The monthly buyback volatility chart shows that the protocol has adopted a relatively disciplined, non-speculative execution strategy. Although there are slight fluctuations (for example, a peak in May), the overall rhythm remains relatively stable.
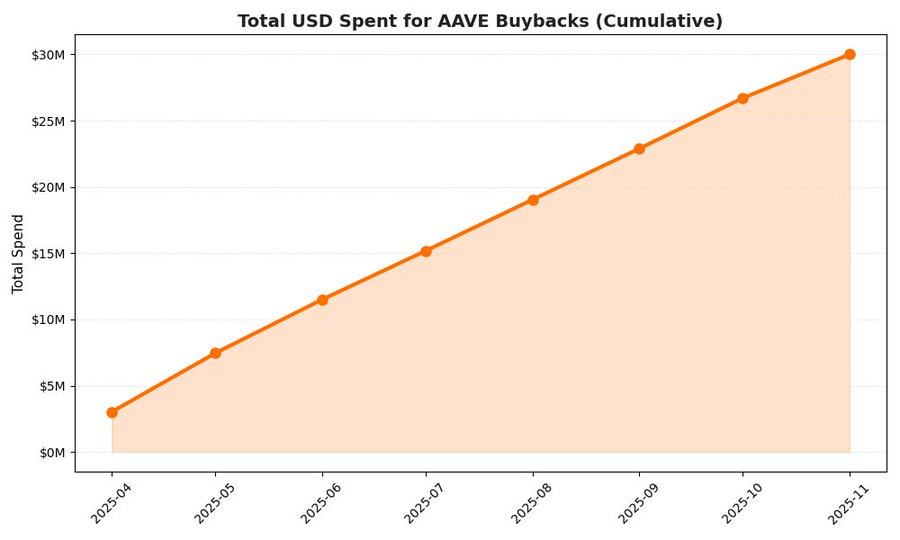
Cumulative data indicates that in the first 8 months after the buyback plan was initiated, Aave has invested approximately 30 million USD. To achieve the annual target of 50 million USD, the corresponding monthly average pace should reach about 4.17 million USD. Currently, the actual executed monthly average pace is about 3.75 million USD. Based on the current speed, the annualized buyback scale is approximately 45 million USD, corresponding to about 10% deviation from the target.
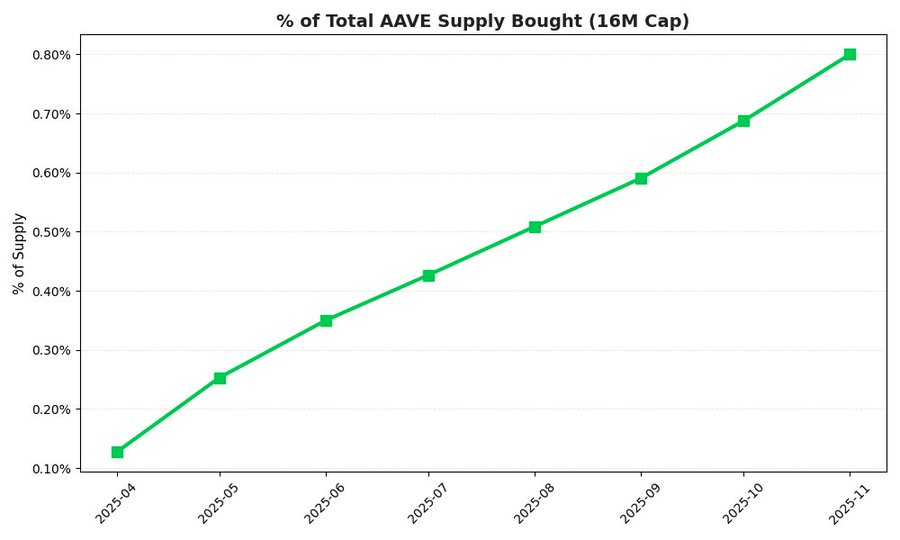
The buyback mechanism has already exerted quantifiable deflationary pressure on token supply: in just 8 months, the protocol has repurchased about 0.80% of the total supply (16 million AAVE).
Conclusion
From the protocol perspective, Aave is evolving from a single lending protocol into a foundational liquidity layer: the revenue model is gradually entering a mature range, GHO opens up a second growth curve for vertical integration, and the buyback mechanism begins to impose real and quantifiable deflationary constraints on the supply side—these changes will not be fully priced in during a single bull-bear cycle, but they are quietly altering AAVE's long-term risk-return structure.
Short-term price fluctuations are inevitable, but if viewed from a longer-term, more infrastructure-oriented asset allocation logic, AAVE still stands as a quality choice.
免责声明:本文章仅代表作者个人观点,不代表本平台的立场和观点。本文章仅供信息分享,不构成对任何人的任何投资建议。用户与作者之间的任何争议,与本平台无关。如网页中刊载的文章或图片涉及侵权,请提供相关的权利证明和身份证明发送邮件到support@aicoin.com,本平台相关工作人员将会进行核查。


