Last night, after a downward spike, Bitcoin experienced a significant rebound with high volume, entering a rebound phase in the short term.
Due to the intense fluctuations yesterday, today we will systematically review the logic from the weekly → daily → 4-hour and 1-hour charts.
I. Weekly Chart: Continuation Logic After Structure Turns from Bullish to Bearish
- The bearish trend that started from 124,000 has been confirmed.
We have warned about the top risk since 124,000. Subsequently, the price broke below the 50-week moving average of 100,200, which confirmed the trend reversal. From the weekly structure, this is not a simple pullback like in the past, but a clear shift from bullish to bearish.
The 50-week moving average has changed from a past support level to a current bearish pressure level, which is very crucial.
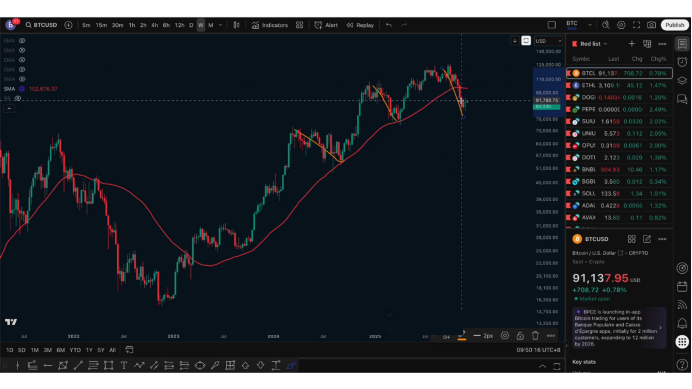
- After a structural break, a "second confirmation" often occurs.
After important moving averages are broken, the market often provides a second confirmation pullback.
If this occurs, it usually represents a relatively ideal and safe entry zone for bears, and often serves as the upper limit for rebounds.
Of course, a second confirmation is not guaranteed, but if it appears, the position becomes very clear:
Resistance Zone = 50-week moving average (100,200) -- Round number 100,000
- MACD shows that bearish momentum is starting to weaken from strengthening.
The two moving averages of the current weekly MACD are still diverging, indicating that bearish strength is still ongoing, but the "bearish divergence" has reached a low point in recent years and is beginning to shift from strengthening to weakening.
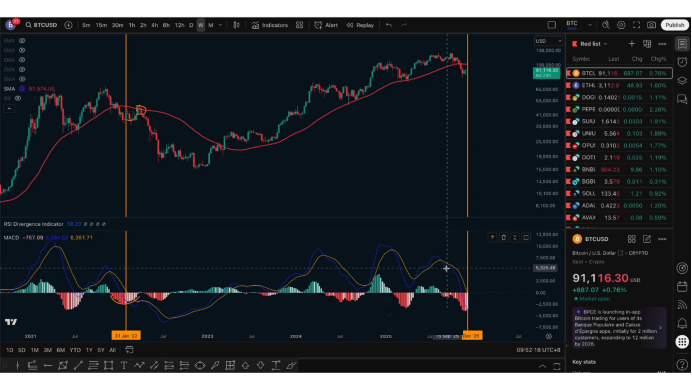
In similar past positions, this often means:
Moving averages shift from "diverging" to "converging."
The weekly chart may enter a phase of rebound or sideways adjustment.
However, this does not indicate a trend reversal, just a change in rhythm.
If the weekly chart truly enters an adjustment, its maximum rebound level still points to 100,200.
Key Levels: 100,200 and 100,000
100,000 is an important round number. If a rebound tests this level in the future:
If it cannot break through → Regular rebound ends here.
If it breaks through and stabilizes → It can easily trigger a significant false breakout, followed by a drop.
Our early bearish signal given at the 124,000 top position is fundamentally based on these long-term signals.
- Bearish target zone: 70,000—50,000 range.
After breaking the 50-week moving average, we provided a new bearish target:
Weekly VEGAS channel support zone = 70,000 to 50,000.
In other words, to see prices in the "60,000s" or even "50,000s," it would be a better spot for spot positioning.
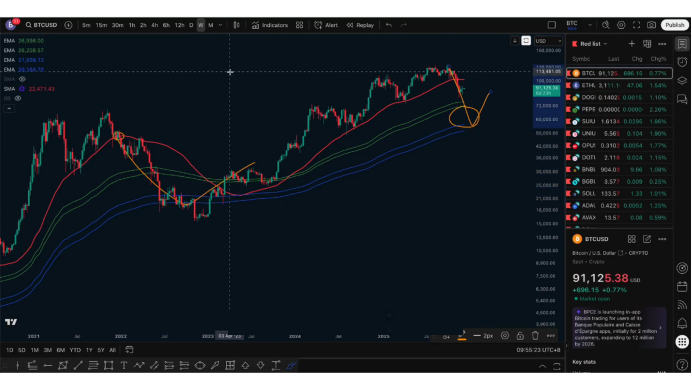
It is also possible that it stabilizes below 70,000, but the overall direction remains unchanged:
This segment of decline is more inclined to point towards the weekly level buying zone.
The weekly perspective has remained consistent and unchanged.
II. Hourly Level: The rebound is an adjustment, not a trend reversal.
In the weekend video, I mentioned: The current movement is likely a "channel adjustment," which has nearly completed.
- Standard channel structure.
From the starting point:
Main upward segment
After a pullback, a higher low appears
The high breaks again
The upper and lower boundaries of the channel are each tested twice.
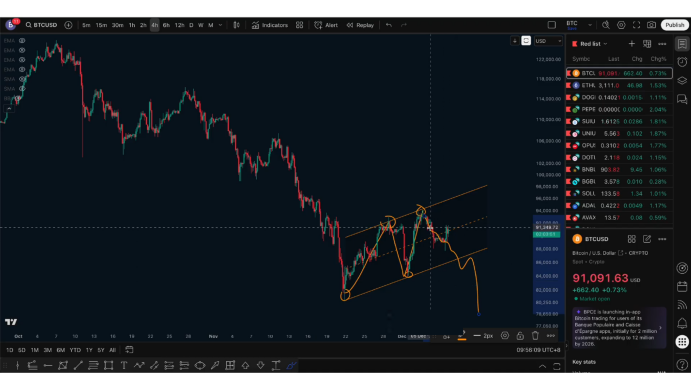
This is a typical channel adjustment structure.
If the channel is broken upwards, it indicates the end of the short-term adjustment, but does not mean a major trend reversal.
- Is it possible to challenge 100,000? The probability is low.
If we want to challenge 100,000 or further test 100,200,
A key prerequisite must be met:
94,000 must be effectively broken.
However, based on the current hourly structure and strength, such continuation signals have not yet appeared, so we will not consider the path of "directly hitting 100,000—100,200" for now.
- Last night's action resembled a "rebound after a false breakdown."
The behavior at the hourly level is:
First breaking the low → Liquidating shorts.
Then a volume surge → Liquidating longs.
Forming a shape similar to a "tower bottom," but not standard.
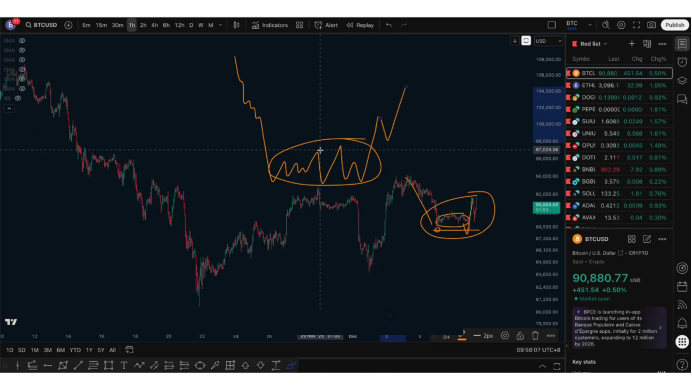
I have also emphasized:
A tower bottom requires wide fluctuations + sufficient turnover to have reference value.
However, the range of consolidation over the weekend was too small, and the turnover was insufficient, so it cannot be defined as a tower bottom.
This segment of the rise is essentially still an "adjustment rebound after a decline," not a trend reversal.
Follow me, join the community, and let's improve together. The article is published with a delay and is for reference only.

免责声明:本文章仅代表作者个人观点,不代表本平台的立场和观点。本文章仅供信息分享,不构成对任何人的任何投资建议。用户与作者之间的任何争议,与本平台无关。如网页中刊载的文章或图片涉及侵权,请提供相关的权利证明和身份证明发送邮件到support@aicoin.com,本平台相关工作人员将会进行核查。


