Master Discusses Hot Topics:
This week's market revolves around one thing: everyone is waiting for the Federal Reserve's announcement at 3 AM on the 11th. First, a rate cut is basically a done deal, which is not surprising. The key question is whether they dare to soften the expectations for rate cuts next year.
If they continue to act hawkish, prepare for a wave of collective selling. If they dare to follow Trump's lead and say something softer, then there might be a breather. Because I don't believe a word of the forward guidance from these people.
Looking back at last year's end, we can see that the market sentiment was already good around Christmas. Trump won the election, and the rate cut was implemented. However, old Powell gave a showy speech that crushed the expectations for rate cuts this year down to two.
The market was directly pressed down, and what happened? This year, there were four actual rate cuts, which indicates what? It shows that the plans these old wallflowers talk about are just to fool retail investors. When real trouble arises, they are more cowardly than anyone else.
It's the same now; whatever dot plot, just treat it as nonsense. If they say they want to control inflation, it means they are preparing to crush the American economy, likely leading to a recession. If they want to protect the economy, they can only cut rates faster and harder; inflation is just a scapegoat.
No matter how tough they talk, their actions are honest. Once the new Federal Reserve chair takes office, it will only align more closely with Trump's rhythm. The real rate cut channel will come sooner or later, but this December meeting is bound to be torturous.
Back to the market, the structure of Bitcoin is already very clear. The large range is from 74.5K to 124.5K, with the midpoint at 99.5K. This area is the most genuine average cost zone for the main players this year, a position that can easily be pushed back.
After reaching the high of 124.5K, it was smashed down to test the lower boundary of the weekly OB. Now this wave is just a standard rebound, not a bull market restart.
First, look for a test around 99.5K. If that position is rejected, it will continue to be pushed down to test the lower support. If it can forcefully stand above it, then it can grind sideways, and only then can we talk about moving up.
The weekly structure from 15K to 126K has completely finished its run; we are now in a standard down cycle. The first segment of the drop from 126.2K to 80.6K has ended, and the high point of this rebound is likely to be smashed down around 99K or 107K.
The support range from 74.6K to 86K is strong support, but it doesn't mean that touching it will always result in a bounce. It has already been tested three times, and it will continue to be volatile.
On the daily chart, 80.6K is just a temporary bottom, not a medium to long-term bottom. If you go to catch the so-called bottom now, you are basically taking over the main players' positions. After the rebound ends, a Bitcoin price in the 70K range is inevitable. Short-term resistance is at 94K and 99K, with support at 86K and 83.4K.
The surge in Bitcoin after 1 AM last night was a benefit given by the main players, directly pushing up a resistance level. Moreover, they have already started leaning towards buying call options before the meeting, indicating they are also speculating.
After breaking 91.3K, short sellers can only wait around 93.8K to 94.5K. As long as 94.6K holds, this area is basically the top level for shorts. Once 94.6K is breached, then wait for the fluctuation zone between 96.3K and 97.8K to continue.
97.2K is the 0.618 position of the previous drop, which means it is the limit of the rebound height and not so easy to stabilize. The high point of this week is likely to be the starting and ending point for next week.
Ethereum surged directly to 3150 in the early morning, and on a smaller scale, it has already given a stop signal for the rise. The surge from 2903 to 3150 at 10 PM last night, a 247-point increase, is already the daily limit; trying to stabilize here is purely a dream.
This is a standard short opportunity, first looking for a pullback to the 3062 to 3028 range. If it stabilizes, then it can attempt a second test of the pressure at 3222 to 3236, and later 3280, 3336, and 3372 will all be short positions.
Master Looks at Trends:
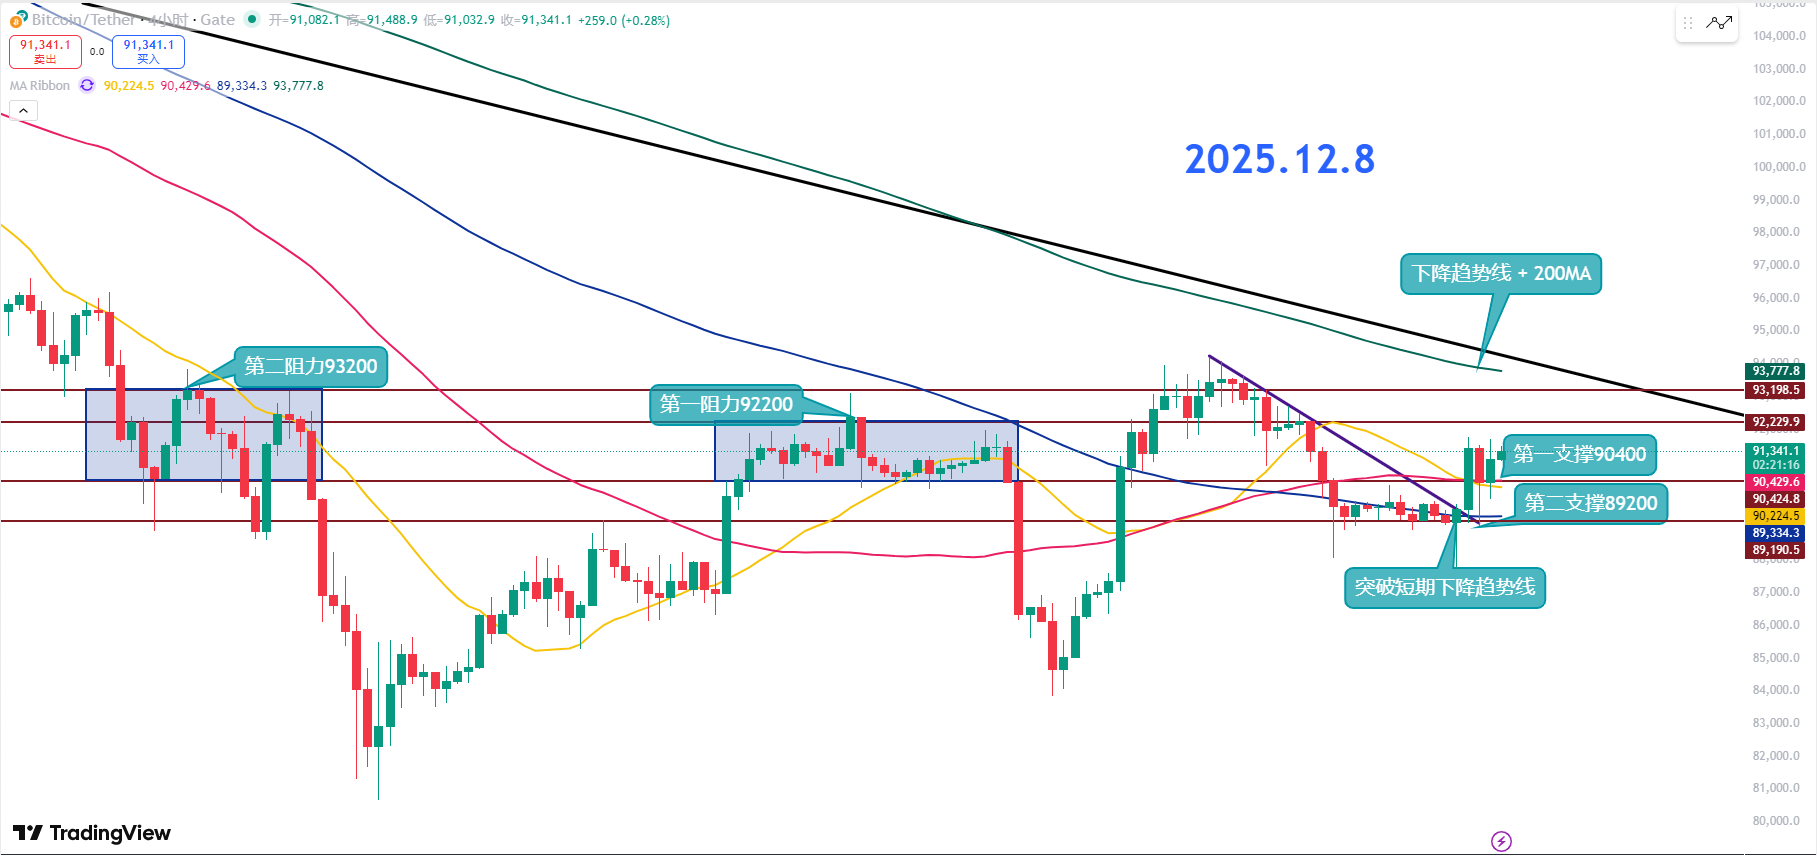
Resistance Level Reference
Second Resistance Level: 93200
First Resistance Level: 92200
Support Level Reference:
First Support Level: 90400
Second Support Level: 89200
Bitcoin has currently been forcefully broken through at 90.4K, with the pressure level converting to a support level. As long as the structure does not break 90K, a short-term rebound can be expected. The first resistance above is re-locked at 92.2K, which coincides with the upper Bollinger Band; this is not something that can be breached in one go.
The long-term descending trend line and the 200MA at the top are the real bull checkpoints. Until there is an effective breakthrough, high-level fluctuations and wash trading will still be the main theme, specifically targeting those who chase highs.
Below, we need to pay attention to the direction of the 20-day and 120-day moving averages, as this indicates the mid-term trend. The RSI value is around 57, still in a position that is neither up nor down. Although there is room for further upward movement, a pullback could happen at any time.
In the short term, aggressive traders can position themselves in batches near the first support at 90.4K; as long as it holds, it is a standard rebound structure. However, if 90.4K breaks, there is still a risk of further decline, so I prefer the cost zone to be around 89.2K.
As long as the first support at 90.4K can stabilize, the momentum to retest the first resistance at 92.2K will be greater. However, until the long-term descending trend line and the 200MA are broken, the market is likely to continue a slow rise and sharp downward movements.
12.8 Master’s Wave Strategy:
Long Entry Reference: Buy in the 89200-90000 range, Target: 91500-92200
Short Entry Reference: Light short in the 93200-94000 range, Target: 92200
If you truly want to learn something from a blogger, you need to keep following them, rather than making hasty conclusions after just a few market observations. This market is filled with performative players; today they screenshot long positions, and tomorrow they summarize short positions, making it seem like they "catch every top and bottom," but in reality, it’s all hindsight. A truly worthy blogger will have a trading logic that is consistent, coherent, and withstands scrutiny, rather than jumping in only when the market moves. Don’t be blinded by flashy data and out-of-context screenshots; long-term observation and deep understanding are necessary to discern who is a thinker and who is a dreamer!
This article is exclusively planned and published by Master Chen (WeChat public account: Coin God Master Chen). For more real-time investment strategies, solutions, spot trading, short, medium, and long-term contract trading techniques, operational skills, and knowledge about candlesticks, you can join Master Chen for learning and communication. A free experience group for fans has been opened, along with community live broadcasts and other quality experience projects!

Warm reminder: This article is only written by Master Chen on the official account (as shown above), and any other advertisements at the end of the article or in the comments are unrelated to the author!! Please be cautious in distinguishing between true and false, thank you for reading.
免责声明:本文章仅代表作者个人观点,不代表本平台的立场和观点。本文章仅供信息分享,不构成对任何人的任何投资建议。用户与作者之间的任何争议,与本平台无关。如网页中刊载的文章或图片涉及侵权,请提供相关的权利证明和身份证明发送邮件到support@aicoin.com,本平台相关工作人员将会进行核查。


