Odaily specially invited market analyst Conaldo, a master's degree holder in financial statistics from Columbia University, has focused on quantitative trading in the U.S. stock market since college and has gradually expanded to digital assets such as Bitcoin. He has built a systematic quantitative trading model and risk control system through practical experience; he possesses keen data insights into market fluctuations and is committed to continuous in-depth research in the professional trading field, pursuing stable returns. He will delve into changes in BTC's technology, macroeconomic factors, and capital flow weekly, reviewing and demonstrating practical strategies, and forecasting significant upcoming events for reference. 
Core Summary of the Weekly Trading Report: Last week's trading strictly followed the established strategy, successfully completing two short-term operations, achieving a total return of 6.93%. The following will detail the market prediction, strategy execution, and specific trading process.
I. Bitcoin Market Review for Last Week (12.01~12.07)
- Review of Core Views and Operational Strategies from Last Week:
In the previous periodical, the author clearly stated: using $89,000 as the boundary line for bullish and bearish judgments, and based on this, formulated corresponding operational strategies, with specific content reviewed as follows:
① Review of Market Trend Prediction: Treating $89,000 as a key watershed in the short term. If it can effectively support, the price is expected to rebound; if it is effectively broken, it will initiate a downward trend.
Core Resistance Levels:
- First resistance zone: $94,000~$96,500
- Second resistance zone: $98,500~$100,000
Core Support Levels:
- First support level: around $89,000
- Second support level: $85,500~$88,000 area
- Important support level: around $80,500
② Review of Operational Strategies:
- Medium-term strategy: Maintain about 65% medium-term short position.
- Short-term strategy: All short-term operations are based on the gains and losses at $89,000 as the final decision basis, with two response plans formulated:
- Plan A: If $89,000 support is effective, when the price rebounds to the $94,000-$96,500 range and encounters resistance signals, establish a 10% short position for the first time, with a stop loss set above $100,000. If the rebound continues and encounters resistance again near $98,500, add an additional 20% short position, with a unified stop loss above $100,000.
- Plan B: If the price effectively breaks below $89,000, directly establish a 20% short position, with a stop loss set near $92,000.
- Unified closing rules: When the price approaches the aforementioned important support levels and shows bottom resistance signals, consider partially or fully taking profits on short positions.
- Last week, two short-term operations were successfully completed according to plan (Figure 1), achieving a total return of 6.93%. The specific trading details and review are as follows:
Bitcoin 30-Minute K-Line Chart: (Momentum Quantitative Model + Spread Trading Model)
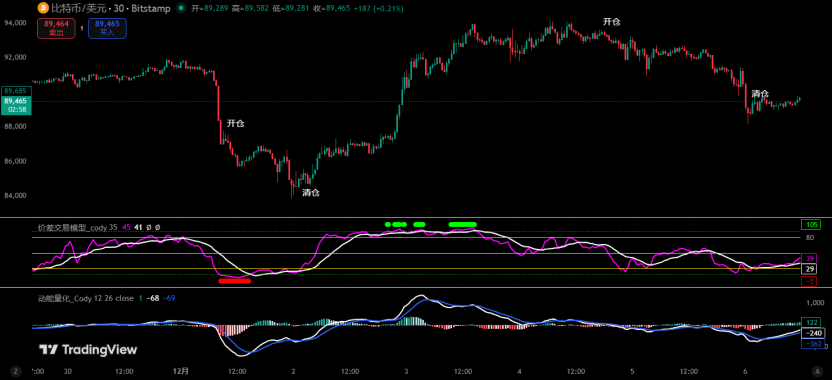
Figure 1
① Summary of Trading Details: 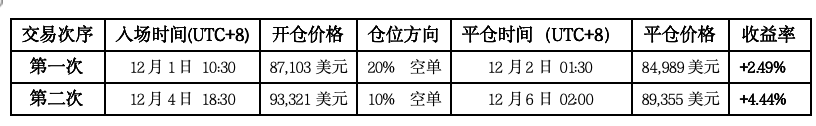
② First Trade (Profit 2.14%): This operation was a classic execution of Plan B. After Bitcoin's price effectively broke below the key point of $89,000, a 20% short position was decisively established at $87,103, and ultimately closed for profit near the second support area at $84,989. This operation perfectly exemplified the trading discipline of "follow the break."
**③ Second Trade (Profit 4.44%): This operation was an accurate implementation of Plan A. After the price found support at $89,000 and rebounded, patience was exercised until it entered the first resistance zone ($94,000~$96,500). When the price showed a signal at $93,321, a *10%* short position was established as planned, successfully capturing the subsequent pullback wave, and closed for profit near $89,355.**
**④ Profit Summary: Last week's strategy execution was highly aligned with market conditions, with both trades strictly following the preset entry, stop loss, and closing rules, successfully converting market fluctuations into actual profits, with total profits reaching **6.93%, validating the effectiveness of the previous strategy framework.
- Review of Core Bitcoin Data from Last Week:
- Opening Price: $90,369
- Lowest Price: $83,814 (Monday)
- Highest Price: $94,172 (Wednesday)
- Closing Price: $90,405
- Price Change: Weekly change of 0.03%, maximum fluctuation of 12.36%
- Trading Volume: $13.429 billion
- Trend: Wide fluctuations, weekly candlestick formed a "doji" with upper and lower shadows
- Review of Actual Market Movement Last Week:
Last week, Bitcoin exhibited a typical "violent wide fluctuation" pattern, with a rollercoaster of movements. The week ultimately closed up 0.03%, forming a "doji" bullish candlestick with upper and lower shadows. Specifically, after opening on Monday, the price quickly plummeted, effectively breaking below the key support of $89,000, reaching a low of $83,814 before stabilizing and rebounding, closing down 4.53% for the day. The following two days saw a "V" shaped reversal, with prices continuously rising, recovering all losses from Monday and even touching a weekly high of $94,172, with a cumulative increase of 8.18% over two trading days. After mid-week, the market weakened again, with the price experiencing a cumulative drop of 4.45% over two consecutive days before entering a narrow range of fluctuations until the weekend. Notably, the mid-week high of $94,172 closely matched the author's predicted first resistance zone of $94,000~$96,500, with a mere difference of $172. This once again validated the accuracy of the previous judgment on key resistance levels.
II. Systematic Technical Analysis: Comprehensive Assessment Based on Multiple Models and Dimensions
Combining last week's market operation, the author will comprehensively apply multi-dimensional analysis models to deeply analyze the evolution of Bitcoin's internal structure.
Weekly Level:
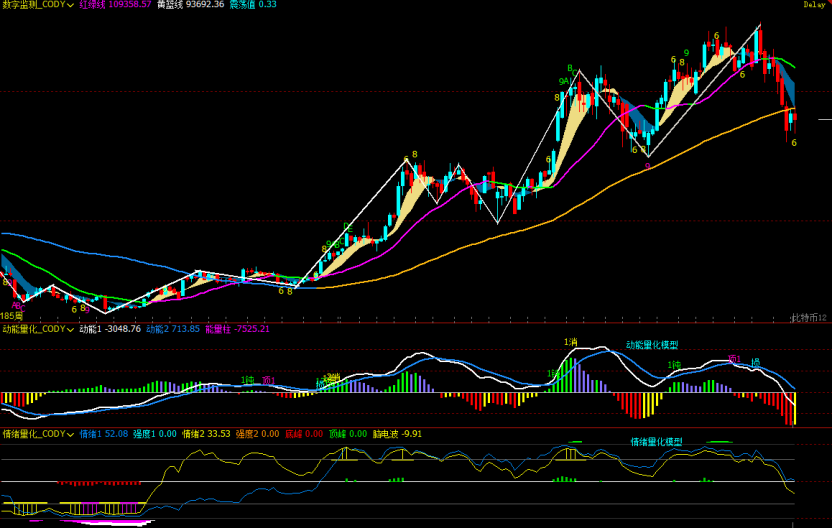
Figure 2
- As shown in (Figure 2), from the weekly chart analysis:
- Momentum Quantitative Model: After last week's movements, the two momentum lines continue to run downward, with the white momentum line having crossed below the zero axis for three weeks, and the blue momentum line about to cross below the zero axis. After two consecutive weeks of oversold rebounds, the energy (negative) bars have begun to shorten compared to previous weeks. The bullish forces must organize a significant counterattack to pull both momentum lines back above the zero axis; otherwise, the bearish side will release greater shorting energy.
Momentum Quantitative Model Indicates: Price Downward Index: High
- Sentiment Quantitative Model: Blue sentiment line value 52.08, intensity zero; yellow sentiment line value 33.53, intensity zero, peak value is 0.
Sentiment Quantitative Model Indicates: Price Pressure and Support Index: Neutral
- Digital Monitoring Model: No digital signals displayed.
The above data indicates: Bitcoin is in a downward trend, and the weekly level is about to enter a bearish market.
Daily Level:
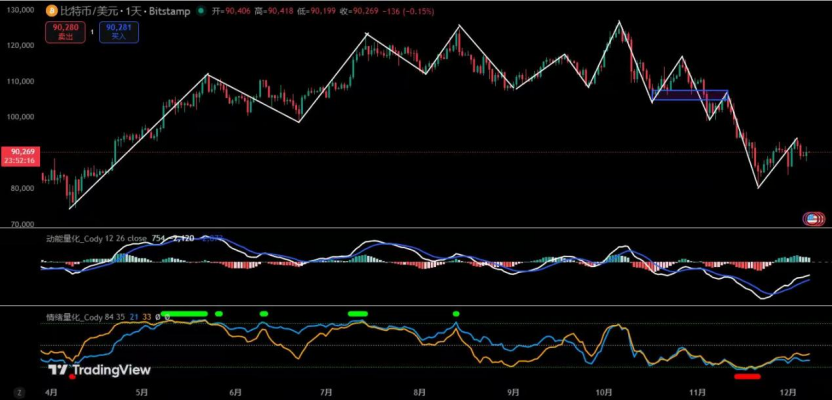
Figure 3
- As shown in (Figure 3), from the daily chart analysis:
- Momentum Quantitative Model: After a week of rebound, the two momentum lines continue to run upward below the zero axis and are gradually approaching the zero axis, but the energy bars have gradually shortened compared to previous days.
Momentum Quantitative Model Indicates: Bullish Rebound Momentum is Gradually Exhausting.
- Sentiment Quantitative Model: Blue sentiment line value 21, intensity zero; yellow sentiment line value 32, intensity zero.
Sentiment Quantitative Model Indicates: Pressure and Support Index: Neutral
The above data suggests: The daily level is in a bearish market, with an ongoing oversold rebound, but signs of weakening are emerging.
III. Market Prediction for This Week (12.08~12.14)
It is expected that the price will maintain a range-bound fluctuation this week. The author divides the market into three areas: $94,200~$91,000~$87,500~$83,500. Currently, it is in a narrow range of fluctuations between $91,000 and $87,000, and the market will choose a direction next.
Resistance Levels: First resistance at $91,000, second resistance at the $94,000~$96,500 area, and important resistance at the $98,500~$100,000 area.
Support Levels: First support at the $85,500~$87,500 area, second support at $83,500, and important support near $80,000.
IV. Operational Strategy for This Week (Excluding Sudden News Impact)
Medium-term strategy: Maintain about 65% medium-term position (short).
Short-term strategy: Utilize 30% of the position, set stop-loss points, and look for "spread" opportunities based on support and resistance levels. (Using 60 minutes/240 minutes as the operating cycle).
Based on the high probability of range-bound fluctuations this week, the author has formulated the following two plans for short-term operations to respond to market trends.
Plan A: If the market fluctuates upward at the beginning of the week: (Rebound Short Selling)
- Opening: If the price rebounds to the $91,000~$94,200 area and encounters resistance, establish a 15% short position.
- Adding Position: If the price continues to rebound and encounters resistance again near $98,500, add an additional 15% short position.
- Risk Control: All short positions have a stop loss set above $100,000.
- Reducing Position: When the price ends its rebound and moves downward, if it shows resistance near the first support level, 50% of the position can be closed.
- Closing Position: If the price continues to fall and shows resistance in the second support area, close the remaining position to complete this trade.
Plan B: If the market effectively breaks below the $87,500 support and tests lower: (Deep Drop Betting on Rebound)
- Opening: If the price drops to the $83,500~$80,000 area and shows a top signal, establish a 15% long position.
- Risk Control: Set the stop loss below $80,000.
- Closing: When the price rebounds to the $87,500~$88,000 area and shows a resistance signal, close all positions and take profits.
V. Special Reminders:
1. When opening a position: Immediately set the initial stop loss.
2. When profit reaches 1%: Move the stop loss to the opening cost price (break-even point) to ensure capital safety.
3. When profit reaches 2%: Move the stop loss to the position of 1% profit.
4. Continuous Tracking: After that, for every additional 1% profit, the stop loss will be moved up by 1%, dynamically protecting and locking in existing profits.
(Note: The above 1% profit trigger threshold can be flexibly adjusted by investors based on their own risk preferences and the volatility of the asset.)
VI. Macroeconomic and Capital Flow Analysis (12.8~12.14):
This week is the most critical "Super Central Bank Week" for global financial markets before the end of the year, with the core focus on the December Federal Reserve interest rate decision, the update of the dot plot, and Powell's speech. Although the market almost unanimously believes that this meeting will result in a rate cut, the real determinant for risk assets (including Bitcoin) is not the rate cut itself, but the Fed's guidance on the rate cut path for 2025. Therefore, this week's macroeconomic and capital structure will revolve around "expectation differences," and asset price fluctuations are expected to be significantly amplified.
From a macro perspective, this week features a dense array of key data: Tuesday's U.S. JOLTs job openings will reveal the extent of cooling in the job market; if it continues to weaken, it will strengthen the logic for an early rate cut; Wednesday's China CPI and social financing will determine Asian demand and liquidity direction; Friday's UK GDP and Eurozone CPI will influence global synchronized easing expectations. However, the importance of this data is clearly weaker than that of the Federal Reserve's meeting, and the market as a whole is entering a "waiting for the Fed to provide answers" state.
The tone of this Federal Reserve meeting is almost locked in for "December rate cut," but the dot plot will determine the market's direction for the next 3 to 6 months. If the dot plot is hawkish, only indicating 0 to 1 rate cuts in 2025, the market will quickly correct the current easing expectations, leading to rising U.S. Treasury yields, a stronger dollar, and short-term pressure on risk assets, with BTC potentially retesting the $85,000 area. If the dot plot is dovish, indicating at least 2 rate cuts in 2025, it suggests that the easing cycle may accelerate, leading to a rapid rebound in risk assets, with BTC likely to challenge above $90,000 again. Powell's speech will further influence sentiment; any emphasis on "sticky inflation" or "policy still needs to remain restrictive" will amplify short-term volatility.
From a capital flow perspective, the current market is generally in a state of indecision. BTC failed to effectively reclaim $90,000 over the weekend, but trading volume significantly decreased, indicating a slowdown in chip turnover, with retail sentiment stable and no panic selling. Institutional funds generally chose to reduce risk exposure before the "Super Central Bank Week," so there were no significant increases or withdrawals last week, typical of a "pre-meeting window period." The macro environment itself has not introduced new bearish factors; U.S. employment and inflation data continue to weaken, which actually increases the probability of entering an easing cycle in the medium term. This is also an important reason why BTC can maintain strong fluctuations at high levels.
Overall, the core variable for BTC this week is not sentiment or liquidity, but whether the Federal Reserve will provide guidance on a rate cut path consistent with market expectations. Positive factors include: a very high probability of a December rate cut, continued cooling in employment and inflation, and a high likelihood that the new Federal Reserve chair will be dovish, all supporting further easing in 2025. Risks mainly stem from a hawkish dot plot, Powell's tight rhetoric, and a decrease in January rate cut expectations, which could weaken short-term sentiment.
In summary, this week is a crucial time window for determining the trajectory of risk assets in 2025. The Federal Reserve's dot plot and attitude will directly impact BTC's medium-term trend. If the guidance is dovish, the market may welcome a year-end rebound; if hawkish, a short-term pullback may occur, but it will not change the medium-term bullish structure. For BTC, this week's fluctuations are not just short-term price changes but also a repricing of future trends.
The financial market is ever-changing, and all market analyses and trading strategies need to be dynamically adjusted. All views, analytical models, and operational strategies mentioned in this article are derived from personal technical analysis and are for personal trading logs only, not constituting any investment advice or operational basis. The market carries risks, and investment should be cautious; DYOR.
免责声明:本文章仅代表作者个人观点,不代表本平台的立场和观点。本文章仅供信息分享,不构成对任何人的任何投资建议。用户与作者之间的任何争议,与本平台无关。如网页中刊载的文章或图片涉及侵权,请提供相关的权利证明和身份证明发送邮件到support@aicoin.com,本平台相关工作人员将会进行核查。


