
25/12/07 BTC Weekly rebound is weak, long-term still in an upward trend, short-term may enter a small bear market
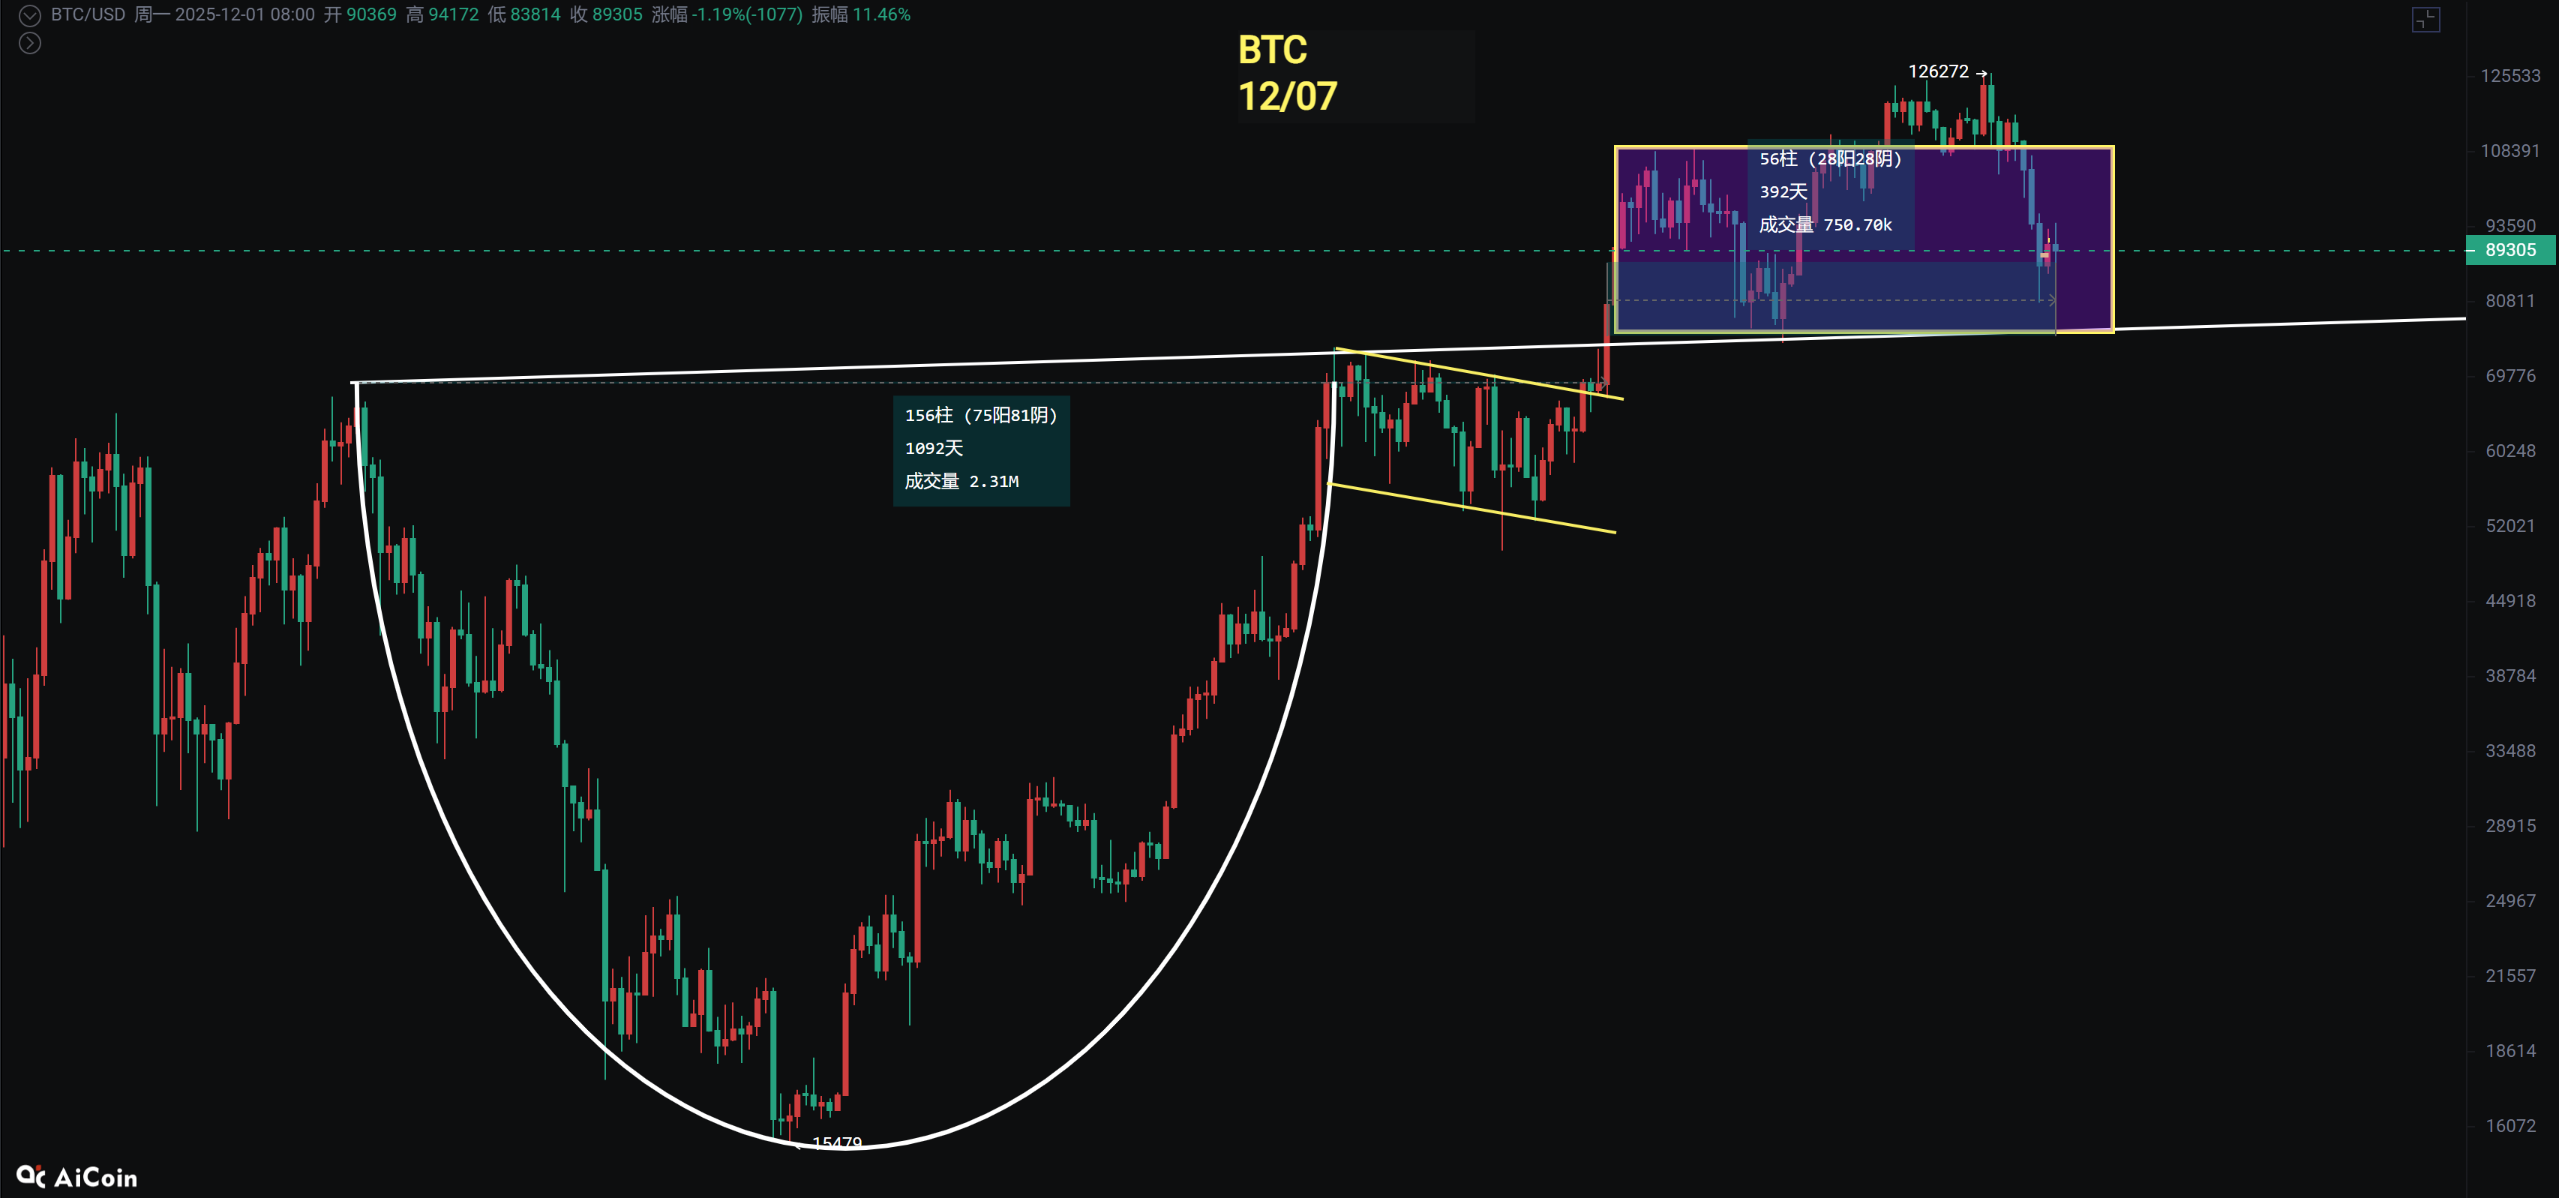
The Bitcoin weekly chart is about to close, but the rebound strength has not even broken through the first resistance level, indicating a weak rebound. The movement on Monday is quite critical, and we are still in a process of probing the bottom and building a base. From the monthly chart, it has been about 1092 days since the high point in 2021, forming a rounded bottom pattern before breaking through the upward flag. After breaking through 73777, it has been 392 days, and from the perspective of pattern and time space, it still shows a long-term upward trend. However, in the short term, it has fallen back to around 80600, entering a range or small bear market. Both CZ and JPMorgan believe the bull market is not over, and many people think the four-year cycle may not apply and could be extended. However, the short-term downward trend remains unchanged.
Bitcoin
The weekly upward trend line for Bitcoin has definitely been broken, and now we are looking at the support around 74,500. The daily line has dropped to the 0.886 level of the shark pattern. If it continues to fall below 80,600, there is a chance to break below the low of 74500, completing the 1.13 reversal of the shark pattern, which is the first scenario. The second scenario is that if the support around 74500 holds, it could form a very large box range, which would provide an opportunity for a one-sided move later on. Here, I refer to the historical trend of the gold ETF.
Support: 70000—74500
Resistance: 96000—101516
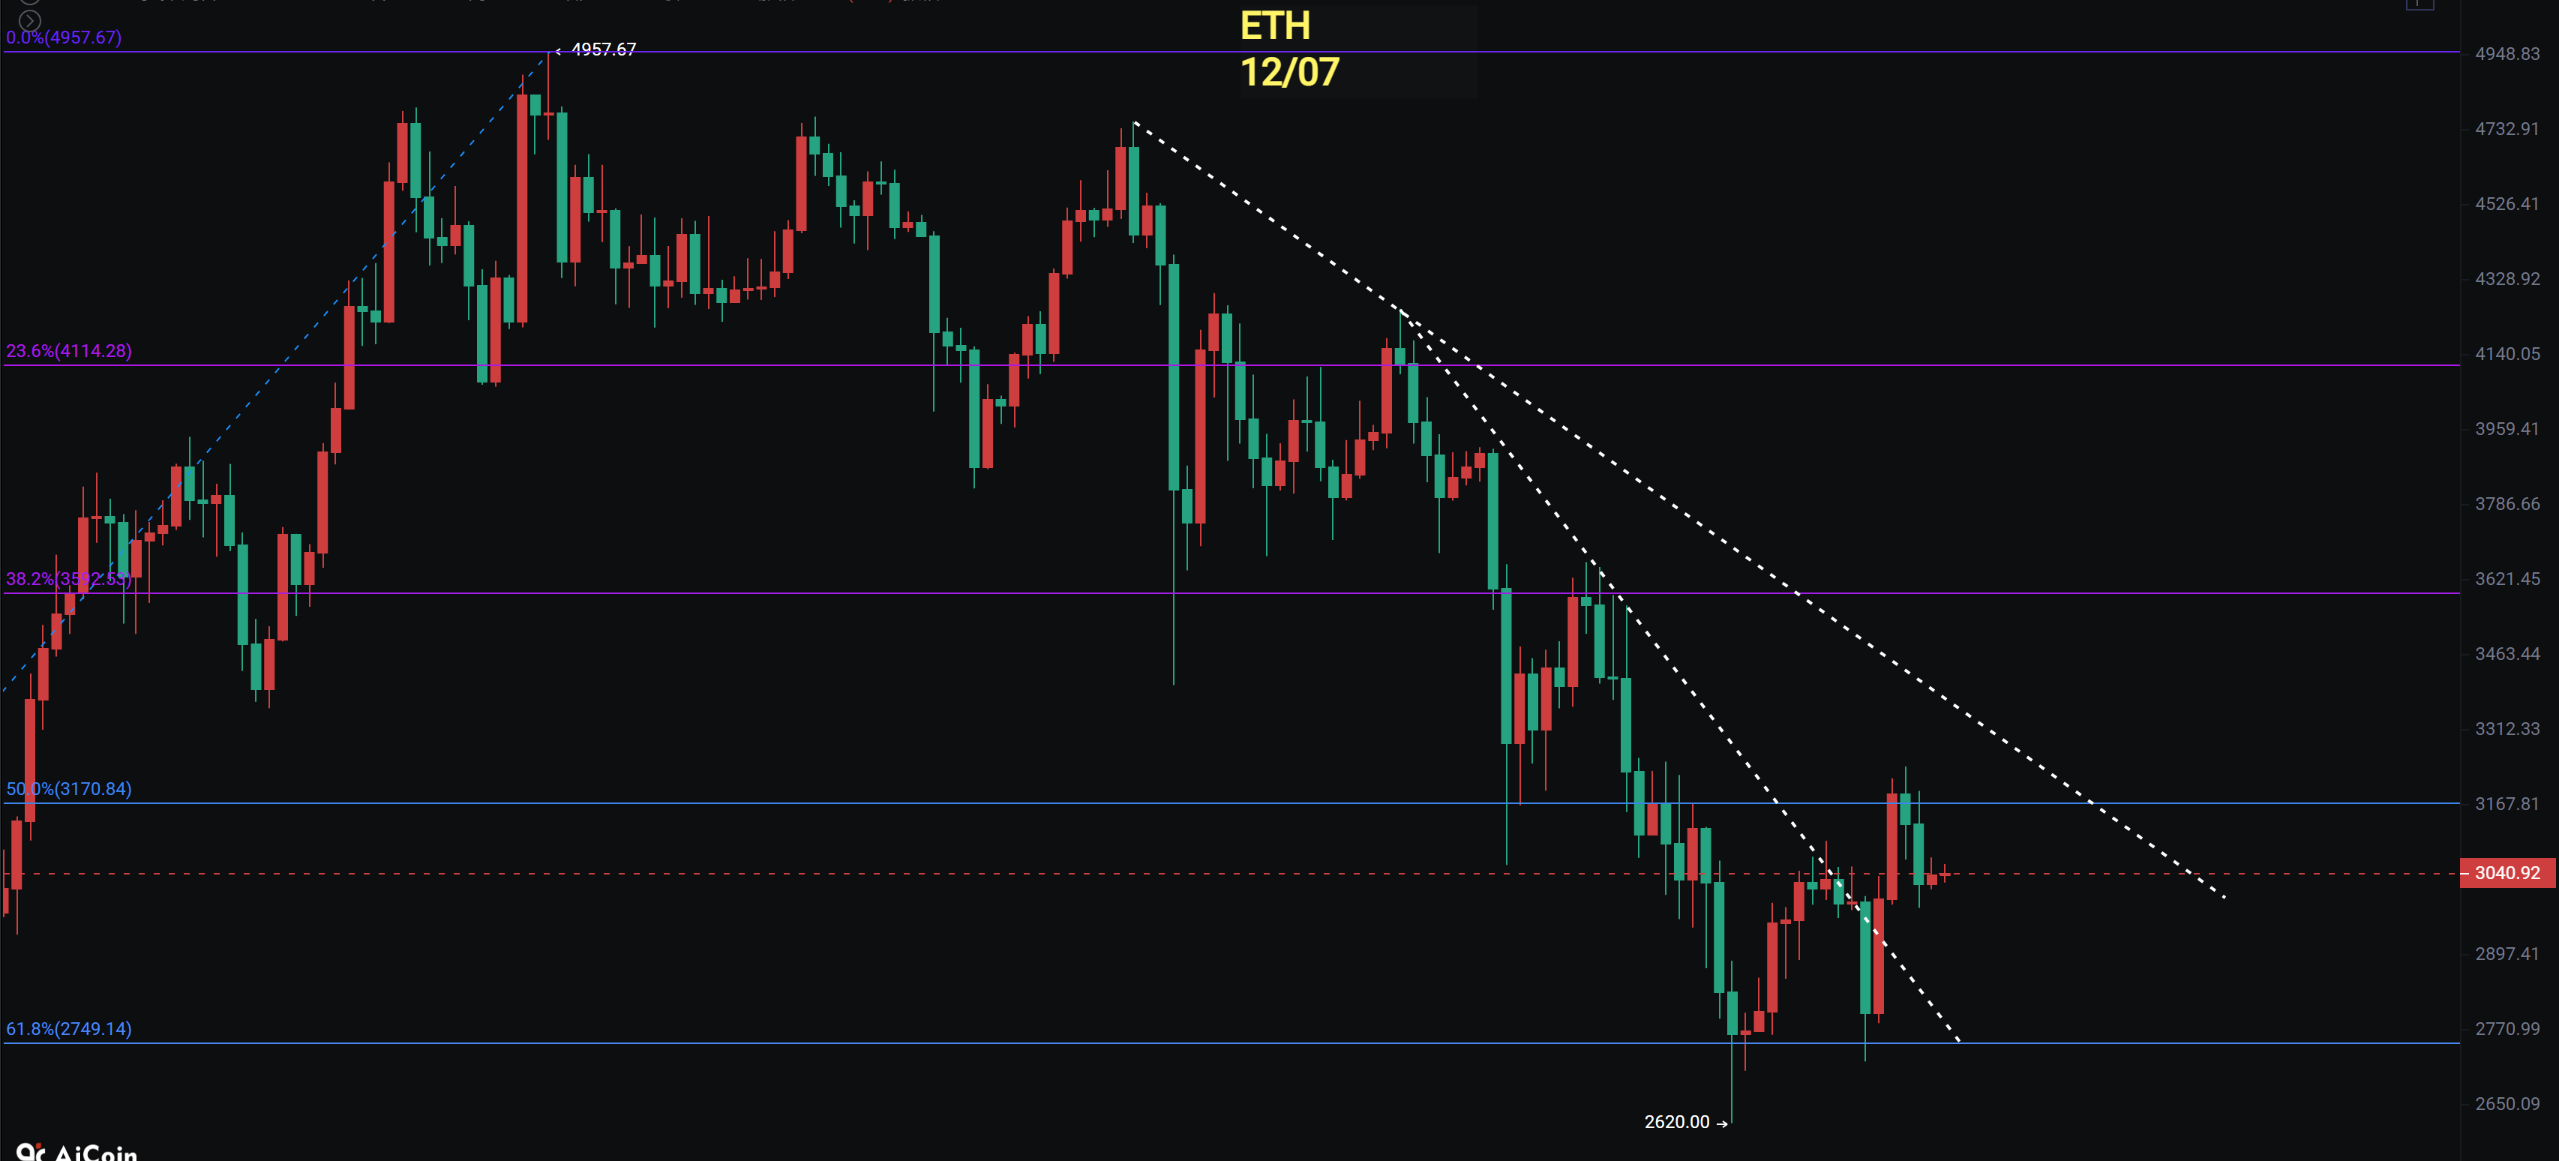
Ethereum
The weekly chart for Ethereum has also dropped to the Fibonacci 0.618 level, but the current rebound has not broken through a key resistance, so the rebound remains weak. However, the MACD histogram on the weekly chart has shortened, which is a positive sign. The daily downward trend line has still not been broken, so we can only wait.
A positive sign is that the ETH/BTC exchange rate has broken through on the daily chart, breaking a three-and-a-half-month downward trend. However, I believe that only a few altcoins will rebound strongly, while a large number still need to wait for Bitcoin to find a bottom. What is worth looking forward to is the annual Spring Festival market.
Support: 2620—2718
Resistance: 3240—3600
If you like my views, please like, comment, and share. Let's navigate through the bull and bear markets together!!!
The article is time-sensitive and for reference only, updated in real-time.
Focusing on K-line technical research, sharing global investment opportunities. Public account: BTC Trading Prince Fusu

免责声明:本文章仅代表作者个人观点,不代表本平台的立场和观点。本文章仅供信息分享,不构成对任何人的任何投资建议。用户与作者之间的任何争议,与本平台无关。如网页中刊载的文章或图片涉及侵权,请提供相关的权利证明和身份证明发送邮件到support@aicoin.com,本平台相关工作人员将会进行核查。


