Good afternoon, many people like to interpret market trends from various news sources. Why did it suddenly rise, and how did it suddenly drop when everything seemed fine? Is there any news behind it? The Federal Reserve's interest rate cut, Ethereum's upgrade—if we look for news, there will always be news to blame for the market movements. The impact of news is always temporary; ultimately, we must return to technical analysis. Here at Zhongliang, everything starts from the market itself, rationally analyzing from the structure of the candlestick chart.
The daily candlestick's rebound adjustment has already been completed. The upper Bollinger Band is opening downwards, creating pressure, and the middle band is also opening downwards. Currently, the price is fluctuating around the middle band for correction. The MACD bullish momentum continues to shrink, and the KDJ three lines are converging to form a death cross downwards. On the weekly candlestick, both the middle and lower Bollinger Bands are opening downwards, and the price is currently undergoing correction around the lower band. The MACD bearish momentum continues to expand. This is the information that the naked candlestick can provide us; next, we will interpret the market from the larger trend and structure.
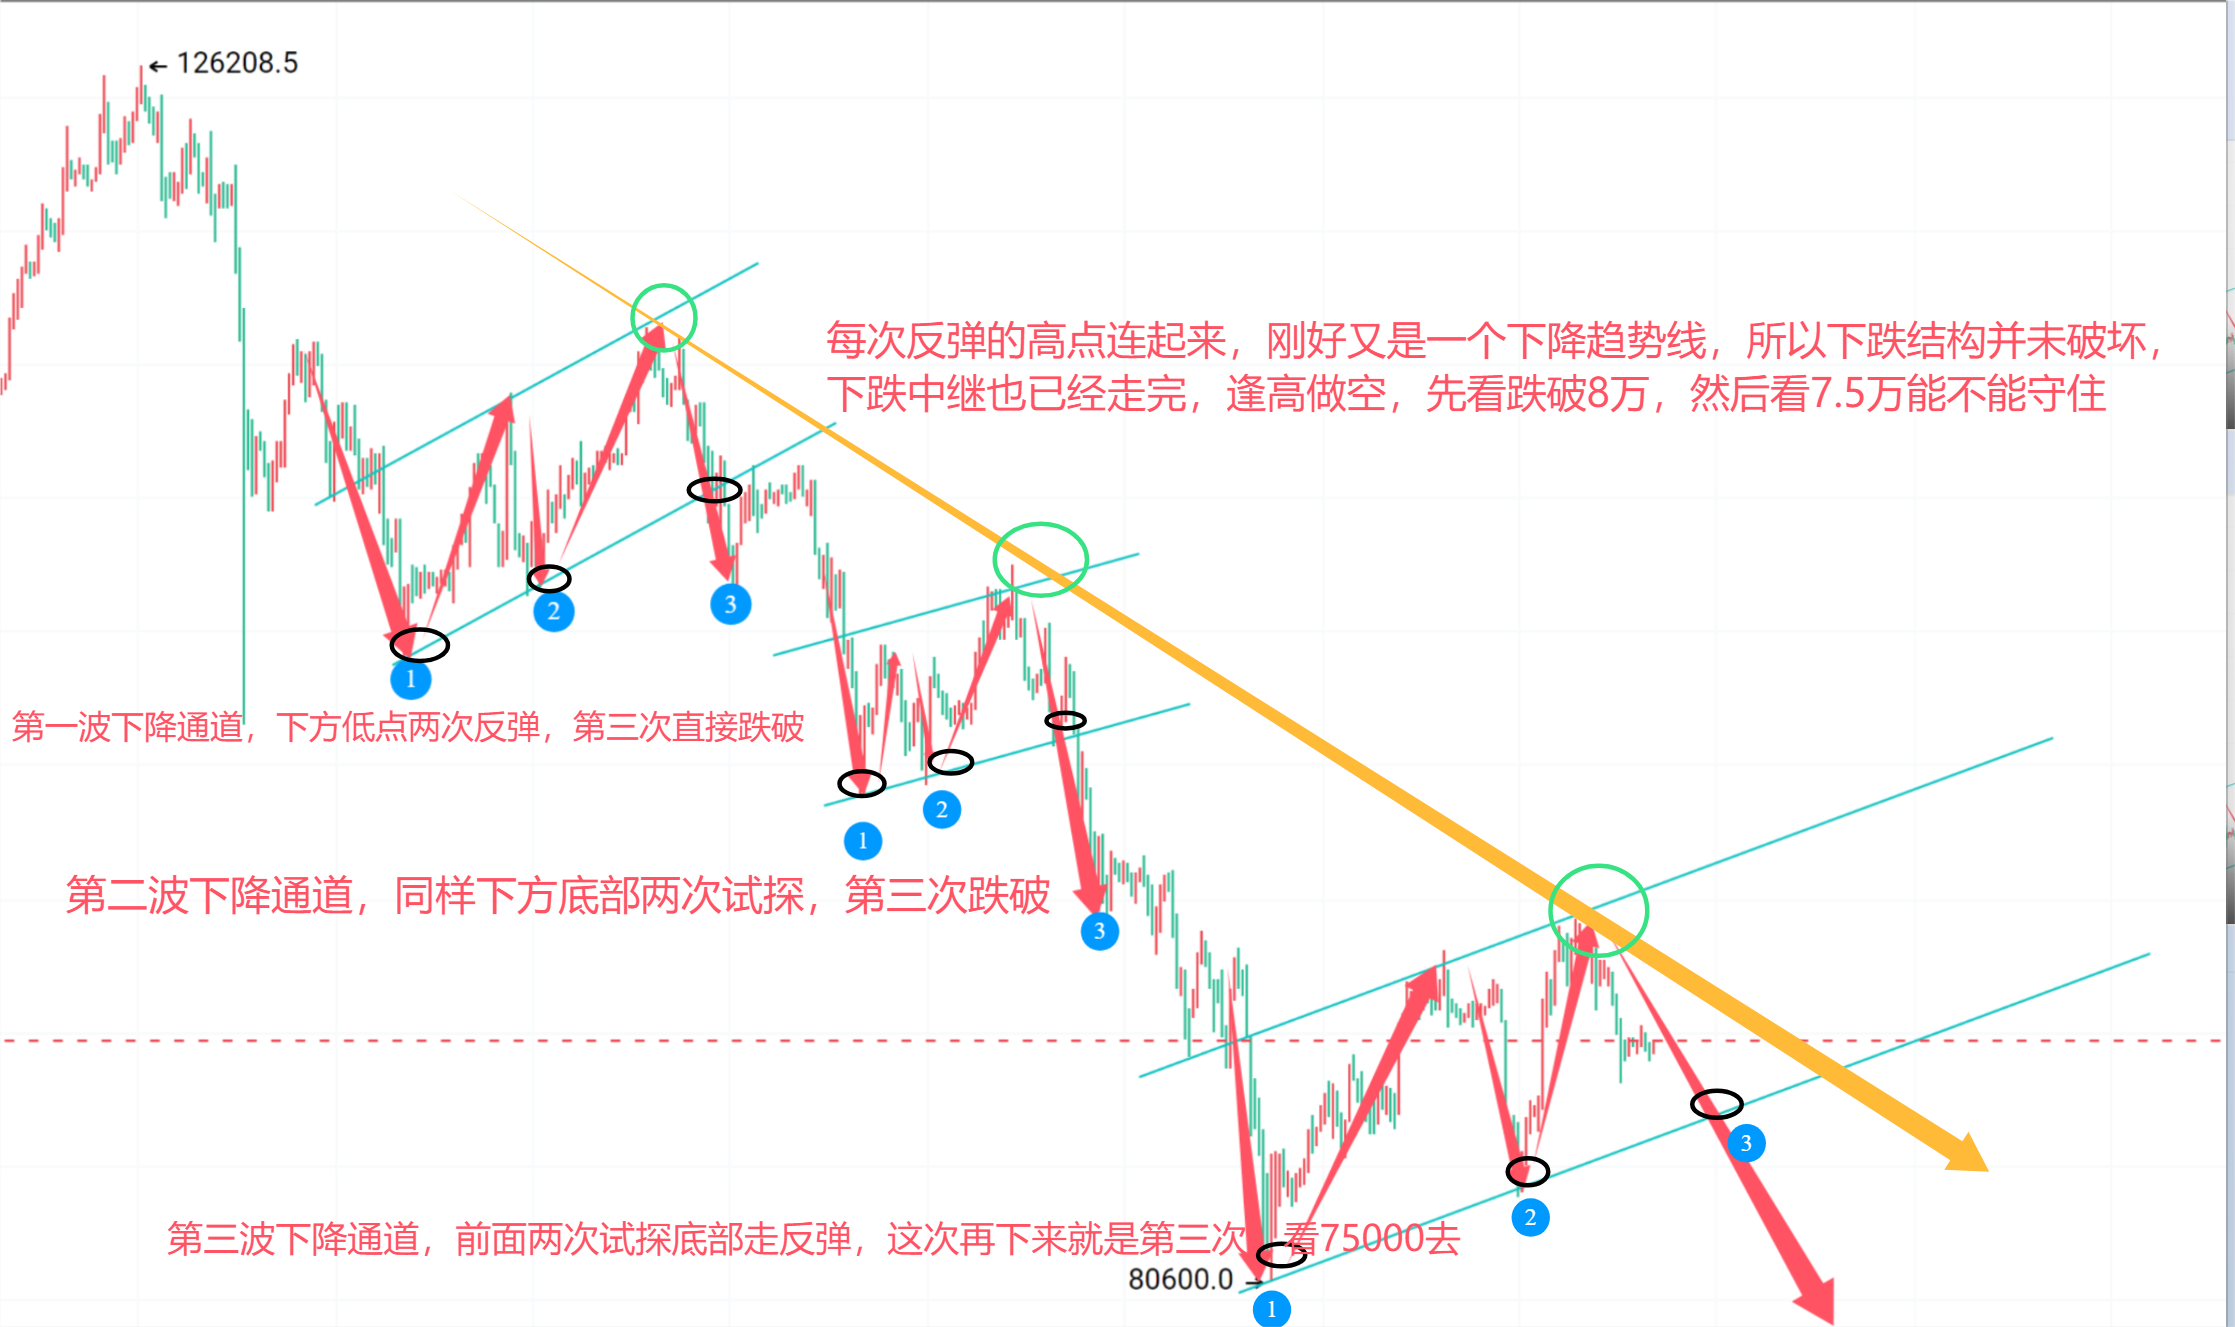
As shown in the figure, Bitcoin has been in a downward process since peaking at 126200. It is currently in the third descending channel. The first one started from 103470, which is the bottom, and the highest rebound reached 116380, which is the top, forming a descending trend channel. After testing the lower bottom twice, it broke down on the third attempt, breaking the descending trend channel and entering the next price channel. The second price channel has a bottom at 98888, which received support, and the highest rebound reached around 107470, also testing the lower bottom twice before completely breaking down on the third attempt, opening up downward space. Currently, the third price channel is being formed, with a bottom at 80600 receiving support for a rebound. The highest rebound has reached around 94100, and it is now undergoing a pullback. The lower bottom has also been tested twice. According to the patterns of the previous two waves, this wave should break below this bottom line to reach a new low, a lower position.
Of course, the above analysis is just a deduction and conclusion based on past trends. Looking at the high points of each rebound, if we connect the high points of these three rebounds with a line, it just happens to form a descending trend line. Therefore, regardless of the angle from which we analyze, the bearish trend remains unchanged, without a doubt! No matter how you shout slogans, the previous high of 126200 is currently in a process of rising and falling, which is a fact. In fact, there is no need to get tangled up in whether the bull is present or when it will return; if you can manage the daily and weekly volatility well, that is enough!
In conclusion, the viewpoint for Bitcoin next week is to short at highs. In Friday night's live broadcast, I provided a short at 90500 and 3100; hold steady and do not exit, as this may very well be the highest short position for next week. For those without short positions, watch for a rebound; the upper levels of 90500 and 91500 are opportunities to short at high volatility. For Ethereum, 3100 and 3190 are also opportunities for high short positions. For Bitcoin, the next targets are 85,000, then 80,000, and finally 75,000. For Ethereum, look down to 2850, 2720, and 2600, and 2400.

免责声明:本文章仅代表作者个人观点,不代表本平台的立场和观点。本文章仅供信息分享,不构成对任何人的任何投资建议。用户与作者之间的任何争议,与本平台无关。如网页中刊载的文章或图片涉及侵权,请提供相关的权利证明和身份证明发送邮件到support@aicoin.com,本平台相关工作人员将会进行核查。


