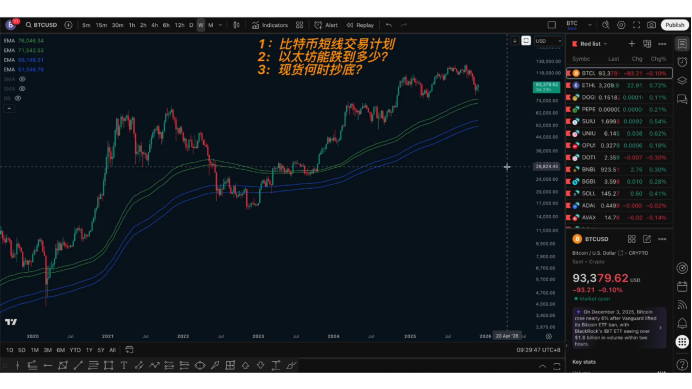
Today, we will mainly discuss three questions that everyone is most concerned about:
What is the short-term trading plan for Bitcoin, and how should we position ourselves next?
How much further can Ethereum drop?
When is the right time to buy the dip in the spot market? What price levels are more suitable?
- Bitcoin Short-Term Trading Plan: The rebound limit is likely at 102,000
■ The weekly level has already shifted from bullish to bearish
The 50-week moving average at the weekly level has been effectively broken and stabilized below, indicating that the trend has shifted from a weekly bullish to a weekly bearish.
Once this level of reversal occurs, it is difficult to easily turn back.
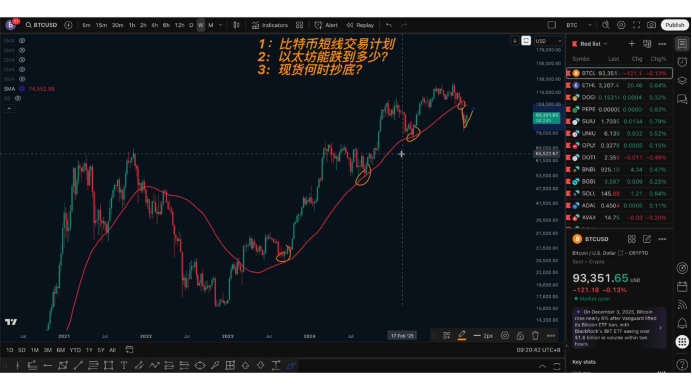
Therefore, this current rebound is essentially still a "pullback" within a bearish trend.
The upper limit of this rebound's pressure is at 102,000.
The reason is simple:
102,000 is where the weekly 50-week moving average is located.
This moving average was previously a strong support.
After being broken, it has now turned into strong resistance.
Such resistance levels usually require a "pullback confirmation," but may not necessarily break through.
If it really stands above 102,000 subsequently and stabilizes, then the previous weekly reversal will be proven to be a "false signal," but this probability is low.
- Short-Term Structure: There is room for a rebound, but it belongs to a repair within a bearish trend
■ From the 4-hour structure perspective
The price has formed a right-side elevated double bottom, and the neckline has been broken, indicating that a reversal at the hourly level has occurred.
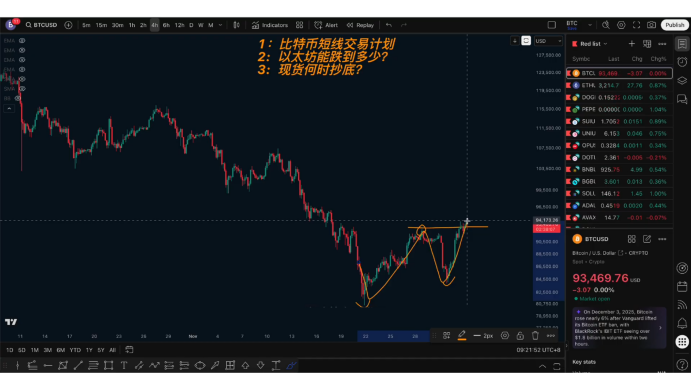
But be aware:
Hourly level reversal ≠ Daily level reversal ≠ Weekly level reversal
A small-level rebound is merely a "healthy pullback" under the larger bearish trend.
■ Where might the rebound go?
We can use "equidistant structure" to deduce:
➡ The expected rebound high point is likely around 96,800 to 97,000.
After this rebound ends, it is highly probable that a new downward phase will begin.
There are two possible short-term paths:
(1) The first: Rebound to 96,800–97,000 and then drop directly.
The structure is simple:
Rebound ends → Hourly level turns bearish → Initiate the next daily level decline.
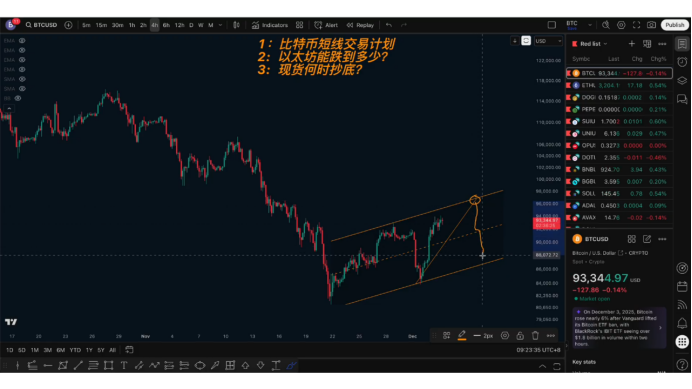
(2) The second: Rebound ends → Pull back to the trend line → Then make a higher rebound.
This segment may push to:
▶ Between 99,000–100,000
Even theoretically:
▶ The upper limit looks at 102,000 (extreme rebound point)

But no matter how it goes, 102,000 is a key resistance that is very difficult to break.
■ Our operational focus
There is not much room for bulls, so we will not chase long positions.
The real focus is:
✔ Wait for the rebound to end and then take a short position.
Signals to mainly observe:
A bearish structure reappearing at the hourly level
Or the emergence of a new double top/reversal pattern
Or a right-side bearish signal appearing near key pressure levels
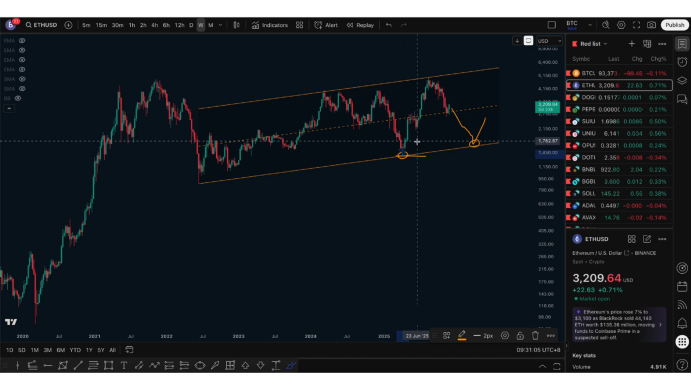
- The second focus: How much further can Ethereum drop?
Many people are more concerned about Ethereum, so I will be more straightforward here.
■ Ethereum is currently just a daily level rebound
The structure is similar to Bitcoin:
The daily level has formed a double bottom, but this is not a reversal, just an adjustment during the decline.
■ Estimated rebound target area: 3,300–3,400
The reason comes from:
Suppression by the daily descending trend line
A large number of previous rebound highs are moving downwards
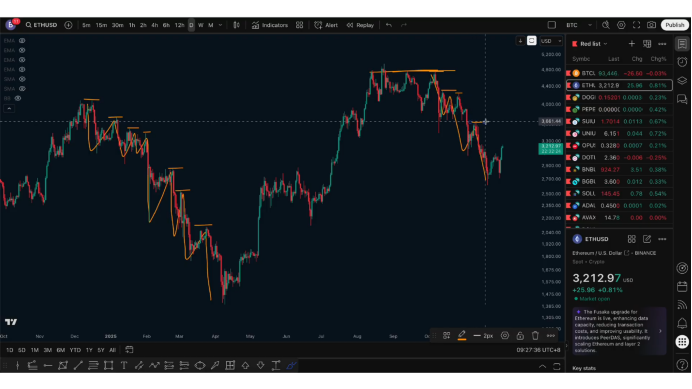
3,650 is a key pressure point, and it is difficult for the rebound to effectively break through.
Only if it truly breaks through 3,650, can there be a possibility of a real reversal (which is a low probability).
So I believe:
➡ The most likely stopping point for Ethereum's rebound is in the 3,300–3,400 range.
Once it reaches this range, combined with right-side signals at the hourly level, it becomes a more reasonable short position setup.
- Where might Ethereum ultimately drop to? When to buy the dip in the spot market?
■ If Bitcoin pulls back to the weekly Vegas channel
➡ Bitcoin's next phase may return to:
The 50,000–70,000 range
■ Ethereum's decline is usually deeper than Bitcoin's
Bitcoin has dropped about 38% during this period,
while Ethereum has dropped about 48%, which is 10% deeper.
■ Ethereum's weekly support is at 2,000–2,200
But I believe:
➡ This support is likely to be broken.
After breaking, it will complete a deep liquidation at the weekly level.
■ Ethereum is more likely to pull back to the upper edge of the weekly channel
This is a more critical point:
➡ The price corresponding to this structure is likely below:
2,000
✔ The real buying point for Ethereum in the spot market, I believe, is:
⭐ Below 2,000 is the reasonable area for spot positioning.
- The NUPO indicator is also indicating: It is far from the spot buying point
The NUPO indicator currently shows:
Ethereum is in the orange zone (not the bottom)
The real full position area for the spot market is in the red zone (below the 0 axis)
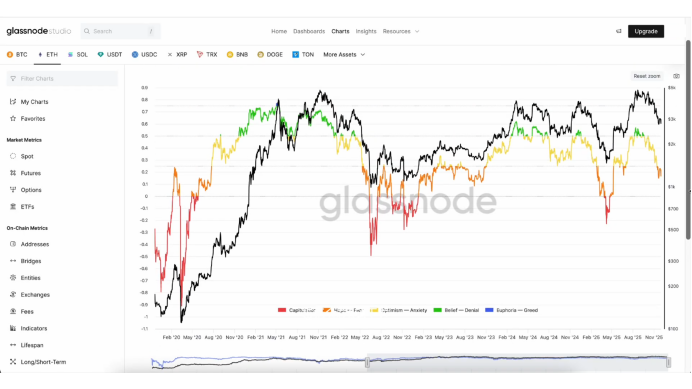
Bitcoin is similar:
Yellow → Orange → Red
(Red is the historically excellent spot area)
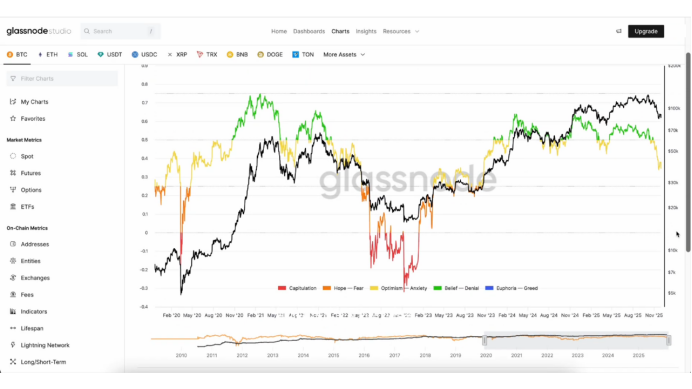
So:
➡ Whether BTC or ETH, it is still not the true spot buying point.
Follow me, join the community, and let's progress together. The article is published with a delay and is for reference only.

免责声明:本文章仅代表作者个人观点,不代表本平台的立场和观点。本文章仅供信息分享,不构成对任何人的任何投资建议。用户与作者之间的任何争议,与本平台无关。如网页中刊载的文章或图片涉及侵权,请提供相关的权利证明和身份证明发送邮件到support@aicoin.com,本平台相关工作人员将会进行核查。