Master Discusses Hot Topics:
Last night when that pile of data came out, to be honest, the figures from September are already meaningless. It's all old accounts from before the American shutdown, just take a look. What’s worth mentioning is the ADP non-farm payrolls, this data is simply astonishing. The previous value was revised from 42,000 to 47,000, and you thought it was still stable?
As a result, the latest figure directly dropped to -32,000, with employment not increasing but decreasing, which reflects the real employment environment in the U.S. Once the data was released, the market immediately sensed blood in the water, and the CME's probability of a rate cut in December skyrocketed to 89%. This wave is not just about poor employment; it’s so bad that it has cornered the Federal Reserve.
However, the market's play is ruthless; the higher the unemployment, the more assets rise. Because everyone is already psychologically prepared for such terrible employment, they instead treat it as a bet on rate cuts. In other words, the Federal Reserve hasn’t acted yet, and the market has already rebounded on its own.
As for the December meeting, if a hawkish rate cut operation really happens, it will need some theatrics for hedging. For example, if Trump replaces the Federal Reserve Chairman, and after the meeting, releases some labor and inflation data favorable for a January rate cut.
Also, regarding Japan, whether to raise interest rates around December 18, as long as they don’t throw a cold arrow at the market, it’s fine. In fact, everyone has some expectations, so it won’t suddenly plunge.
I still see the real main upward wave starting after January, at that time not only will the rate cut speculation continue. The SEC Chairman also came out to state that in January next year, they will provide innovation exemptions for crypto companies, which clearly indicates they are pouring oil into the market.
Whether the trend can officially establish a recovery will depend on that time, and the hardest technical point is that Bitcoin's K-line must stand above 101K; if it doesn’t, don’t talk about trend reversals.
Back to the market, the most important thing right now is two words: volatility. Don’t push it down; just stabilize the sentiment. The two expected patterns I provided in my analysis yesterday are both bullish, and now 93.4K has already broken through. The direction is very clear, continue to look upward, with the next target first aiming at 99K.
But here I must say, don’t think about taking off in one go all day long. There is a significant liquidity accumulation at 96.K, so remember to take some profits when approaching that area; otherwise, when it pulls back, you’ll start crying again.
However, ultimately, I still define the current trend as a rebound rather than a reversal. The current rebound has reached the third stage, with the first stage rebounding from 116.4K down to 93K and then pulling back to gather strength.
Now it’s a larger level, a rebound since the drop from 126.2K. The next level of pressure is 98K, which coincides with the Fibonacci 0.382 of the 4-hour downtrend. Whether this point can break through the rebound will be the core factor in determining whether the rebound can upgrade to a reversal.
On the Ethereum side, I mentioned in my analysis yesterday that breaking 3060 would lead to 3230. Sure enough, Ethereum is like it’s been injected with adrenaline, faster and more elastic than Bitcoin, with the first target of 3230 already reached.
The upper pressure level is now looking at 3660, and from the exchange rate structure, Ethereum's daily breakout will definitely perform stronger than Bitcoin, which is a highly certain trend.
Master Looks at Trends:
Resistance Level Reference
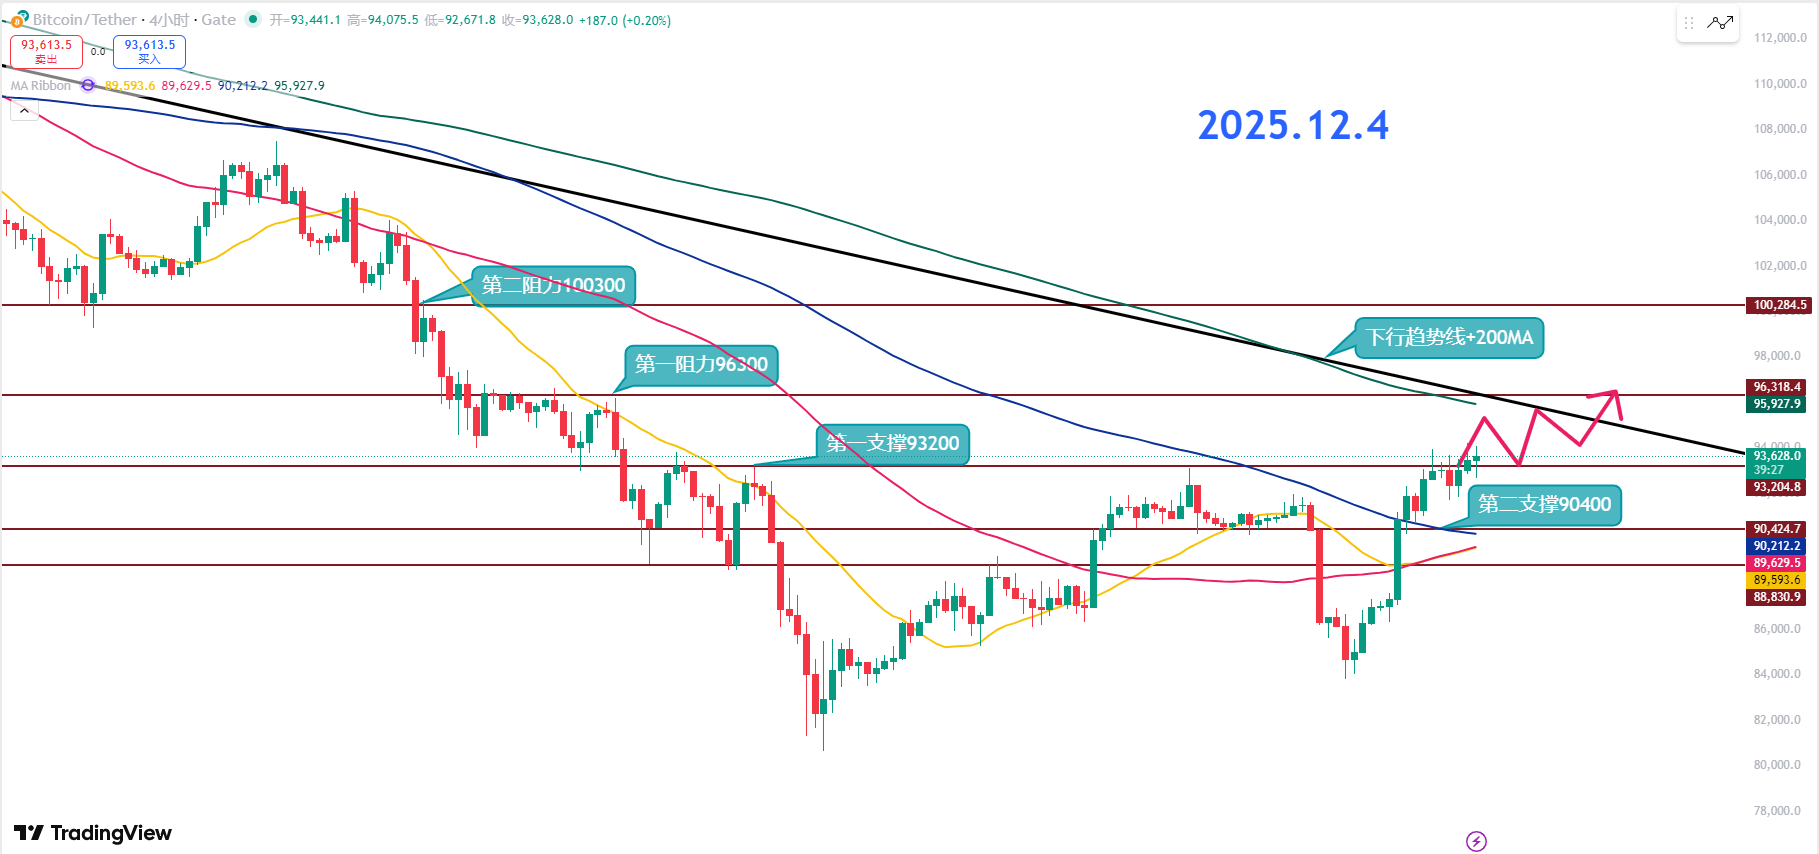
Second Resistance Level: 100300
First Resistance Level: 96300
Support Level Reference:
First Support Level: 93200
Second Support Level: 90400
The first resistance level of 93.2K that was focused on yesterday has now turned into short-term support, with 90.4K to 93.2K being a standard support concentration area. Bulls are in this pile of chips, with the upward target first looking at 96.3K.
The first resistance at 96.3K is a key pressure point where the 200MA and the downward trend line overlap; such positions generally aren’t broken through in one go. Most likely, it will need to touch it first, then pull back to wash out positions, before continuing to surge.
The current market needs a slight pullback; if it doesn’t break the previous low and raises the low points again, it can create a second test of 96K. The short-term first support is at 93.2K, with the second defense line at 92.5K, both of which are positions where one can gradually build up.
The theoretical maximum support below is at 90.4K, but if it really drops there, the bullish momentum will be cut down a notch, which is not conducive to further upward movement. Therefore, what’s more critical is whether the area around 92.6K can continue to raise the low points.
If the first resistance at 96.3K is touched and gives a reasonable pullback without breaking the level, the probability of a breakthrough will significantly increase. Once 96.3K breaks and stabilizes, a second test above the second resistance at 100K is highly likely to come.
12.4 Master’s Wave Strategy:
Long Entry Reference: Light positions in the 92500-93200 range, Target: 94500-96300
Short Entry Reference: Not currently referenced
If you truly want to learn something from a blogger, you need to keep following them, rather than making hasty conclusions after just a few market observations. This market is filled with performance-oriented players; today they screenshot long positions, tomorrow they summarize short positions, making it seem like they "catch the top and bottom every time," but in reality, it’s all hindsight. A truly worthy blogger will have a trading logic that is consistent, self-consistent, and withstands scrutiny, rather than jumping in only when the market moves. Don’t be blinded by exaggerated data and fragmented screenshots; long-term observation and deep understanding are necessary to discern who is a thinker and who is a dreamer!
This article is exclusively planned and published by Master Chen (WeChat public account: Coin God Master Chen). If you want to know more about real-time investment strategies, solutions, spot trading, short, medium, and long-term contract trading techniques, and K-line knowledge, you can add Master Chen for learning and communication. A free experience group for fans has now been opened, along with community live broadcasts and other quality experience projects!

Warm reminder: This article is only written by Master Chen on the official public account (as shown above), and other advertisements at the end of the article and in the comments section are unrelated to the author!! Please be cautious in distinguishing between true and false, thank you for reading.
免责声明:本文章仅代表作者个人观点,不代表本平台的立场和观点。本文章仅供信息分享,不构成对任何人的任何投资建议。用户与作者之间的任何争议,与本平台无关。如网页中刊载的文章或图片涉及侵权,请提供相关的权利证明和身份证明发送邮件到support@aicoin.com,本平台相关工作人员将会进行核查。


