Original Authors: CryptoVizArt, Chris Beamish, Antoine Colpaert, Glassnode
Compiled and Organized by: BitpushNews
Summary
- Bitcoin stabilizes above the True Market Mean, but the broader market structure now resembles that of Q1 2022, with over 25% of the supply in a loss state.
- Capital momentum remains positive, supporting consolidation, although it is far below the peak expected in mid-2025.
- The 0.75–0.85 quantile range ($96.1K–$106K) is a key area for restoring market structure; a drop below this level would increase downside risk.
- ETF fund flows have turned negative, and the cumulative volume delta (CVD) has declined, indicating weakening demand.
- Open interest in futures has decreased, and funding rates have reset to neutral, reflecting a risk-averse stance.
- The options market shows implied volatility (IV) compression and softening skew, with capital flows shifting from bearish options to cautious bullish option selling.
- Options appear to be undervalued, with realized volatility exceeding implied volatility, putting pressure on short-gamma traders.
- Overall, the market remains fragile, relying on maintaining key cost basis areas unless macro shocks disrupt the balance.
On-Chain Insights
Bottoming or Collapse?
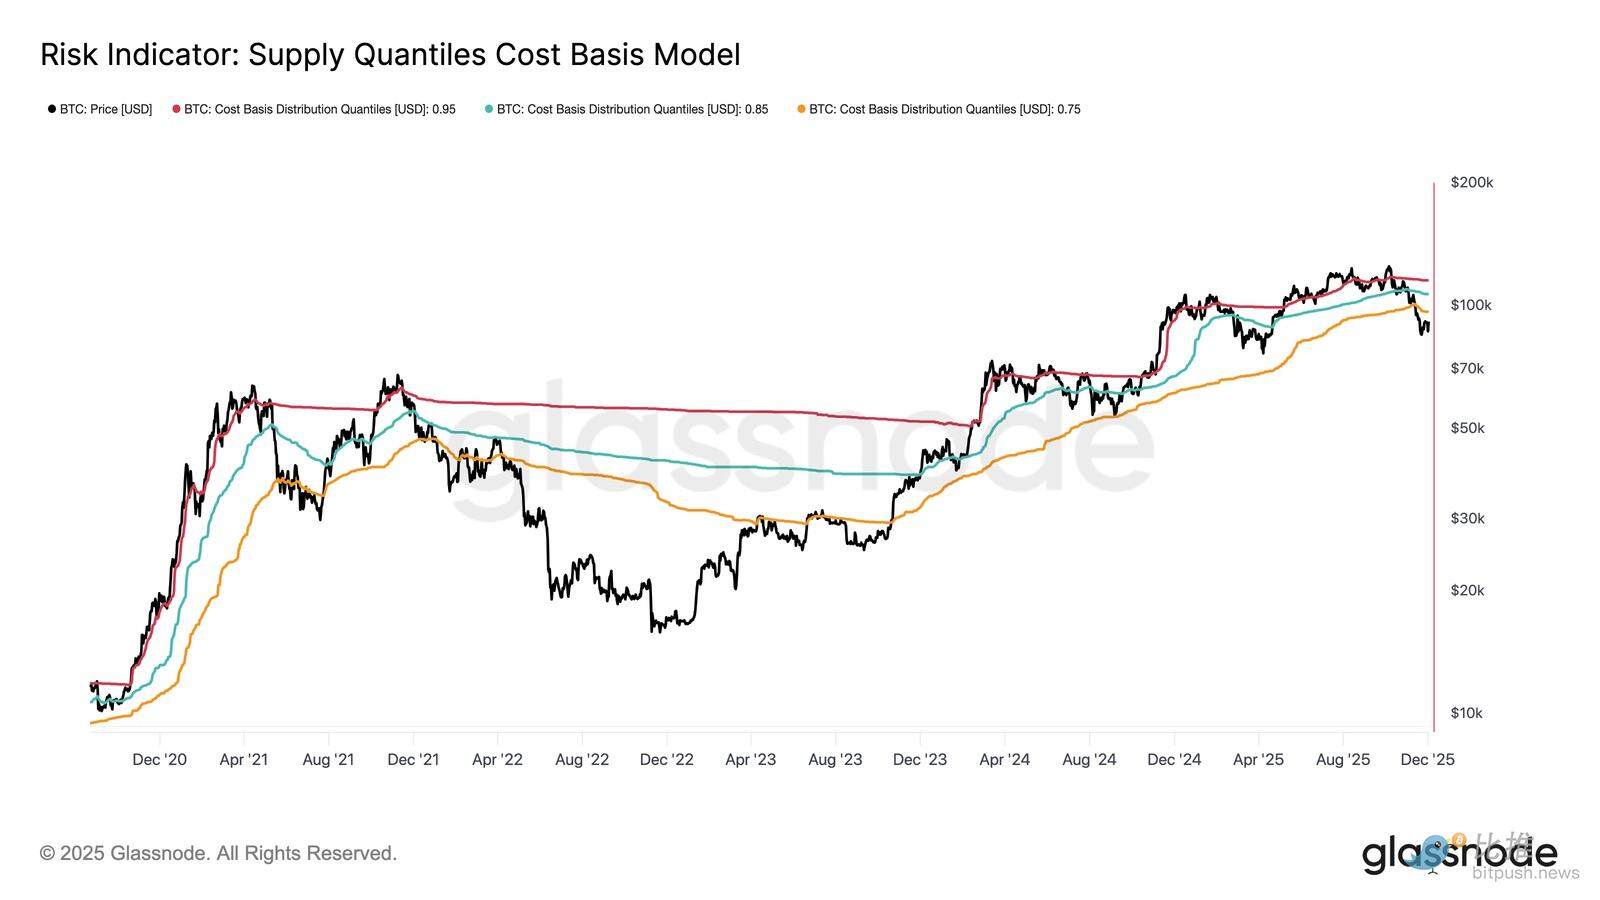
In the past two weeks, Bitcoin's price has dropped and found support near a key valuation anchor known as the True Market Mean—this is the cost basis for all non-sleeping coins (excluding miners). This level typically marks the boundary between a mildly bearish phase and a deep bear market. Although the price has recently stabilized above this threshold, the broader market structure increasingly echoes the dynamics of Q1 2022.
Using the Supply Quantiles Cost Basis Model (which tracks the cost basis of supply clusters held by top buyers), this similarity becomes clearer. Since mid-November, spot prices have fallen below the 0.75 quantile and are currently trading around $96.1K, resulting in over 25% of the supply being in a loss state.
This creates a fragile balance between the risk of top buyers capitulating and the potential for seller exhaustion to form a bottom. However, the current structure remains highly sensitive to macro shocks until the market can reclaim the 0.85 quantile (around $106.2K) as support.
Pain Dominates
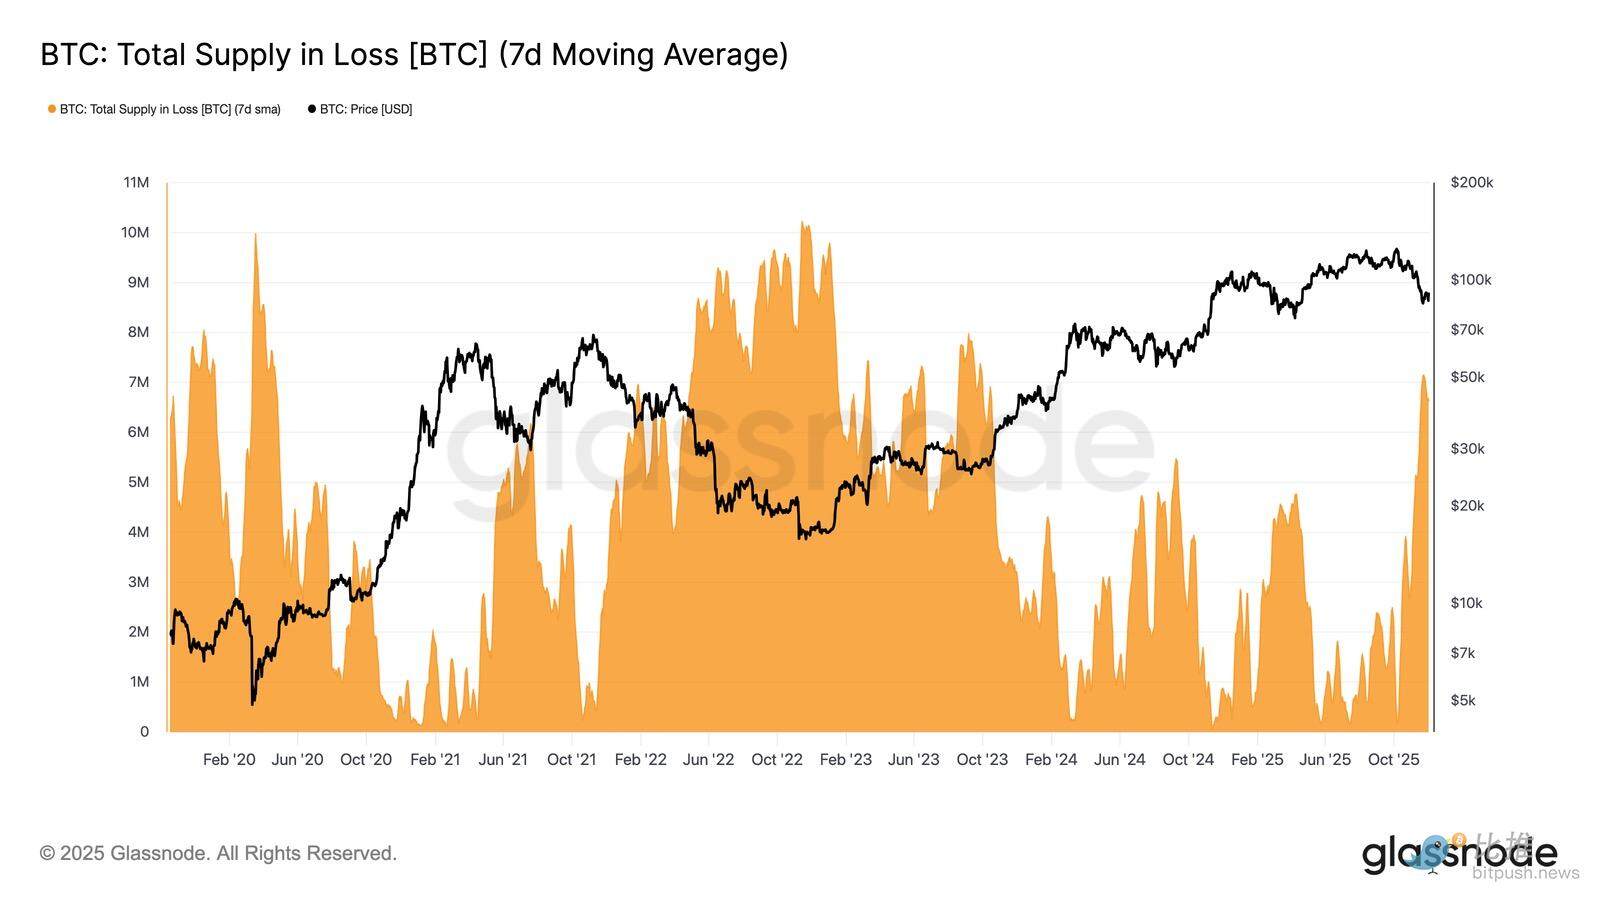
Based on this structural view, we can amplify the observation of top buyers' supply through the "Total Supply in Loss" metric to gauge the extent of loss dominance, i.e., unrealized pain.
The 7-day simple moving average (7D-SMA) of this metric climbed to 7.1 million BTC last week—its highest level since September 2023—highlighting that the price expansion of the bull market over the past two years is now facing two shallow bottom formation phases.
The current scale of supply in a loss state (between 5 million and 7 million BTC) is strikingly similar to the sideways market of early 2022, further reinforcing the aforementioned similarity. This comparison again emphasizes that the True Market Mean is a critical threshold for distinguishing between a mildly bearish phase and a transition to a more defined bear market.
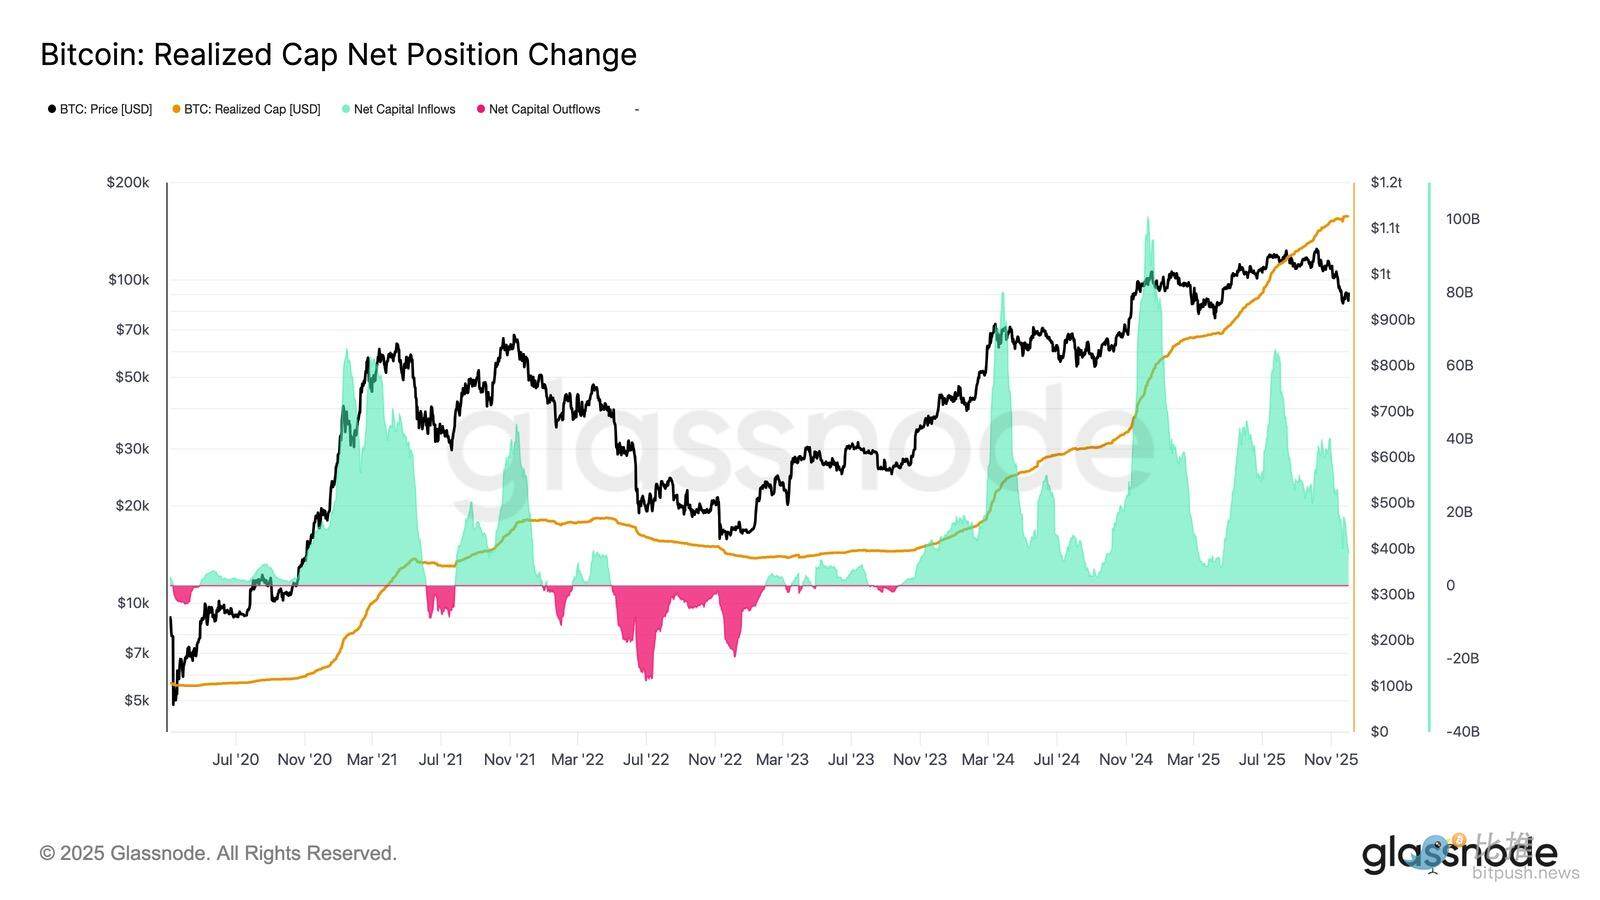
Momentum Remains Positive
Despite the strong similarities to Q1 2022, the capital momentum flowing into Bitcoin remains slightly positive, which helps explain the support near the True Market Mean and the subsequent rebound above $90K.
This capital momentum can be measured by the Net Change in Realized Cap, which is currently at a monthly level of +$8.69 billion—far below the peak of $64.3 billion/month expected in July 2025, but still positive.
As long as capital momentum remains above zero, the True Market Mean can continue to serve as a consolidation zone and potential bottoming area, rather than the beginning of a deeper decline.
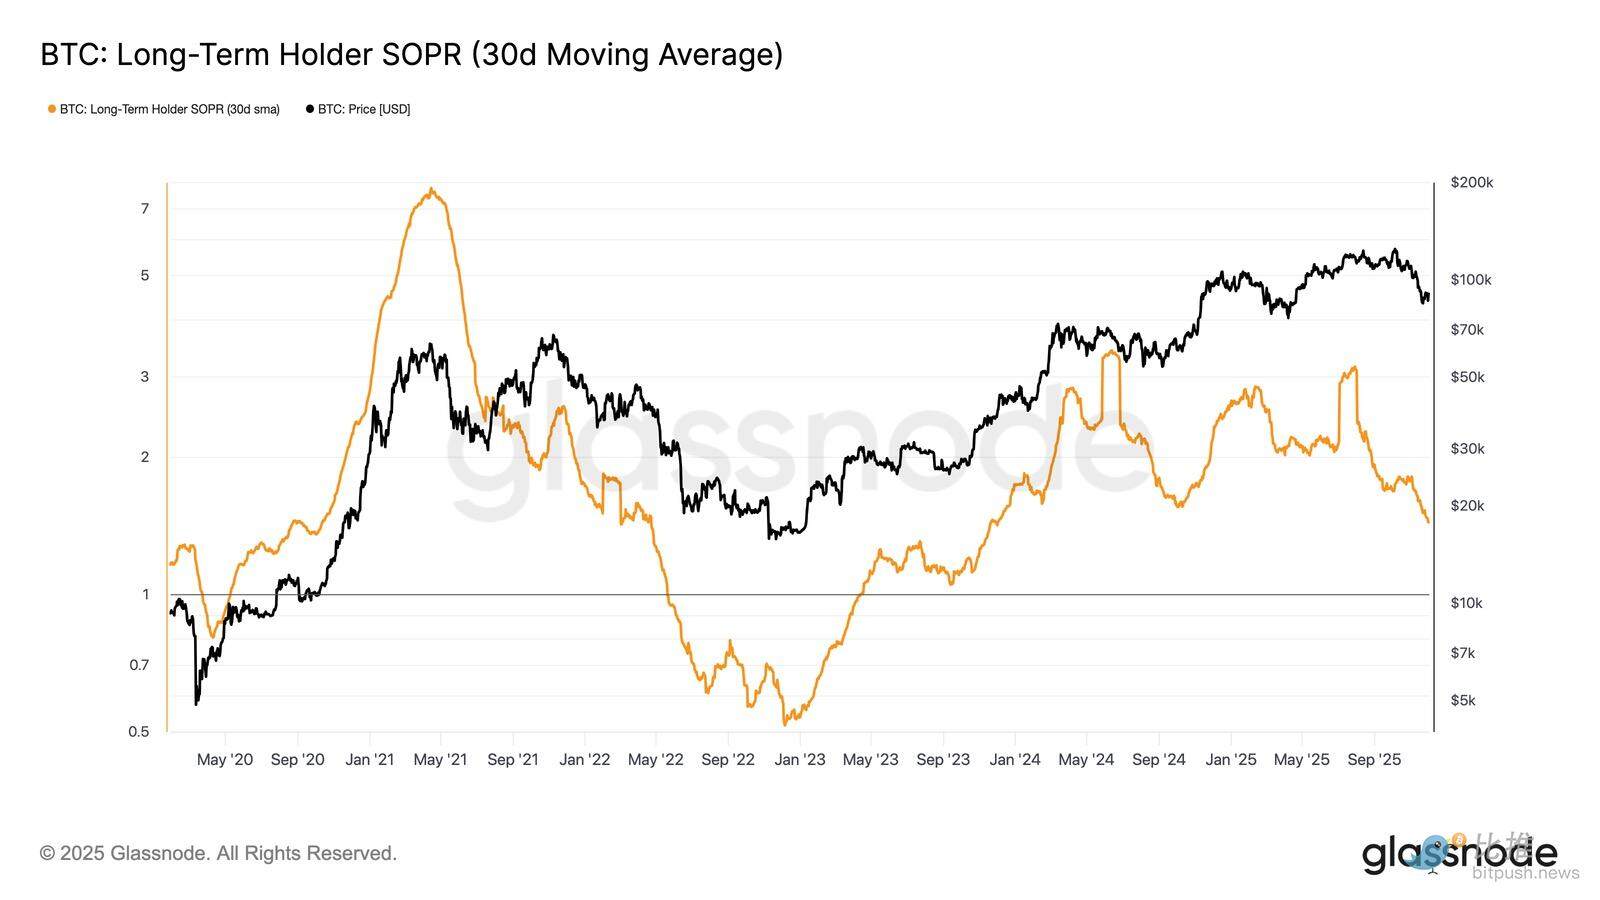
Long-Term Holder Profitability Declines
Maintaining a regime of positive capital inflows means that new demand can still absorb profit-taking from long-term investors. The long-term holder SOPR (30D-SMA, measuring the ratio of the spot price to the cost basis for active spending long-term holders) has sharply declined with the price but remains above 1 (currently at 1.43). This emerging profitability trend again resonates with the structure of Q1 2022: long-term holders continue to sell at a profit, but the profitability is shrinking.
Although demand momentum was stronger in early 2022, liquidity has continued to decline, forcing bulls to hold above the True Market Mean until a new wave of demand enters the market.
Off-Chain Insights
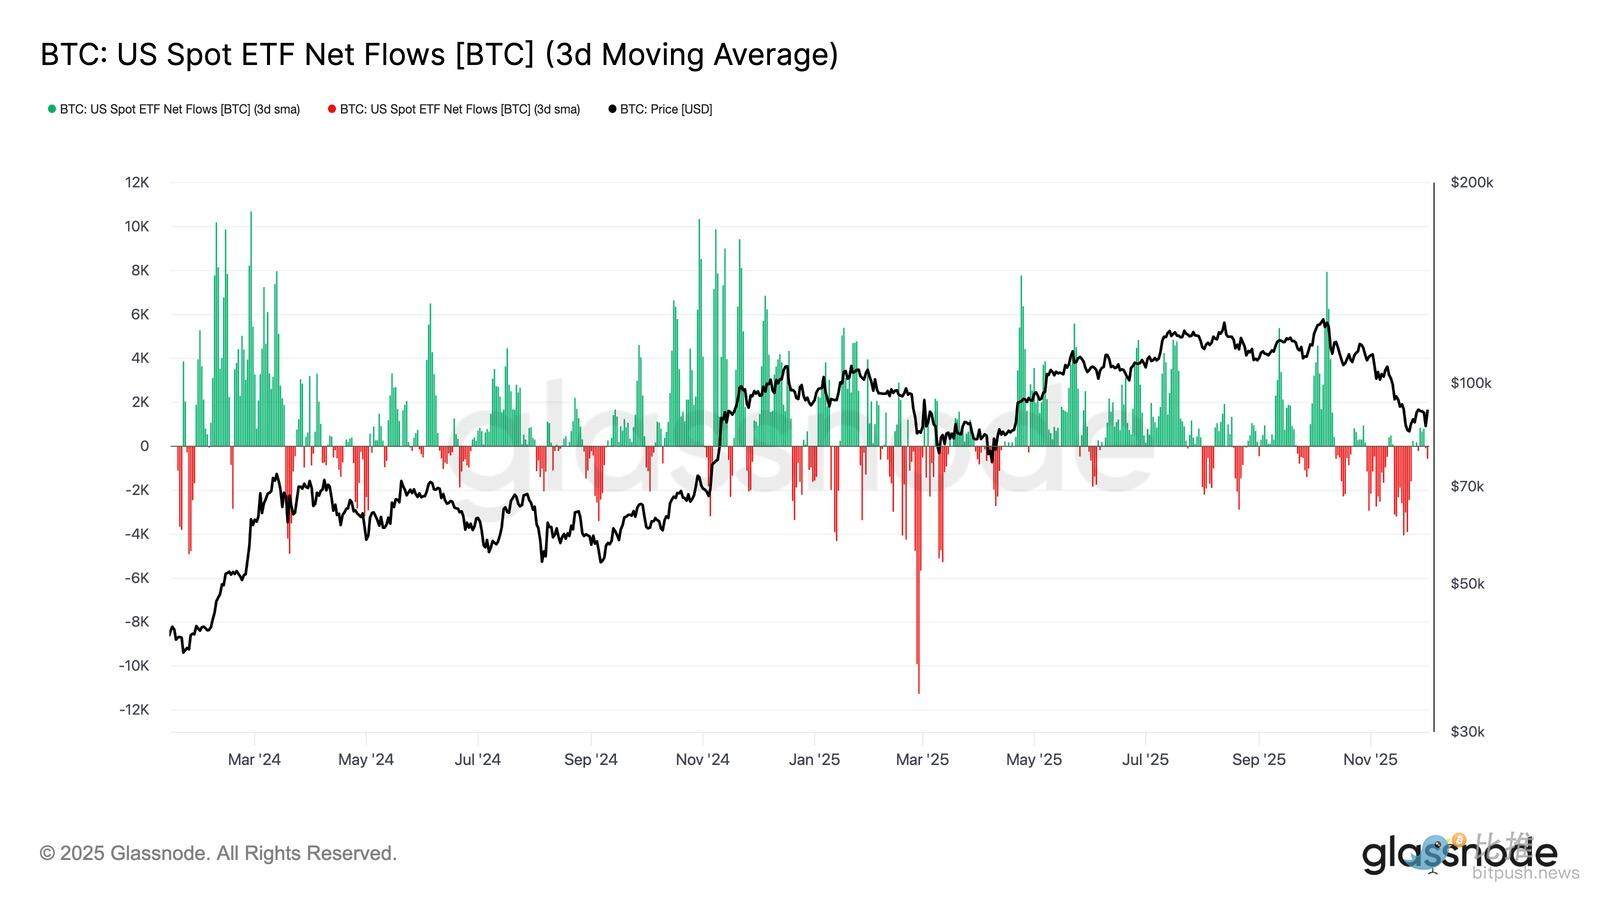
ETF Demand Weakens
Turning to the spot market, net inflows into U.S. Bitcoin ETFs have significantly deteriorated, with their 3-day average firmly sliding into negative territory throughout November. This marks a break from the sustained inflow that supported prices earlier this year, reflecting a cooling of new capital allocation.
The outflows are widespread across various issuers, indicating that institutional participants are taking a more cautious stance as market conditions weaken. The spot market currently faces a backdrop of weakening demand, which undermines immediate buyer support, making prices more sensitive to external shocks and macro-driven volatility.
Spot Buying Weakens
On the basis of deteriorating ETF demand, the cumulative volume delta (CVD) has also declined on major exchanges, with Binance and aggregated trading platforms showing a continued negative trend.
This indicates that sell pressure driven by market orders is steadily increasing, as traders cross the bid-ask spread to reduce risk rather than accumulate. Even Coinbase, typically seen as a barometer of U.S. buying strength, has leveled off, indicating a general retreat in confidence on the spot side.
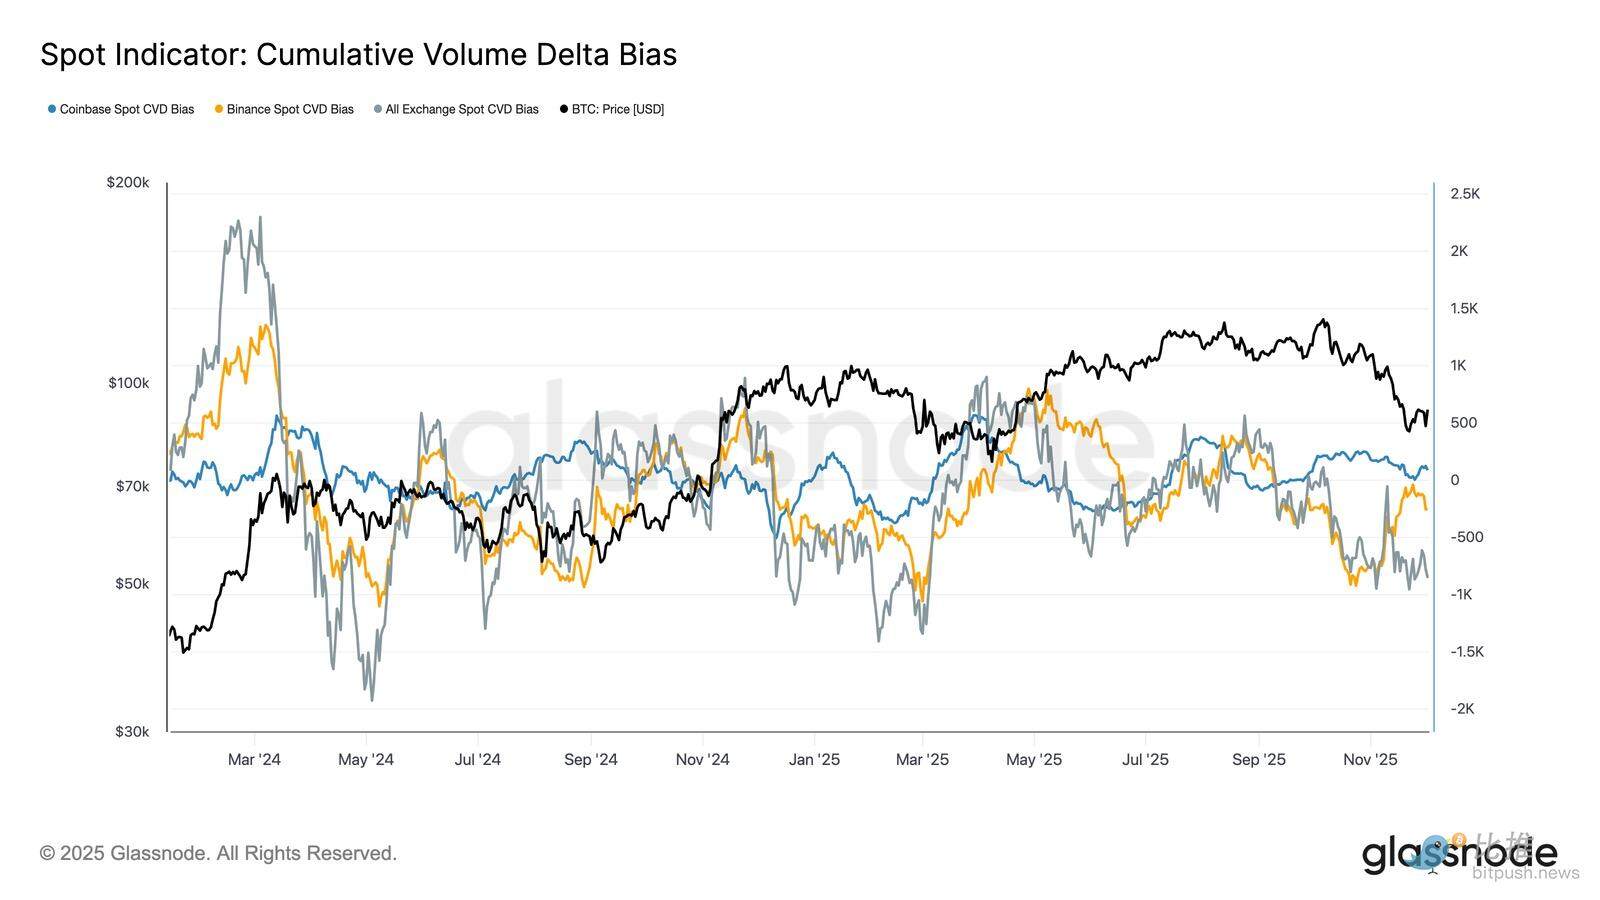
As ETF fund flows and spot CVD shift towards a defensive stance, the market now relies on a weaker demand base, making prices more susceptible to continued declines and macro-driven volatility.
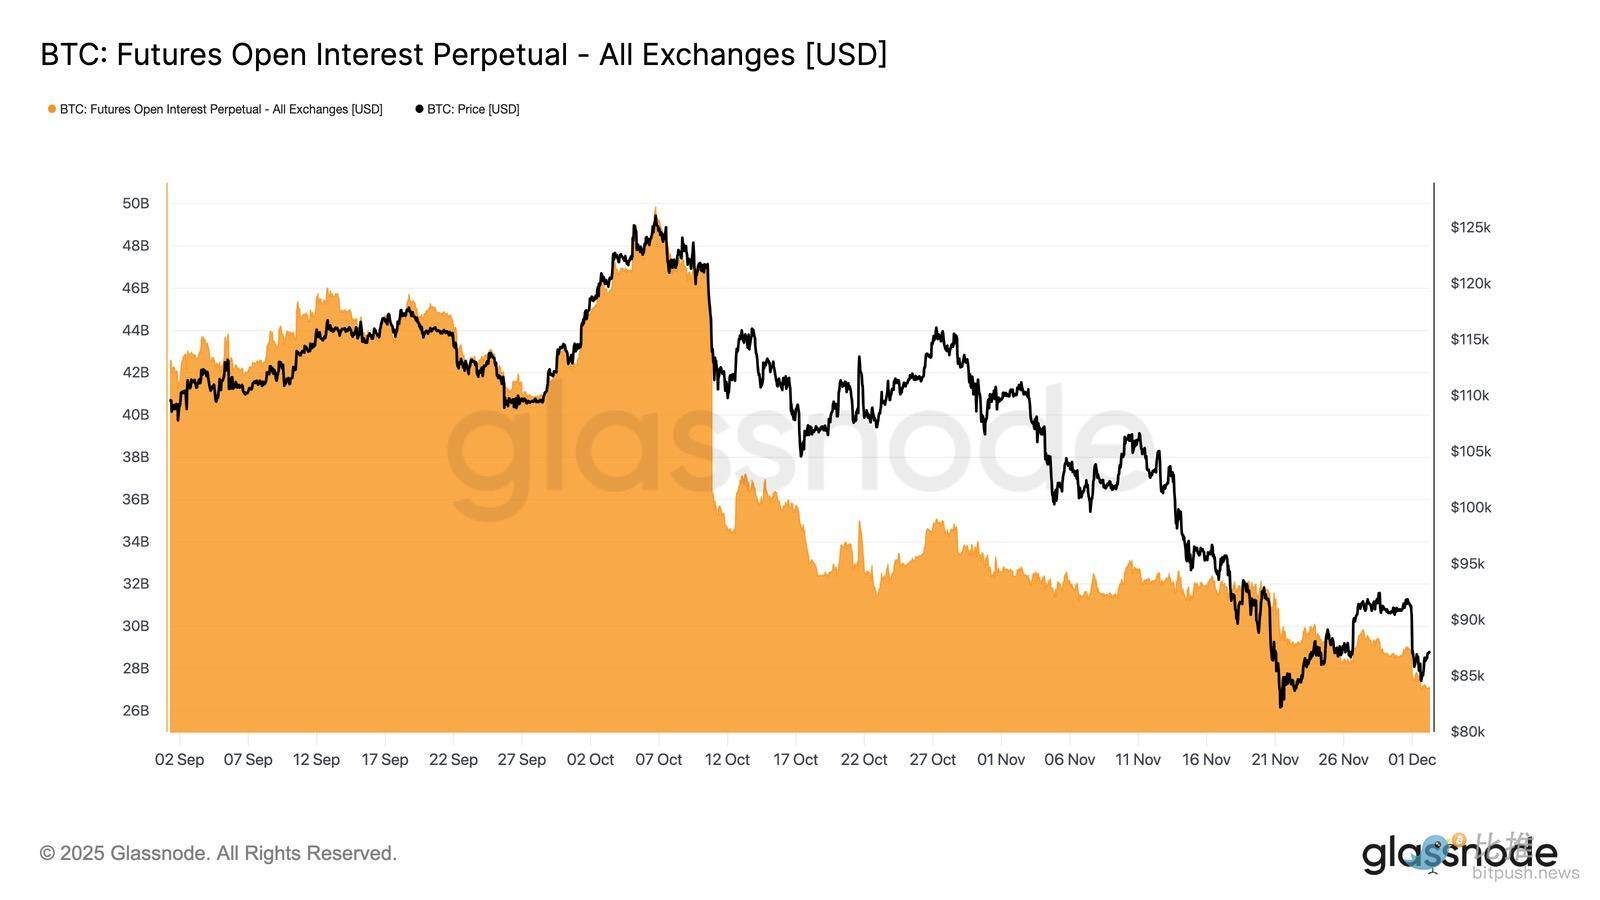
Open Interest Continues to Decline
Extending this weakening demand trend to the derivatives market, open interest in futures has steadily decreased since late November. Although the unwinding is smooth, it has been persistent, erasing most of the speculative positions accumulated during the previous upward trend. With no meaningful new leverage entering the market, traders seem unwilling to express directional beliefs, instead opting for a conservative, risk-averse stance as prices decline.
The derivatives complex is currently in a noticeably lighter leveraged state, indicating a clear lack of speculative intent and reducing the likelihood of extreme volatility driven by liquidations.
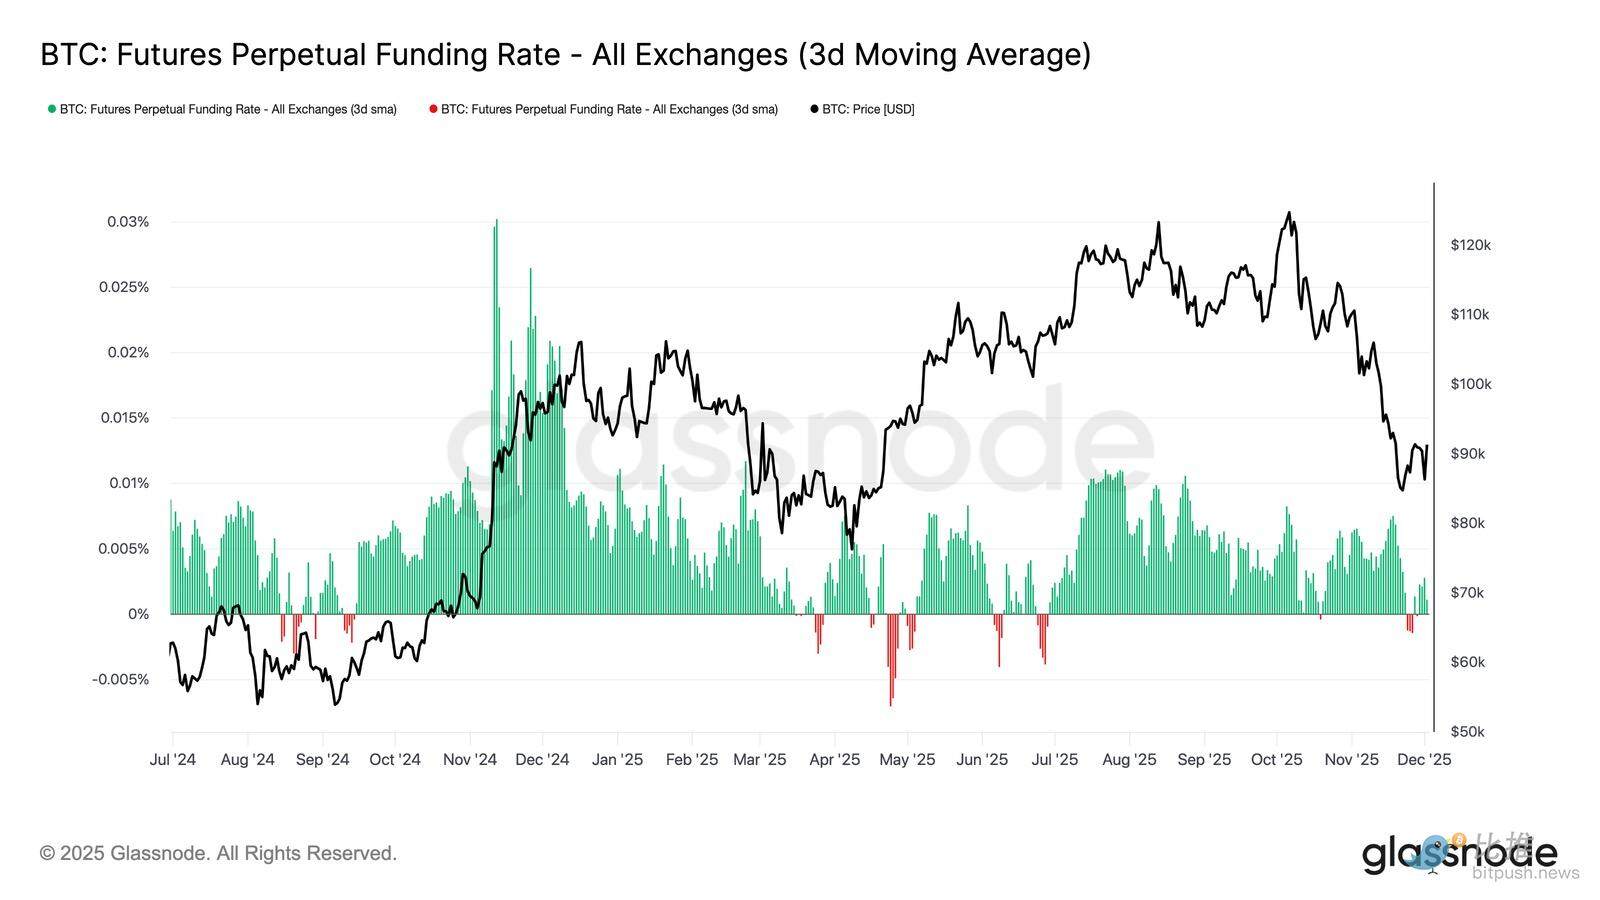
Neutral Funding Rate Marks Reset
As open interest continues to contract, perpetual funding rates have cooled to a roughly neutral area, oscillating around zero for most of late November. This marks a significant shift compared to the high positive funding rates observed during the previous expansion period, indicating that excessive long positions have largely been unwound. Importantly, the mild negative funding rate periods have been brief and fleeting, suggesting that despite the price decline, traders are not actively building short positions.
This neutral to slightly negative funding structure indicates a more balanced derivatives market, lacking crowded long positions, reducing downside vulnerability, and potentially laying the groundwork for a more constructive positioning when demand begins to stabilize.
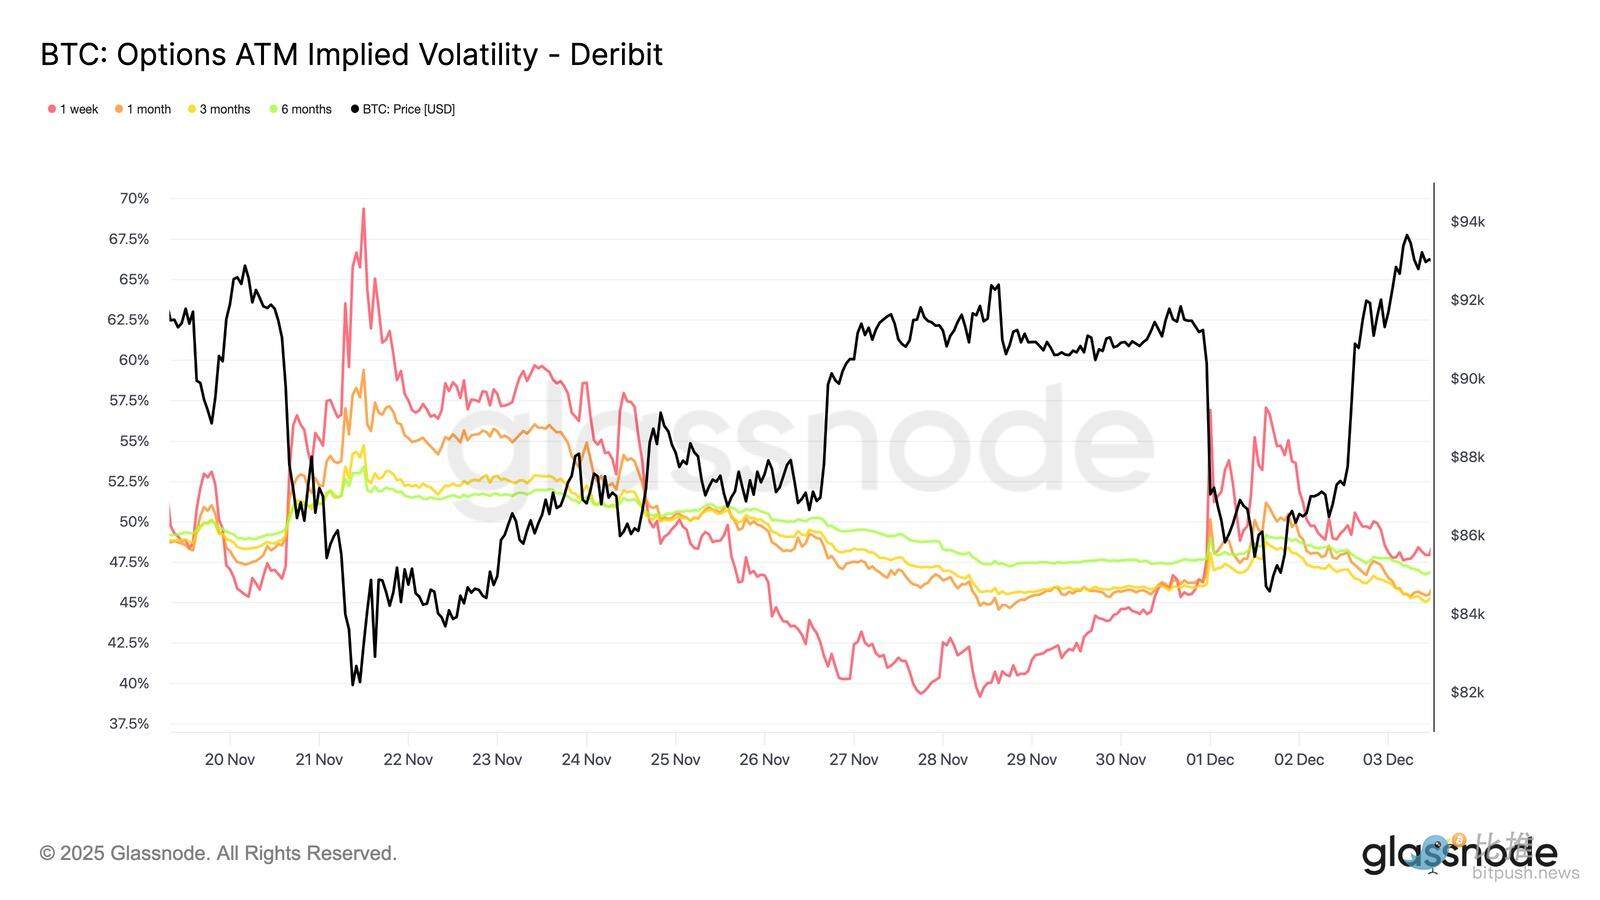
Implied Volatility (IV) Reset Across the Board
Turning to the options market, implied volatility (IV) provides a clear window into how traders are pricing future uncertainty. As a starting point, tracking implied volatility is useful as it reflects market expectations for future price movements. IV has reset lower after high readings last week. The difficulty in breaking through the resistance at $92K and the lack of follow-through momentum in the rebound prompted volatility sellers to re-enter, pushing implied volatility lower across the board:
- Short-term contracts fell from 57% to 48%
- Mid-term contracts fell from 52% to 45%
- Long-term contracts fell from 49% to 47%
This sustained decline indicates that traders believe the likelihood of a sharp downturn is decreasing and expect a calmer environment in the near term.
This reset also marks a shift towards a more neutral stance, as the market emerges from last week's heightened caution.
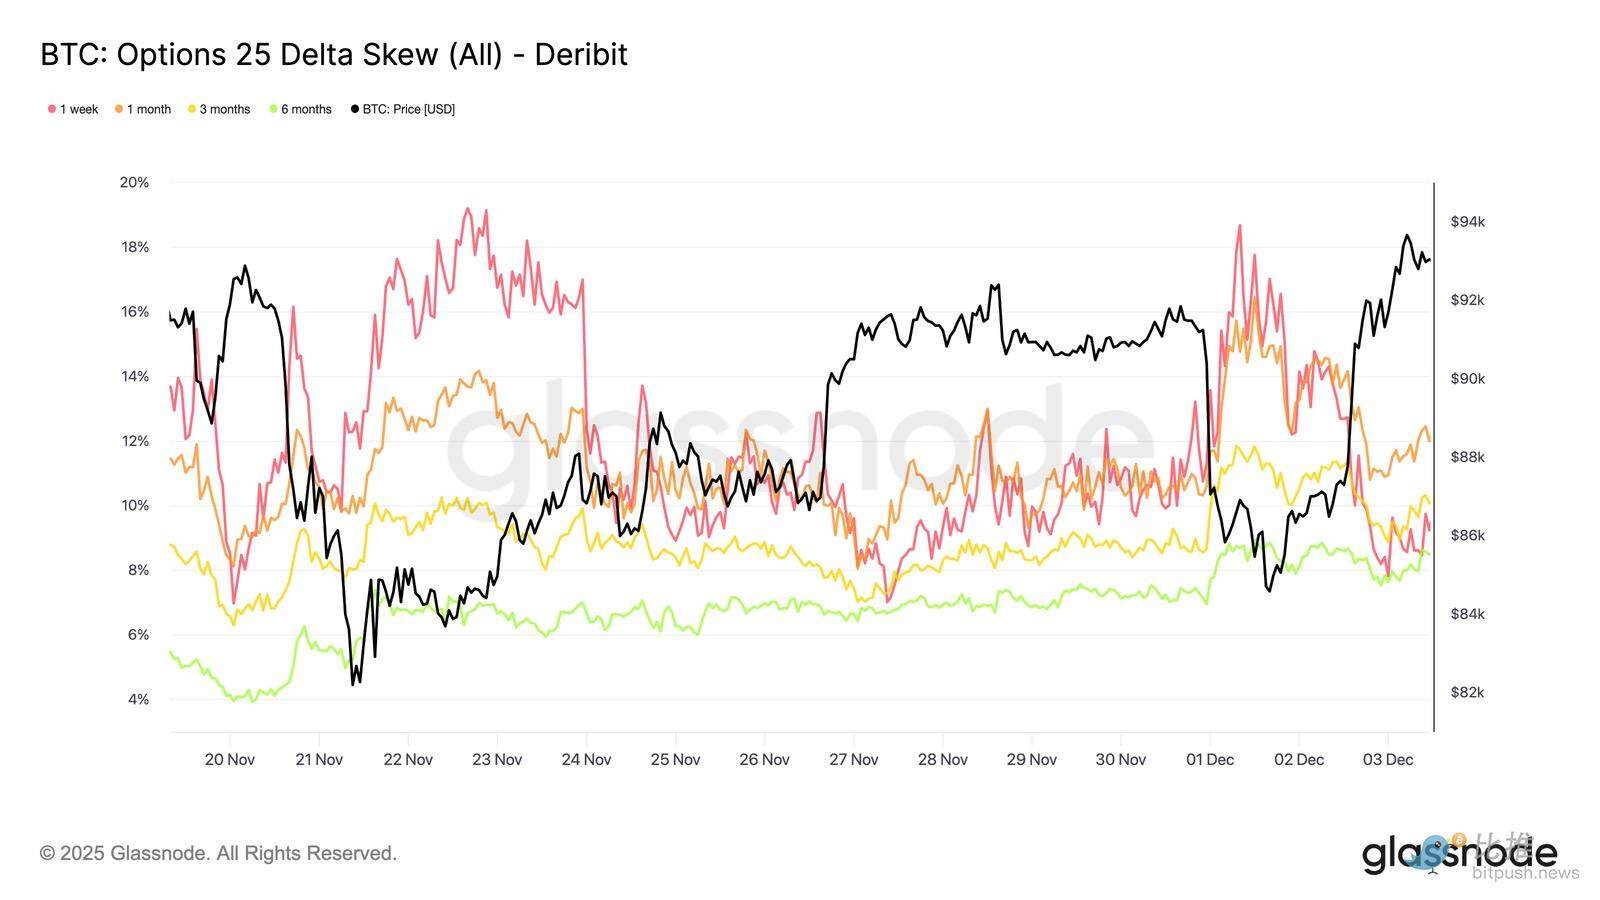
Softening Skew
After observing implied volatility, skew helps clarify how traders assess downside risk versus upside risk. It measures the difference in implied volatility between put options and call options.
When skew is positive, traders pay a premium for downside protection; when skew is negative, they pay more for upside exposure. The direction and level of skew are equally important.
For example, an 8% short-term skew that drops from 18% in two days rather than rising from a negative value conveys a distinctly different message.
The short-term skew moved from 18.6% during the drop to $84.5K driven by the Japanese bond narrative to 8.4% during the rebound.
This indicates that the initial reaction was exaggerated. Longer-term contracts adjust more slowly, suggesting that traders are willing to chase short-term upside but remain uncertain about its persistence.
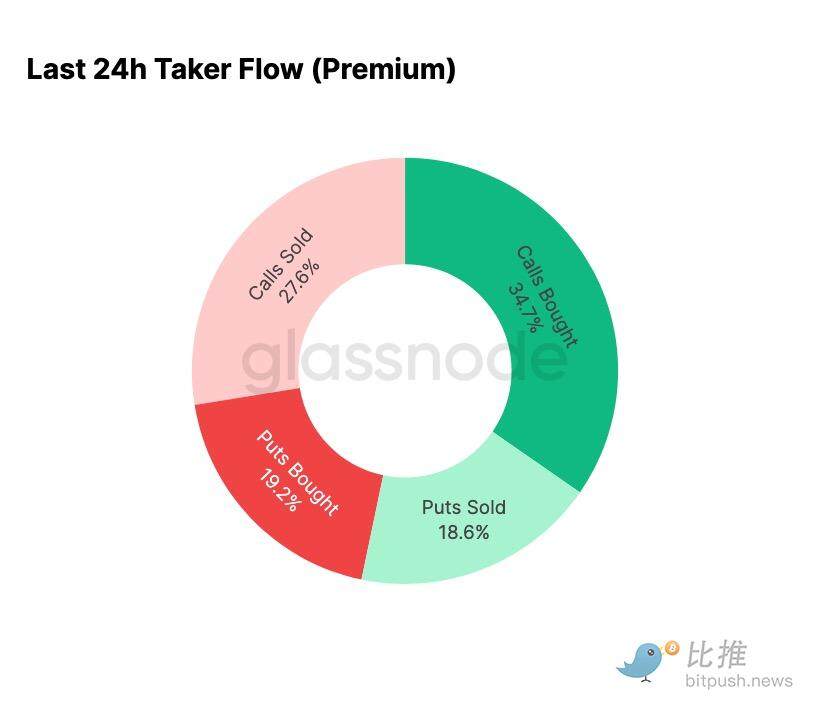
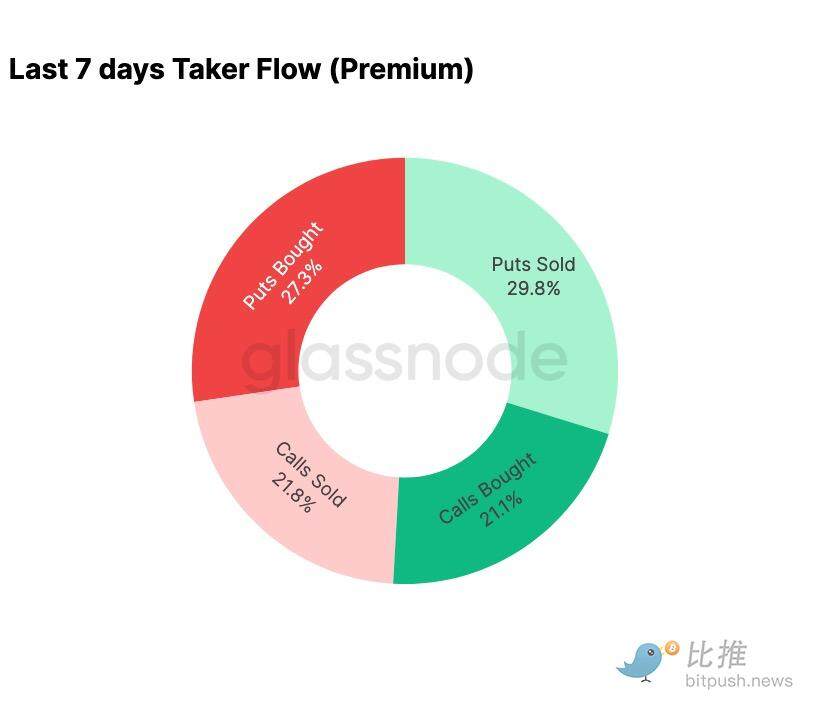
Fear Eases
Fund flow data shows a stark contrast between the past seven days and the subsequent rebound.
Earlier this week, activity was primarily dominated by bearish option buying, reflecting fears of a repeat of the price movements seen in August 2024, which were related to concerns over potential Japanese arbitrage trade unwinding. Given that this risk has been experienced before, the market has a sense of how far this spread could extend and the typical recovery that follows. Once prices stabilized, fund flows quickly shifted: the rebound brought a decisive tilt towards bullish option activity, almost perfectly reversing the pattern seen during the pressure period.
Notably, dealers still hold a net long gamma at current levels, which may persist until December 26 (the largest expiration date of the year). This position typically suppresses price volatility. Once that expiration date passes, positions will reset, and the market will enter 2026 with a new set of dynamics.
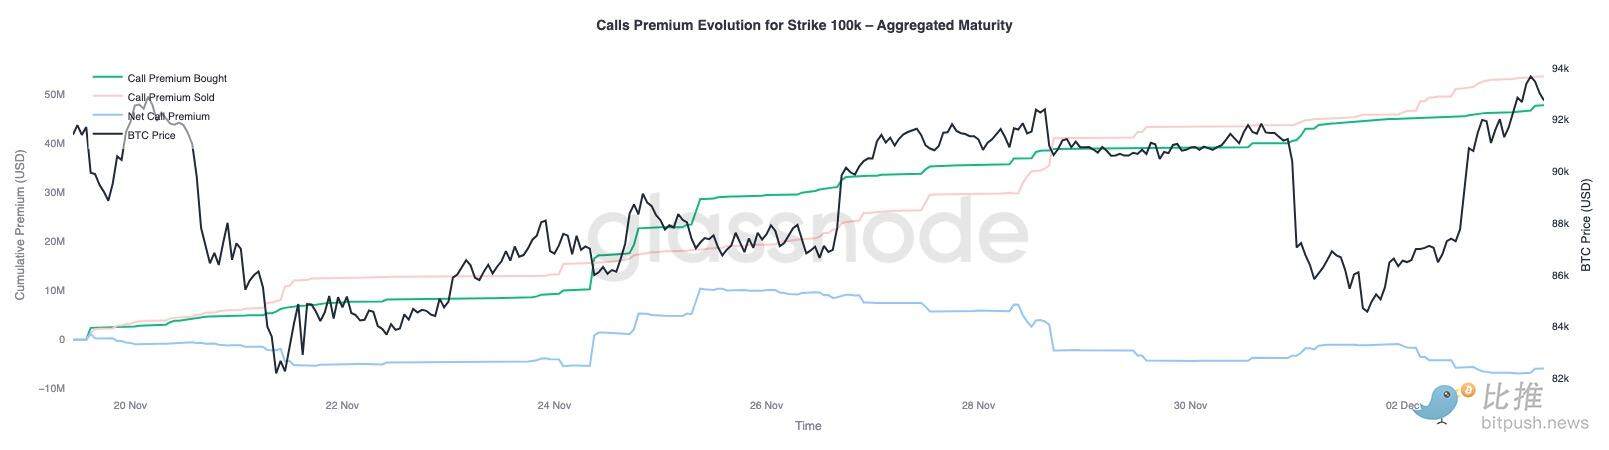
Evolution of $100K Call Option Premium
Focusing on the premium of call options with a strike price of $100K helps clarify how traders are treating this key psychological level. On the right side of the chart, the premium for selling call options remains higher than that for buying call options, and the gap between the two has widened during the rebound over the past 48 hours. This widening indicates that confidence in reclaiming $100K remains limited. This level is likely to attract resistance, especially in scenarios where implied volatility compresses during upward moves and rebuilds during downward moves. This pattern reinforces the mean-reverting behavior of implied volatility within the current range.
The premium profile also shows that traders have not established aggressive breakout positions ahead of the FOMC meeting. Instead, fund flows reflect a more cautious stance, with upside being sold rather than chased. Therefore, the recent recovery lacks the conviction typically required to challenge this important level of $100K.
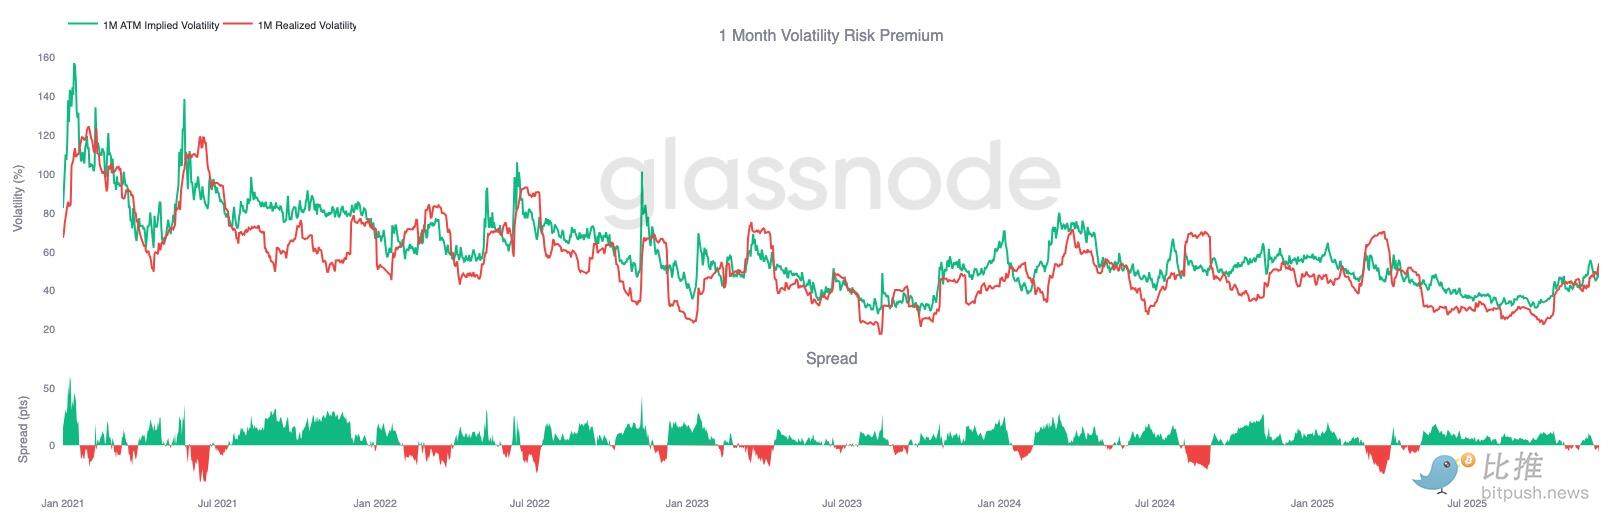
Volatility Underestimated
When we combine the reset of implied volatility with the severe bidirectional fluctuations this week, the result is a negative volatility risk premium. Volatility risk premiums are typically positive, as traders demand compensation for the risk of volatility spikes. Without this premium, traders shorting volatility cannot monetize the risks they are taking on.
At current levels, implied volatility is below realized volatility, meaning that the volatility priced into options is less than the volatility actually delivered by the market. This creates a favorable environment for long gamma positions, as each price swing can yield profits as long as actual volatility exceeds the expectations implied by the option prices.
Conclusion
Bitcoin continues to trade in a structurally fragile environment, with on-chain weakness and shrinking demand intertwining with a more cautious derivatives landscape. Prices have temporarily stabilized above the "True Market Mean," but the broader structure currently resembles that of Q1 2022: over 25% of the supply is underwater, realized losses are increasing, and sensitivity to macro shocks is heightened. Although far weaker than earlier this year, positive capital momentum remains one of the few constructive signals preventing a deeper market collapse.
Off-chain indicators reinforce this defensive tone. ETF fund flows have turned to net outflows, the spot CVD metric has declined, and open interest in futures continues to decrease in an orderly manner. Funding rates are close to neutral, reflecting neither bullish confidence nor active short-selling pressure. In the options market, implied volatility is compressing, skew is softening, capital flows are reversing, and options are currently priced low relative to realized volatility, conveying caution rather than a rekindled risk appetite.
Looking ahead, holding within the 0.75-0.85 quantile range ($96.1K-$106K) is crucial for stabilizing market structure and reducing downside vulnerability before the end of the year.
Conversely, the "True Market Mean" remains the most likely area for bottom formation unless negative macro catalysts disrupt the market's already delicate balance.
免责声明:本文章仅代表作者个人观点,不代表本平台的立场和观点。本文章仅供信息分享,不构成对任何人的任何投资建议。用户与作者之间的任何争议,与本平台无关。如网页中刊载的文章或图片涉及侵权,请提供相关的权利证明和身份证明发送邮件到support@aicoin.com,本平台相关工作人员将会进行核查。