Today, we will focus on three questions:
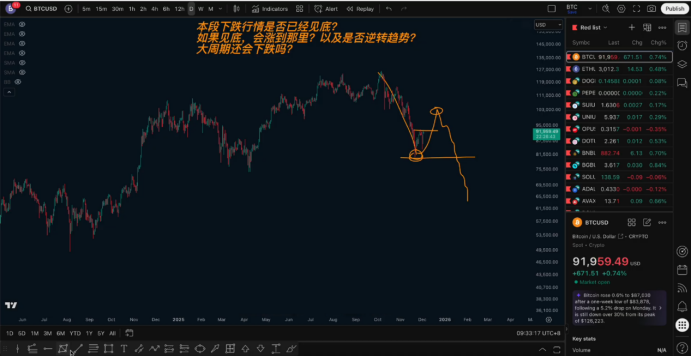
- Has the current decline reached the bottom?
- If it has reached the bottom, how far can the rebound go? Will it reverse the trend?
- Will the larger cycle continue to decline?
I. Has the current decline reached the bottom?
Let's first look at the 1-hour cycle.
After the previous bottom V-shaped reversal, we had already warned around 91,000 (last Friday, Saturday, and Sunday):
Such "bottom V reversals" usually find it difficult to directly reverse a bearish trend into a bullish trend.
In other words, these small-level rebounds are often just corrections within the trend, rather than signals of a trend reversal.
Therefore, after a V reversal, there is usually another dip or "second probe."
We also mentioned a couple of days ago:
This segment of the market is likely to have a new downward phase.
At that time, there were two expectations:
Expectation 1: Break the previous low (such as the 80,000 integer level) before rebounding.
This means:
First, break below the previous low point →
Then bounce up to replenish liquidity →
Then form a new adjustment and a new round of decline.

The logic of this type of movement is:
After the market declines too deeply, liquidity becomes insufficient, and a rebound is needed to replenish liquidity in order to continue to move into a new trend phase.
Currently, this expectation has not yet been realized.
Expectation 2: The second probe does not break, forming a "right-side elevated double bottom."
Last night, there was a surge in volume, pushing the price near the previous high resistance level.
This structure makes the second expectation more likely:
A right-side higher low appears,
Forming a potential double bottom.
If the neckline breaks → it would be a clear 1-hour reversal structure.
The neckline position is approximately at the 92,000 integer level.
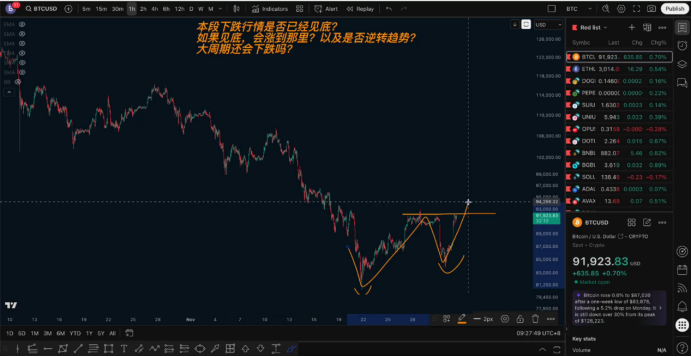
So, the key signal for whether we have reached the bottom is just one:
Break above 92,000 and create a higher high → only then can we consider it a true confirmation of the bottom at the 1-hour level.
The current situation is:
Bullish momentum is increasing,
Bearish momentum is weakening,
But the second confirmation has not yet been fully given.
We need to see a confirmed break above 92,000.
As long as the break is confirmed, the short-term will enter a "mainly low long after a pullback" rhythm.
II. If the bottom is confirmed, how far can the rebound go? Will it reverse the trend?
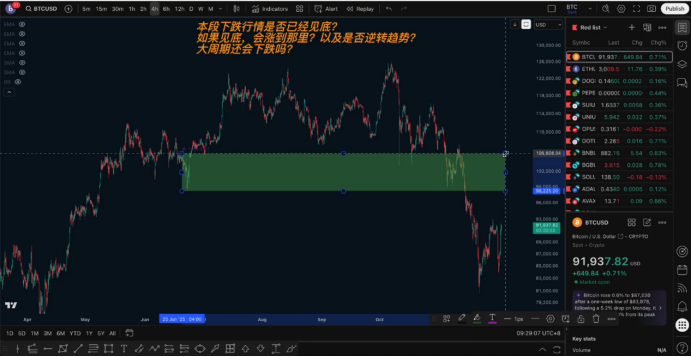
We previously mentioned that if a rebound occurs, a reasonable pressure range would be:
First pressure zone: 99,000–100,000
This is the last important phase low point at the 4-hour level, which is a clear resistance level.
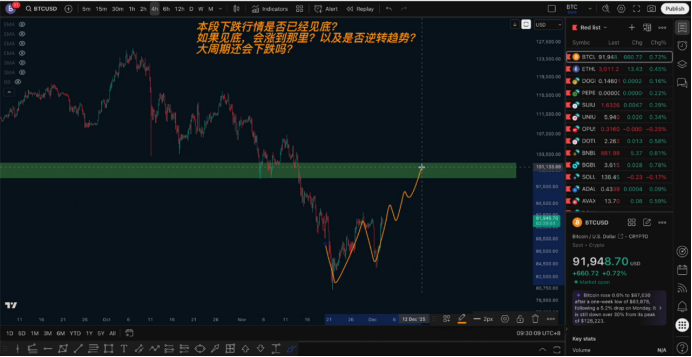
Additionally, there is a limit position for the rebound:
Rebound limit: 102,000–102,900
Why here?
Because a very key signal has appeared at the weekly level:
The 50-week moving average has been broken down,
Support has turned into resistance.
If the rebound tests back to the 50-week moving average, it would be a "breakout followed by a retest confirmation."
We believe this retest is the limit area for the rebound.
In other words:
This rebound could theoretically reach between 100,000 and 102,000, with a maximum potential touch at 102,900.
So, will it directly reverse into a large-scale bullish trend?
Currently, this possibility is low.
The reason is:
If the rebound exceeds 50% or even reaches the 0.618 position (103,000–108,700), it means the bulls have re-established a strong position.
That would mean the "break of the 50-week moving average" is a false signal.
Historically, the probability of such "false signals" is very low.
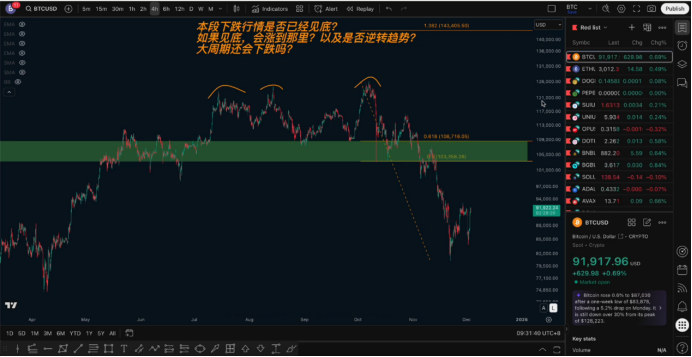
Therefore, we believe:
The stronger the rebound → the closer it is to high short opportunities, rather than a trend reversal.
III. Will the larger cycle continue to decline?
Currently, the larger cycle still shows no signs of a reversal structure:
Daily: Bearish
Weekly: Bearish
Multi-cycle: Bearish
Only the 1-hour and 4-hour cycles show potential for a rebound.
So, if a short-term rebound occurs, it is essentially just:
A "healthy rebound adjustment" within a larger downward cycle.
After the rebound ends, we still need to expect:
The daily may enter a second downward phase.
As mentioned yesterday, the daily is currently only in the "first downward phase."
Under normal circumstances, the daily trend requires at least:
Two complete downward phases
To potentially truly end this entire downward trend.
If the second downward phase on the daily occurs:
Assuming the rebound high point is around 100,000,
Then according to equal distance measurement:
The future potential target below may fall in the area just above 60,000.
IV. Ethereum (ETH)
The daily for Ethereum has reached a very critical support zone:
3,000–2,800 range.
This is:
A range that has previously formed multiple "bottoms"
And has also created strong support and strong resistance.
Multiple rebounds have occurred in this area.
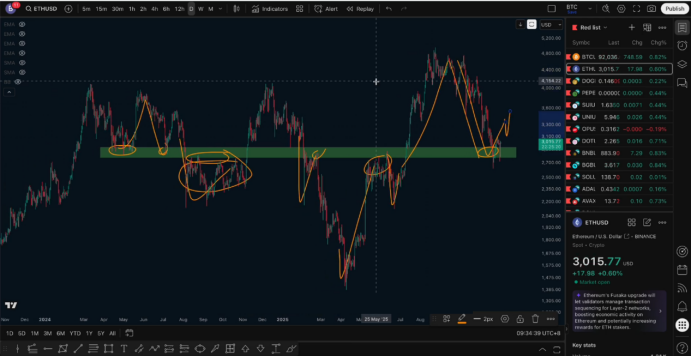
Now that ETH has returned here, it indicates:
There may be a short-term rebound adjustment on the daily.
If it can stabilize here and confirm the support is effective,
Then we can expect ETH to produce a daily rebound.
Note: This is a trend structure inference, not an exact prediction.
Follow me, join the community, and let's improve together. The article is published with a delay and is for reference only.

免责声明:本文章仅代表作者个人观点,不代表本平台的立场和观点。本文章仅供信息分享,不构成对任何人的任何投资建议。用户与作者之间的任何争议,与本平台无关。如网页中刊载的文章或图片涉及侵权,请提供相关的权利证明和身份证明发送邮件到support@aicoin.com,本平台相关工作人员将会进行核查。


