Odaily specially invited market analyst Conaldo, a master's degree holder in financial statistics from Columbia University in the United States, has focused on quantitative trading in U.S. stocks since college and has gradually expanded to digital assets such as Bitcoin. He has built a systematic quantitative trading model and risk control system through practical experience; he possesses keen data insights into market fluctuations and is committed to continuous in-depth research in the professional trading field, pursuing stable returns. He will delve into changes in BTC's technology, macroeconomics, and capital flow weekly, reviewing and demonstrating practical strategies, and forecasting significant events worth noting in the near future for reference. 
1. Bitcoin Market Review for Last Week (11.24~11.30)
1. Core Data Review from Last Week
- Opening Price: $86,808
- Lowest Price: $85,225 (Monday)
- Highest Price: $93,091 (Friday)
- Closing Price: $90,382
- Price Change: Weekly increase of 4.12%, maximum fluctuation of 9.23%
- Trading Volume: $10.591 billion
- Trend: Oversold rebound, weekly K-line closed with a medium bullish candle
2. Actual Market Trend Review from Last Week
Last week, Bitcoin exhibited an "oversold rebound" trend overall. The market showed that in the first four days, the price continued to rebound, experiencing a brief fluctuation upon reaching the first resistance level of $89,000, and then continued to rise. In the latter half of the week, influenced by holiday factors, market trading became light, and the trend shifted to a narrow range of fluctuations. The week ultimately closed with a 4.76% increase, finishing with a medium bullish candle.
3. Operational Review from Last Week
- Medium-term Strategy: Medium-term position at 65% (short position).
- Short-term Strategy: Executed trades based on the established short-term strategy last week.
2. Systematic Technical Analysis: Comprehensive Assessment Based on Multiple Models and Dimensions
Combining last week's market operations, the author will comprehensively apply multi-dimensional analysis models to conduct an in-depth analysis of the internal structure evolution of Bitcoin.
Bitcoin Weekly K-line Chart: (Momentum Quantitative Model + Sentiment Quantitative Model)
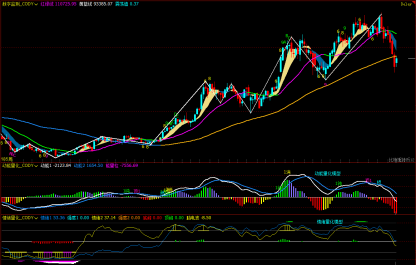
Figure 1
1. Analysis from the Weekly Chart (as shown in Figure 1)
- Momentum Quantitative Model: After last week's adjustment, the two momentum lines continue to run downward, with the white momentum line having crossed below the zero axis, and the negative energy bars continuing to expand, indicating that short-selling energy is gradually being released.
Model Indicates Bitcoin Price Decline Index: High
- Sentiment Quantitative Model: Both sentiment indicators are at an intensity of 0, with peak values at 0.
Model Indicates Bitcoin Price Pressure Index: Neutral
- Digital Monitoring Model: No digital signals are currently displayed.
The above data indicates that Bitcoin is in a downward trend, with bearish market signals appearing at the weekly level.
Bitcoin Daily K-line Chart:
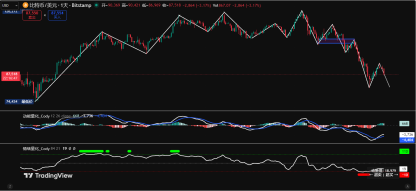
Figure 2
Bitcoin 4-Hour K-line Chart:
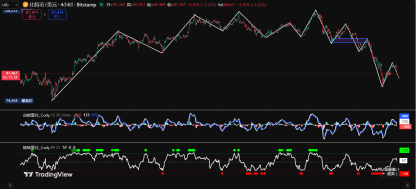
Figure 3
2. Analysis from the Daily Chart (as shown in Figure 2)
- Momentum Quantitative Model: After the market closed last Thursday, the two momentum lines formed a "golden cross" below the zero axis and began to move upward, gradually approaching the zero axis, with energy bars changing from negative to positive.
Model Indicates: Bullish Momentum is Being Released
- Sentiment Quantitative Model: The daily sentiment indicator previously dipped to the bottom area, simultaneously issuing a bottom (red) signal, which triggered last week's technical oversold rebound.
Model Indicates: The Nature of the Rebound is an Oversold Rebound
The above data suggests that the daily level is in a bearish market, and the current rise is a technical rebound after an oversold condition.
3. Market Forecast for This Week (12.01~12.07)
- It is expected that Bitcoin will test the support strength around $89,000 this week.
- If this level of support holds, the price will have further upward rebound momentum and challenge last week's high;
- If this level is effectively broken, the price will begin a downward trend seeking support;
Resistance Levels: The first resistance is seen in the $94,000~$96,500 range, and the second resistance is in the $98,500~$100,000 range.
Support Levels: The first support is around $89,000, the second support is in the $85,500~$88,000 range, and the important support is around $80,500.
4. Operational Strategy for This Week (12.01~12.07): Excluding Sudden News Impact
Medium-term Strategy: Maintain a medium-term position of about 65% (short position).
Short-term Strategy: Use 30% of the position, set stop-loss points, and look for short-selling opportunities based on resistance signals. (Using 60 minutes/240 minutes as the operating cycle).
The core basis for short-term operations is the effectiveness of the support around $89,000.
- First Short-term Trading Plan: If this support level holds, the price will continue to rebound
- Initial Entry: If the price rebounds to the $94,000~$96,500 range and encounters resistance signals, a 10% short position can be established, with a stop-loss set above $100,000.
- Second Position Increase: If the price continues to rebound to around $98,500 and encounters resistance again, an additional 20% short position can be added, with a stop-loss set above $100,000.
- Initial Position Reduction: When the price rebound ends and begins to decline, if the held short position shows resistance signals near the first support level, half of the position can be closed.
- Full Position Closure: If the price continues to drop to the second support level and shows resistance signals, clear out the remaining short position to realize profits.
- Second Short-term Trading Plan: If this support level is effectively broken, the price will begin a downward trend
- Initial Entry: If the $89,000 support is effectively broken, a 20% short position can be established, with a stop-loss set near $92,000.
- Position Closure Point: During the price's downward trend, especially if it drops to the $80,500~$82,000 range and shows bottom resistance signals, clear all short positions to realize profits.
5. Special Reminders
When opening a position: Immediately set the initial stop-loss level.
When profits reach 1%: Move the stop-loss to the opening cost price (break-even point) to ensure capital safety.
When profits reach 2%: Move the stop-loss to the 1% profit position.
Continuous Tracking: After this, for every additional 1% profit, the stop-loss will move 1% accordingly, dynamically protecting and locking in existing profits.
(Note: The above 1% profit trigger threshold can be flexibly adjusted by investors based on their own risk preferences and the volatility of the asset.)
6. Macroeconomic and Capital Flow Analysis
Last week, influenced by Thanksgiving and "Black Friday" holidays, the U.S. financial market was overall in a low liquidity environment. During the holidays, trading activity decreased, market sentiment remained stable, and there were no significant fluctuations in risk aversion or risk appetite, so BTC's short-term trend was not substantially disturbed. However, from the perspective of capital structure and institutional behavior, noteworthy changes are emerging within the market, which are significant for assessing BTC's mid-to-short-term structure.
1. Macroeconomic Capital Structure Analysis from Last Week (11.24~11.30)
Risk Appetite Shows Phase Switching
①. Retail Investor Capital Inflow Weakens
- According to the latest BofA data, in the third week of November, retail investors continued their buying trend, but the net inflow scale significantly narrowed, while the outflow proportion increased, showing an overall state of "buying while reducing positions." Retail investors have been the main driving force behind risk assets over the past two years, and this weakening may be related to year-end capital needs and the holiday consumption season.
- Impact on BTC:
The decline in retail participation reduces short-term trading activity, which is conducive to volatility convergence and reduces emotional selling behavior. This has a positive impact on Bitcoin's stability within the fluctuation range.
②. Hedge Funds Increase Positions in Reverse
- Hedge funds that had maintained short positions previously showed a significant directional reversal in the third week of November, with net buying close to $2 billion. At the same time, CTAs began to gradually establish new long positions after previous sell-offs, achieving positive inflows for four consecutive weeks.
- Impact on BTC:
The buying behavior of hedge funds and CTAs typically represents an expectation of improvement in the market environment over the next 1-3 months. Institutions increasing positions during price declines indicate that mid-term risk assets (including tech stocks and BTC) have certain valuation attractiveness.
③. Institutional Investors Reflow
- Traditional institutional capital, after four consecutive weeks of net outflows, returned to a net buying state in the third week of November. The warming of institutional risk appetite is crucial for the stability of long-term trend assets.
- Impact on BTC:
BTC's correlation with tech stocks remains high. The stabilization of the tech sector combined with institutional reflows reduces the marginal macro pressure on BTC, helping to support the rebound structure.
2. Summary
Overall, retail outflows, with institutions and hedge funds taking over, represent a typical "strong hands replacing weak hands" structure in a fluctuation range. This is also the main reason why BTC can maintain stable operation during the low liquidity holiday.
7. Macroeconomic Outlook for This Week (12.01~12.07): Core Focus on Inflation Path and Officials' Speeches
Although this week is not a heavy data period, several macro events may still impact the short-term market trend, serving as key variables for observing BTC's volatility space.
- The speech by Federal Reserve Chairman Powell on Tuesday will be the most influential event on the market. Currently, market expectations for a rate cut in December have risen to over 80%. Against this backdrop, Powell's statements will directly affect market sentiment and asset trends:
- If he releases dovish signals, it will help boost market risk appetite, thereby providing further rebound momentum for Bitcoin.
- If he emphasizes inflation stickiness or maintains a hawkish stance, it may lead to a retreat in rate cut expectations, and risk assets may face resistance near key pressure levels.
- The performance of employment data (ADP and initial claims) will directly influence market sentiment by affecting rate cut expectations.
- If it continues to slow down, it will strengthen the logic of declining inflation, supporting rate cut expectations, which would be beneficial for risk assets including BTC.
- If it unexpectedly strengthens, it may raise concerns about a "delay in the timing of rate cuts," putting upward pressure on high-valuation assets.
- As the core basis for the Federal Reserve's policy formulation, the core PCE data to be released on Friday will be key in determining the direction of December's rate expectations.
- In line with or below expectations: Reinforces rate cut expectations, serving as a catalyst for the rebound of tech stocks and BTC.
- Significantly above expectations: Triggers concerns about monetary policy tightening, leading to profit-taking in BTC at this position.
All views, analytical models, and operational strategies mentioned in this article are derived from personal technical analysis and are for personal trading logs only, not constituting any investment advice or operational basis. The market carries risks, and investment should be cautious; DYOR.
免责声明:本文章仅代表作者个人观点,不代表本平台的立场和观点。本文章仅供信息分享,不构成对任何人的任何投资建议。用户与作者之间的任何争议,与本平台无关。如网页中刊载的文章或图片涉及侵权,请提供相关的权利证明和身份证明发送邮件到support@aicoin.com,本平台相关工作人员将会进行核查。


