
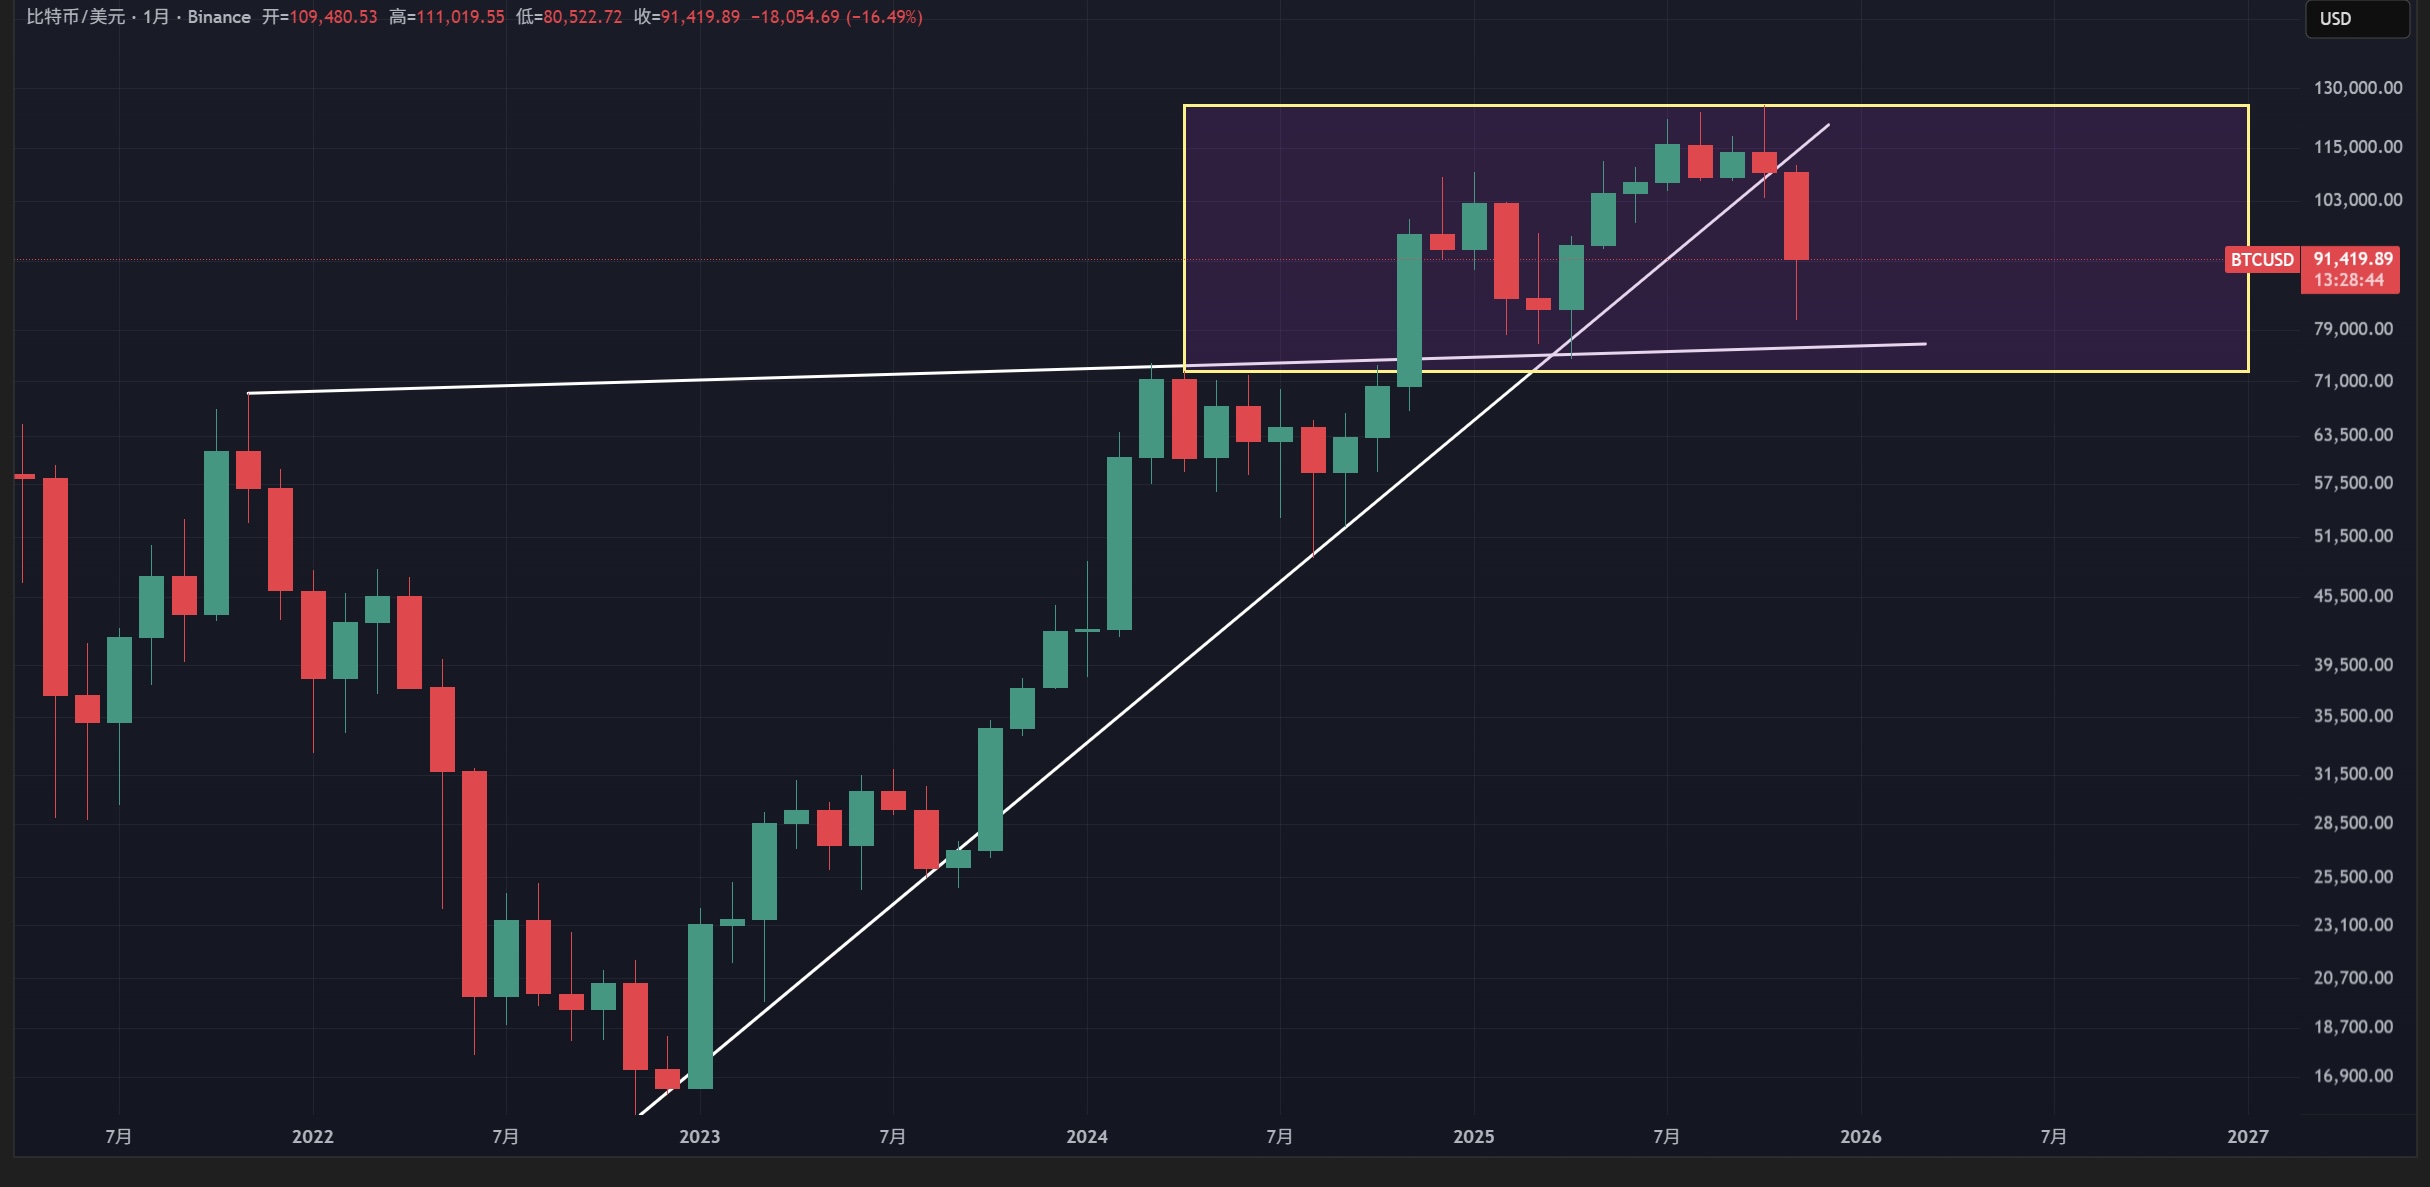
The Bitcoin monthly line is about to close, and it will basically maintain the status quo, forming a large bearish candle with a long lower shadow. This is the second time this year after the large bearish candle formed in early February. Currently, the market is still in the support range (74500-80000) after the surge in February. If this range is broken in the future, it will be very dangerous; however, if a consolidation pattern can be built above it, it cannot be ruled out as a continuation pattern in a bull market. Currently, Bitcoin is in a chaotic state, and it is difficult to clearly determine whether it is a bull or bear market; we can only take it step by step. From the weekly perspective, there has been a rebound this week, but it has not broken through the recent resistance level of 93700. The short-term upward trend line has not been broken; if it is broken, a second bottom may occur, or it may drop to the 74500 to 80000 range to seek support before rebounding.
Ethereum's weekly line has dropped to the Fibonacci 0.618 position, and this week's rebound has not managed to recover above 3054, with the rebound strength still relatively weak. Since the weekly MACD crossed below the zero line, we have continuously reminded to view it with a bearish outlook.
BTC:
After a minimum drop to 80600, it rebounded to 93080, with a rebound of about 15%. Currently, 93800 remains the primary resistance level, which has not been effectively broken. Next, pay attention to the four-hour upward trend line; if it breaks, it may continue to decline, but if it holds, we can still look for a rebound.
From the weekly and monthly structure, it is currently forming an M head pattern, with the neck support at 74500. The recent low of 80600 is also testing this support area. Therefore, even if there is another short-term drop, there should be some support in the 74500-80600 range. Building a bottom will take at least several months to complete.
Support: 74500—80600
Resistance: 93800—101516
ETH:
The Ethereum monthly MACD has shown a top divergence structure, and we have already indicated a bearish turn when the weekly MACD crossed below the zero line. After three consecutive weekly bearish candles, the lowest point reached 2623, and the previous support at 2800 has been broken, but there is currently a lower shadow, so we need to pay attention to the support effect around 2623.
The daily level rebound has not managed to recover 3060, and the overall rebound strength remains weak. There are about 10 days until the Federal Reserve's interest rate cut decision, and there are still more than two months until the Spring Festival. Looking back at the past few years, the market often experiences a "Spring Festival market" before and after the Spring Festival, so we can patiently wait to see if it will reappear this year.
Support: 2623—2800
Resistance: 3060—3435

If you like my views, please like, comment, and share, and let's navigate through the bull and bear markets together!!!
The article is time-sensitive and for reference only, updated in real-time.
Focusing on K-line technical research, sharing global investment opportunities. Public account: BTC Trading Prince Fusu

免责声明:本文章仅代表作者个人观点,不代表本平台的立场和观点。本文章仅供信息分享,不构成对任何人的任何投资建议。用户与作者之间的任何争议,与本平台无关。如网页中刊载的文章或图片涉及侵权,请提供相关的权利证明和身份证明发送邮件到support@aicoin.com,本平台相关工作人员将会进行核查。


