Today is Thursday, November 27th. Let's take a look at today's market to see if there are opportunities to make a profit.
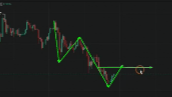
First, we will look at the daily chart of Bitcoin. From the direction of the daily chart closing, it is clear that the main focus is still on buying low, primarily bullish. The target above remains unchanged at 93,100. The target levels on the daily chart have been discussed with partners before. In this entire wave of market movement, the first wave of decline is followed by the second wave of decline, and it is evident that there will be a rebound similar to the previous one.
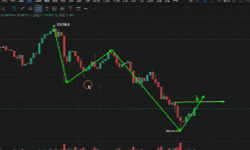
So, our expected positions are the first at 93,100 and the second at 96,000, which is the area of 96,000-96,600. Therefore, the target for this wave of market movement should be these two daily chart target levels, focusing first on 93,100 and 96,000.

First, we set the tone for the smaller cycles, which naturally leads to a pullback for buying. In the smaller cycles, there are already signs of stagnation. The one-hour and 30-minute charts have clearly shown stagnation at this position, indicating a pullback. If it does not pull back here and reaches the upper level of 92,500-93,100, this remains a shorting point. Currently, the pullback at 88,600-87,900 is a buying point, while the upper level is a shorting point. So, if it comes down, we buy; if it goes up, we short.
Assuming we short from this position, if it pulls back a bit and breaks through, once this position is confirmed to break through 93,100, the target above we need to see is the line of 96,000-96,600. This target level should be considered for further action. So the overall pattern is now very clear; Bitcoin can still rise overall, with a strategy of buying low and shorting at high points before buying again at high points.
So at the current position, a stagnation pattern has already appeared. There is still a chance to come down. This is Bitcoin, and the position for Bitcoin is the same. For the past two days, the long-awaited target has finally arrived.
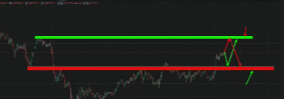
3,050 and 3,100 are both very good shorting points. At these positions, we are now looking to short. 3,160, 3,220, and 3,250 are also very good shorting points, all of which can be used for shorting.
How should we proceed from here? The 30-minute chart clearly shows a need for a pullback. The first position we need to pay attention to is 2,952. A pullback to this position is clearly a buying point. There is also another position at 2,952-2,910, both of which are good buying points.
Just set a stop loss below here, and we can still buy because it will align with the rhythm of Bitcoin. The main focus is still on the daily chart data. The target has not yet been reached. If we calculate based on the entire wave of decline, the structure of the daily chart shows the first wave of decline and the second wave of rebound. The fourth wave is clearly not yet in place, and the target for the fourth wave should be around 3,250.
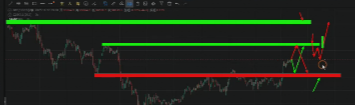
If this position can break through, we are heading for 3,660. So the entire structure is like this; currently, the main focus is still on the low buying strategy. When we reach the key positions for buying and selling, we can also short. It’s not about determining one direction; we can short at high points as well. As long as this position breaks through 2,990, after breaking 2,990, there will be support below and resistance above. So, with resistance above and support below, this area is clearly what we refer to as the zone where both buying and selling are uncertain.
So, both buying and selling at this position are not a big issue. The current pattern still primarily focuses on buying low, and when we reach the key position above, we should still short.
For more strategies, follow the public account BTC-ETH Crypto.

免责声明:本文章仅代表作者个人观点,不代表本平台的立场和观点。本文章仅供信息分享,不构成对任何人的任何投资建议。用户与作者之间的任何争议,与本平台无关。如网页中刊载的文章或图片涉及侵权,请提供相关的权利证明和身份证明发送邮件到support@aicoin.com,本平台相关工作人员将会进行核查。


