1. Ethereum: The rebound has not peaked yet, but it is not a reversal
Currently, Ethereum is still in the bottom rebound phase, and there are no signs of a peak, so there is a possibility of continued oscillation upwards.
From a structural perspective, this rebound belongs to a channel-style flag adjustment.
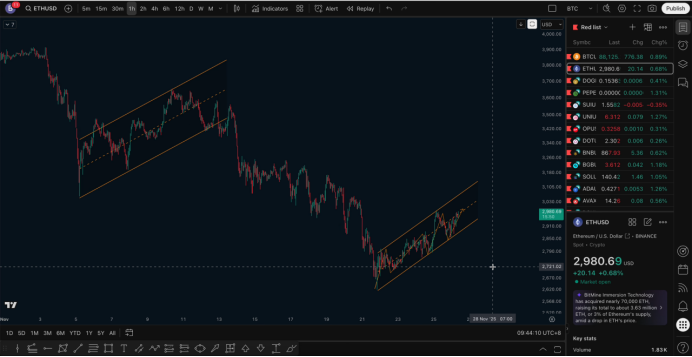
This is because the current upward wave has not broken below the lower edge of the channel, nor has a top pattern appeared.
In previous rebound structures, the top signals were very clear, for example:
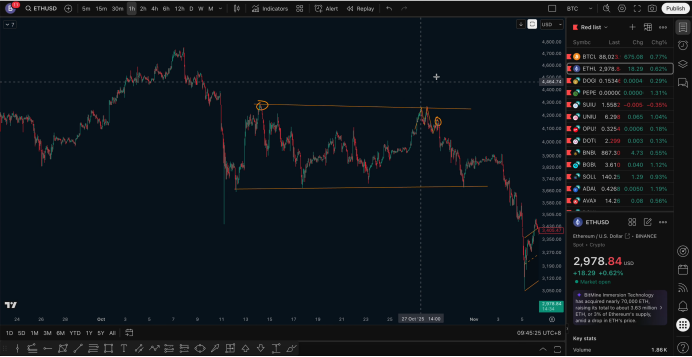
A double top formed, with the right-side high point lowering;
The neckline was effectively broken;
A retest of the trend line faced pressure;
Subsequently, the channel formed a downward break.
These are all typical short entry points.
However, in this round of rebound:
It is still within the upward channel;
There is no double top, no neckline break, and no trend line break.
Therefore, there is no need to predict where the rebound high point is, nor is it advisable to try to hit the top. Shorting must wait for the top structure or channel to truly break down.
Why can't it be seen as a reversal?
Because to form a 1-hour level reversal, the following must be met:
Rebound ends → a period of pullback;
Pullback raises the low points;
Re-breakthrough of the previous high point;
Form a new bullish structure.
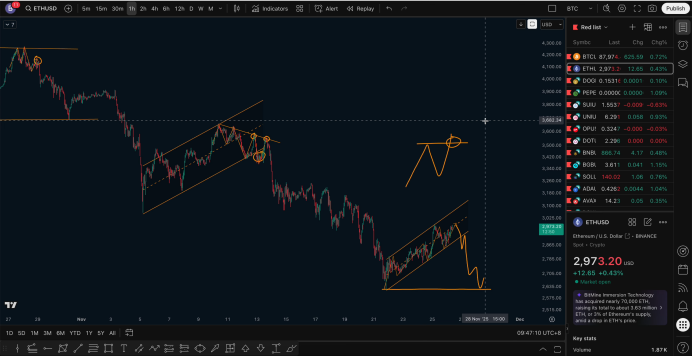
But currently, none of these steps have been achieved.
Therefore, whether on the 1-hour, 4-hour, daily, or weekly charts, the multi-timeframe structure remains bearish; it is just a rebound within a bearish trend.
So the conclusion is simple:
Ethereum is still in a rebound; do not chase highs or try to hit the top, wait for the top structure to appear before considering shorting.
Bitcoin: Weak horizontal rise, beware of a sharp drop in the future
The structure of Bitcoin is similar to that of Ethereum, but slightly weaker. This week, the overall rebound is more of a "horizontal rise" rather than a strong upward attack.
Horizontal rises usually have a characteristic:
They are prone to a sharp drop in the future.
The reason is:
Strong intervention by the main force will show significant volume and rapid increases;
However, the current trend is characterized by "slow rise + small real body candlesticks," not a strong attack;
Horizontal rises seem more like building momentum for a drop rather than constructing a reversal.
From the daily chart, recent bullish candles are more of a repair of the previous rapid decline, not a trend reversal.
1-hour structure situation
Currently, there is still no top structure on the 1-hour chart:
High points continue to be refreshed;
Last night's drop did not break below the previous low;
Overall, it remains a slow upward structure.
But a key point needs attention:
80,900 is a significant integer resistance level.
Why is this line critical?
Because it overlaps with the phase low and the current rebound high point, and many past wave rebounds have ended just after hitting the previous low point.
If 80,900 encounters resistance and a structure forms, such as:
A double top;
Neckline break;
Or channel breakdown;
Then it may form a right-side short entry signal.
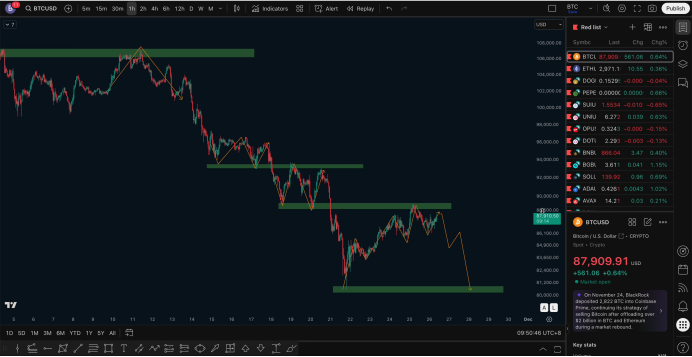
The short-term target for shorts still looks at the previous low point area, with a focus on:
Whether the integer level of 80,000 will be broken below.
Follow me, join the community, and progress together. The article is published with a delay and is for reference only.

免责声明:本文章仅代表作者个人观点,不代表本平台的立场和观点。本文章仅供信息分享,不构成对任何人的任何投资建议。用户与作者之间的任何争议,与本平台无关。如网页中刊载的文章或图片涉及侵权,请提供相关的权利证明和身份证明发送邮件到support@aicoin.com,本平台相关工作人员将会进行核查。


