As a senior figure in the cryptocurrency space, I have been deeply involved in this captivating and challenging industry for many years. Having experienced the ups and downs of the crypto market and witnessed the rise and fall of countless cryptocurrencies, I have accumulated rich practical experience and unique market insights. Investing is a long-term practice, and this is especially true in the cryptocurrency space. Continuous learning and improving one's cognitive and judgment abilities are essential to navigate this challenging field steadily.
In terms of Bitcoin's daily candlestick chart, the market reached a high of 88,500 and a low of 86,000. The EMA trend indicator previously showed a downward alternating expansion trend, with a strong bearish trend continuing until the end of the trading session. The EMA15 trend fast line has dropped below the 92,000 mark to 91,800 and is still maintaining a downward rhythm. The MACD indicator shows a shrinking volume, with the lower Bollinger Band support diverging to 80,000, and the middle band pressure level to watch is 94,300. The current price is in the central consolidation area, and the main force has not yet clarified the upward direction, so the short-term operational thinking remains unchanged.
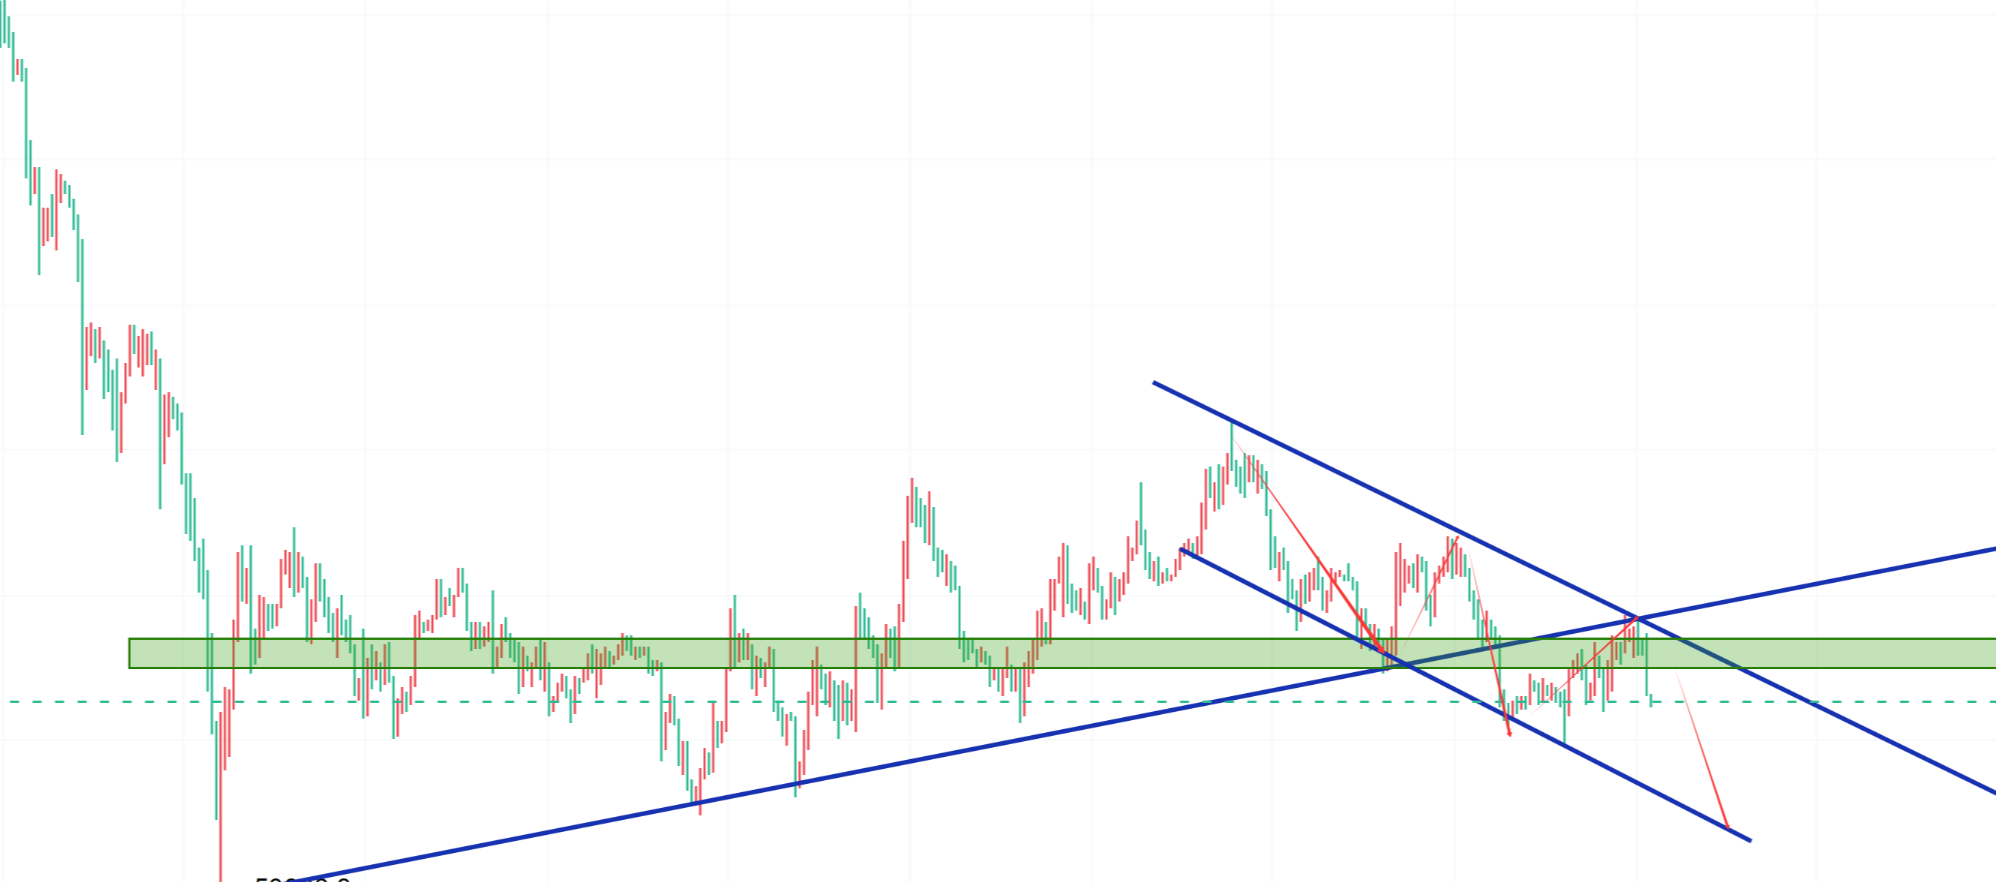
On the four-hour candlestick chart, the EMA indicator has entered a contraction phase, and the MACD volume is gradually decreasing. The candlestick is clearly supported by the bottom, with solid support at the 85,500 level. The DIF and DEA continue to approach the 0 axis, with the middle Bollinger Band support at 87,000 and the upper band pressure at 88,370. The short-term market is mainly consolidating; if the pressure level cannot be broken, it is likely to continue a downward trend. However, if the pressure level is broken, a shift to a northward layout will be necessary.
Short-term Bitcoin trading reference:
Long position layout: Go long in the range of 88,500 to 89,000, with a stop loss of 500 points, targeting 89,500, 90,000, and 91,000.
Short position layout: Go short in the range of 88,500 to 89,000, with a stop loss of 500 points, targeting 88,000, 87,500, and 86,500.
Short-term Ethereum trading reference:
Short position layout: Go short in the range of 2,950 to 3,000, with a stop loss of 50 points, targeting 2,900, 2,850, and 2,800.
Long position layout: Go long in the range of 2,950 to 3,000, with a stop loss of 50 points, targeting 3,050, 3,100, and 3,150.
Disclaimer: The above analysis only represents the author's personal views and does not constitute specific operational advice. Trading based on this information is at your own risk. Investment involves risks; please proceed with caution.

Friendly reminder: The above content is solely created by the author of the public account. The advertisements at the end of the article and in the comments section are unrelated to the author. Please discern carefully, and thank you for reading.
免责声明:本文章仅代表作者个人观点,不代表本平台的立场和观点。本文章仅供信息分享,不构成对任何人的任何投资建议。用户与作者之间的任何争议,与本平台无关。如网页中刊载的文章或图片涉及侵权,请提供相关的权利证明和身份证明发送邮件到support@aicoin.com,本平台相关工作人员将会进行核查。