Author: J1N, Techub News
In just two months, the cryptocurrency market has experienced two terrifying "Black Fridays." The price of Bitcoin plummeted from over $126,000 to around $80,000, a decline of 36%.
On November 21, the global capital markets faced another "Black Friday," with Bitcoin dipping to $80,600 at one point. In just 24 hours, a total of 403,275 people were liquidated globally, with the total liquidation amount exceeding $2 billion; the total market capitalization of cryptocurrencies also fell below the $3 trillion mark, with a 24-hour decline of 10.36%.
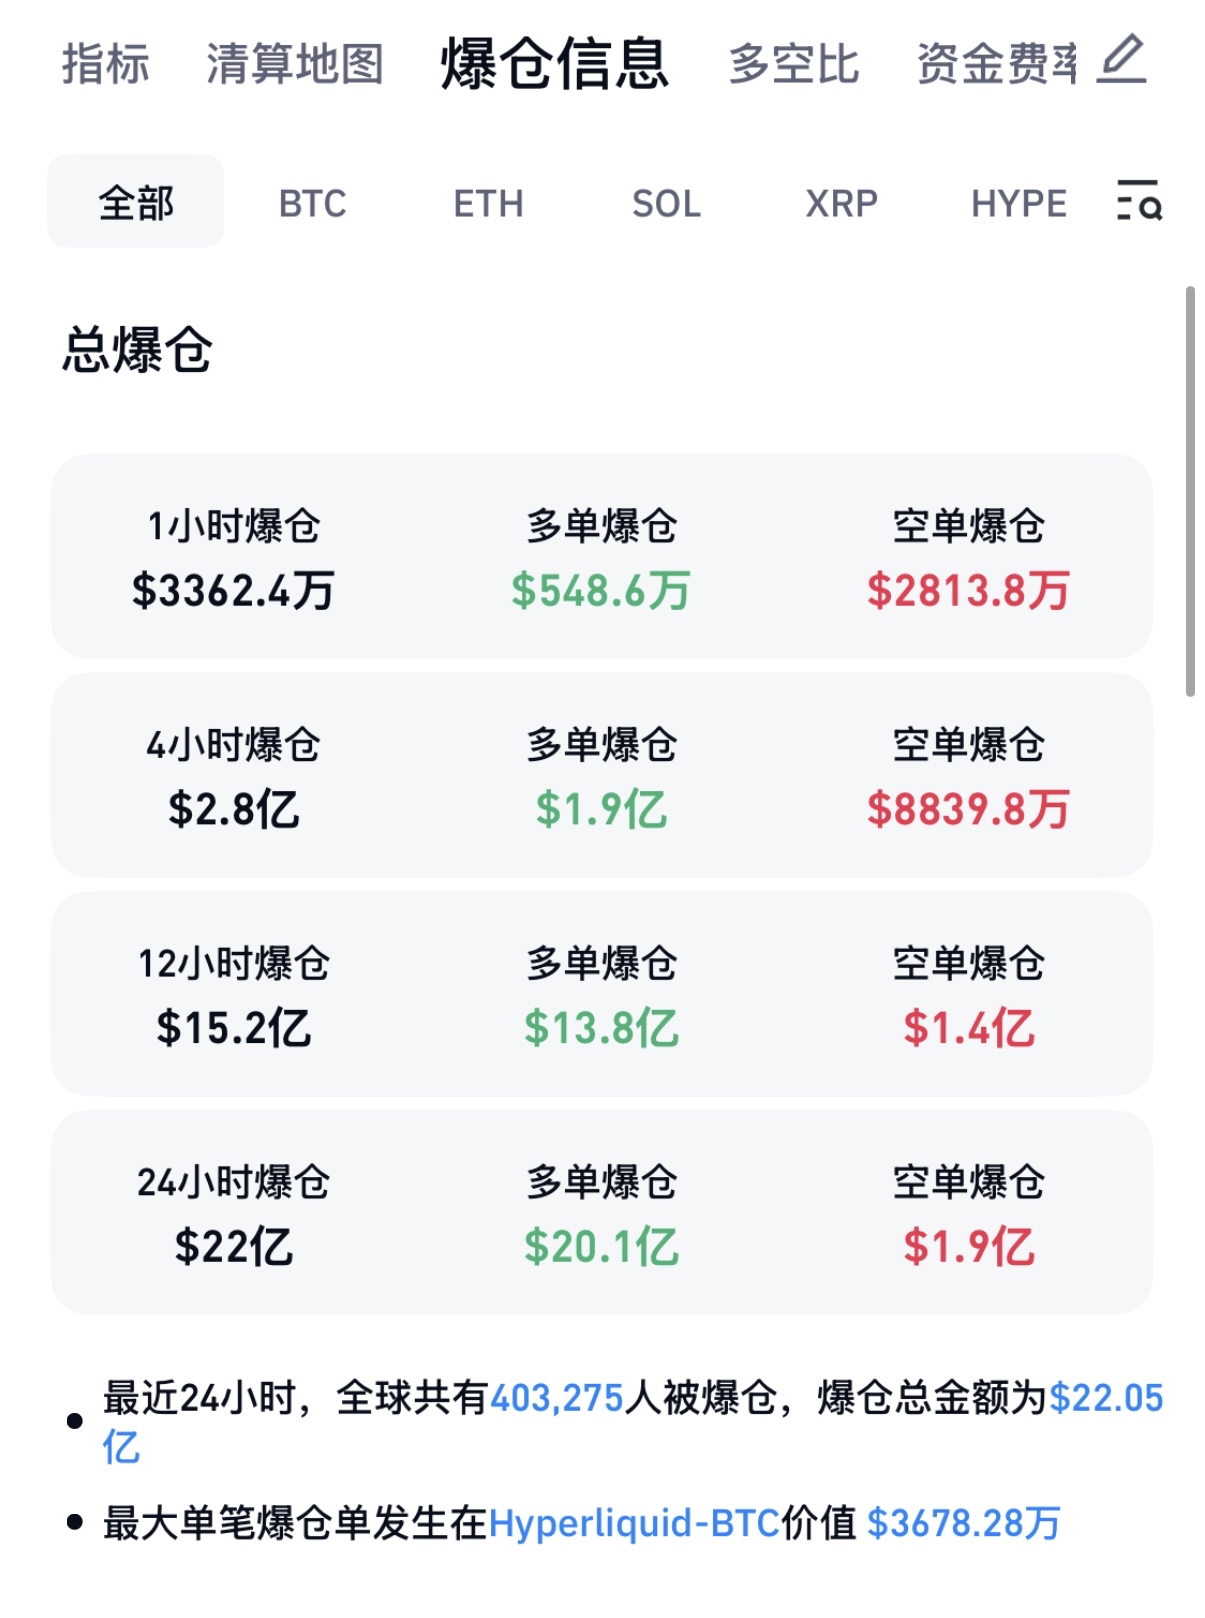
Source: Coinglass
Meanwhile, U.S. stocks opened high but fell, and major European stock indices collectively declined at the opening; the South Korean Composite Index closed down 3.78%, with a cumulative decline of 3.95% for the week; the Nikkei 225 Index closed down 2.40%, with a cumulative decline of 3.48% for the week; A-shares fell 2% and lost the 3,900-point mark; the three major Hong Kong stock indices all hit new lows, with the Hang Seng Index dropping 2.38%; safe-haven assets also took a hit, experiencing consecutive declines, with gold and silver both weakening. Spot gold fell 1.2% to $4,028.23 per ounce; spot silver dropped over 3% to $49.12 per ounce.
The traditional logic of "decreased risk appetite, rising safe-haven assets" completely failed on this day.
Global Suffering, What Happened?
From October to November, it was a "death spiral" for the bulls. The downward risk in the global financial market intensified, the AI bubble narrative dominated the ups and downs of U.S. stocks, the U.S. government's record "shutdown" delayed the release of various important macro data, liquidity shrank sharply, and the probability of interest rate cuts in December fluctuated significantly. Within the crypto market, the DAT flywheel model stalled, reserve institutions began to shrink their balance sheets, and the entire risk structure became more fragile than anyone imagined. When you piece together the events of these two months, you will find that this continuous decline is not accidental, but rather the result of multiple factors accumulating to a breaking point.
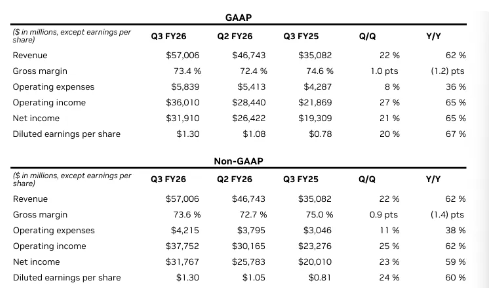
Let's start with Nvidia. Even though Nvidia's third-quarter earnings report released on November 20 was impressive, causing a post-market surge of over 6%, leading the market to believe that the AI story could hold on a bit longer. However, prior concerns about Nvidia's high accounts receivable being unrecoverable and its cash conversion rate being lower than its peers persisted. At the same time, several AI companies were recycling funds, with some transactions being counted as revenue multiple times, leading many investment institutions to sell Nvidia stock, which suppressed the performance of U.S. stocks for an extended period. It was only after a Federal Reserve official expressed optimism about AI and Nvidia's CEO clarified concerns about the AI bubble that U.S. stocks slightly rebounded.
Meanwhile, BlackRock's IBIT ETF recorded an unprecedented outflow of $523 million on November 19, with cumulative outflows exceeding $2.5 billion this month, setting a historical record. Analysts generally believe that this wave of selling pressure mainly came from retail investors in the U.S. stock market selling Bitcoin and Ethereum spot ETFs, triggering further chain reactions among crypto-native users. Looking at the DAT flywheel, it has begun to stall. Top investors predict that various DAT companies will successively sell off reserve assets, with most mainstream DATs' mNAV already falling below 1, and smaller DATs starting to sell coins to buy back stocks, showing significant changes in on-chain reserve liquidity.
Finally, on a macro level, after the U.S. government ended a 43-day shutdown, it resumed data releases, revealing an unexpected increase of 119,000 in non-farm payrolls for September, leading to a resurgence of hawkish voices, causing the probability of a rate cut in December to drop from a "certain cut" of 70% to 30%, with traders even momentarily betting against a rate cut. Until early this morning, several Federal Reserve officials suddenly turned dovish, and the probability of a rate cut soared back to 71%. In this back-and-forth expectation game, Bitcoin has been on sale, facing continuous selling since reaching an all-time high on October 7, with a maximum decline of over 35% in 46 days, nearly falling below the $80,000 mark yesterday.
But even if the market has nowhere to retreat, the problem is still not over. Coinglass data shows that on November 21, the global crypto market liquidation data compared to "1011" indicates that the number of liquidations was a quarter of that on "1011," but the amount was only a tenth, indicating that the market's funds are truly exhausted, and retail investors are out of money. So why does it continue to decline? Is there a larger target?
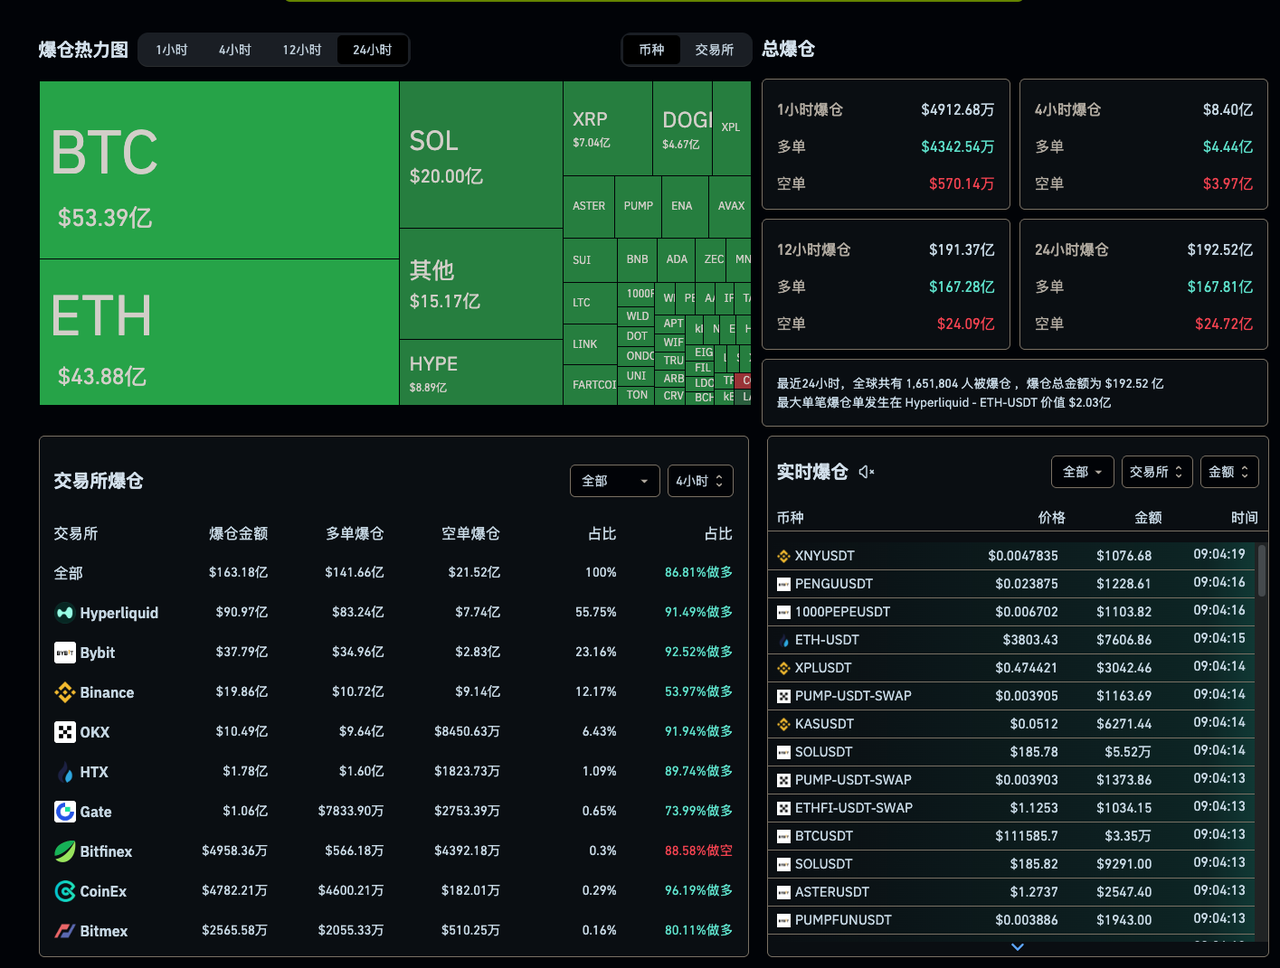
Source: Coinglass (1011)
Who is the Culprit Behind the "Death Spiral of the Bulls"?
Tom Lee, chairman of BitMine, the leading Ethereum reserve institution, directly pointed to market makers as the explanation. He stated that part of the selling pressure in this round of decline came from market makers affected by the October 11 incident, and not just one. The extreme market conditions created gaps in the balance sheets of these high-frequency institutions, prompting them to recover funds, reduce trading, and sell tokens. Market makers, who rely on "spreads for profit," are no longer deep liquidity providers but have become those who prioritize self-rescue.
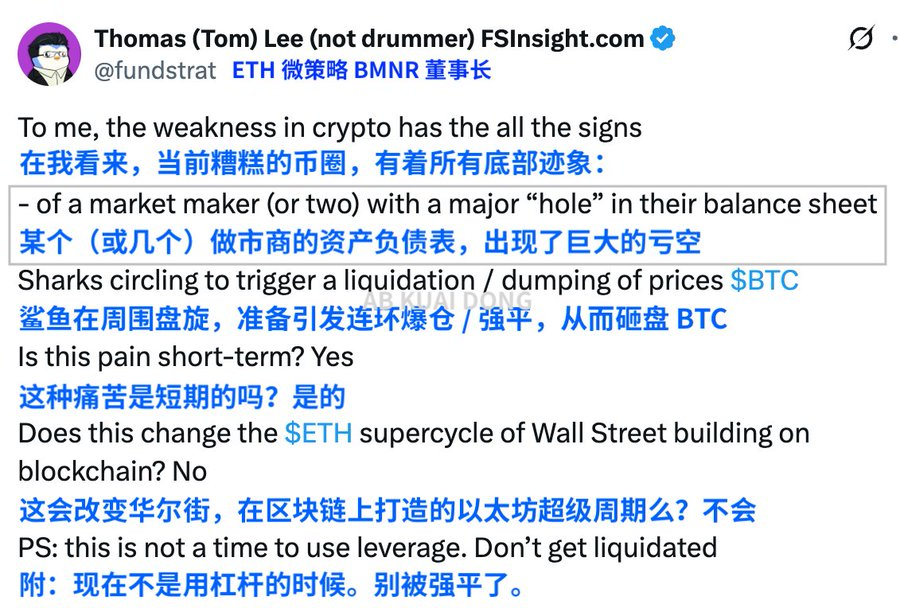
Source: @_FORAB
Balance Sheets Exploding with Black Holes
According to Tom Lee's analysis, the one-sided market on October 11 not only swept away excessive leverage but also dragged market makers down with it. These institutions typically earn spreads through high-frequency matching, similar to "invisible central banks." However, extreme volatility caused their hedging models to fail, resulting in holes in their balance sheets. To stem the bleeding, market makers had to urgently recover funds, effectively dismantling the last layer of safety net in the market.
Cryptocurrency Version of Quantitative Tightening
After the withdrawal of funds, the depth of the order book shrank sharply, with liquidity evaporating by as much as 98% at its worst. This "cryptocurrency version of quantitative tightening" is not a central bank decision but a survival instinct. When orders are thin, even a small amount of selling can breach price levels, triggering more forced liquidations. Predatory traders take advantage of this to push prices down, creating a vicious cycle where prices no longer reflect asset values but mirror the failure of market mechanisms.
Lee stated, "Market makers are essentially like the (cryptocurrency) central bank. When their balance sheets are damaged, liquidity tightens, and the market becomes fragile."
Once the prices of mainstream coins continue to fall, they will have to sell even more coins to ensure they have a certain amount of cash on hand.
The Market Begins to Look for the Next "Liquidation Target"
In the past few weeks, some have attributed this market trend to whale sell-offs, reversals in Federal Reserve expectations, and market makers withdrawing depth, or even to net outflows from ETFs. However, such explanations only capture the present and overlook the cyclical nature itself, easily missing a more fundamental historical pattern: bull markets never abruptly stop at highs but automatically digest themselves in a "liquidation chain" manner after reaching peaks.
And the order of the liquidation chain never changes.
The First to Fall are the "Bull Believers"
Those who were still shouting "140,000" and "the ETF bull market is taking off" at $120,000 were the first to be buried. They are accustomed to adding positions at the top, believing that as long as "institutions are still buying," a pullback is just an opportunity to get on board. A slight price movement can trigger a chain reaction of liquidations. Next are those who mistakenly believe they are safe with low leverage. This round of high-position liquidations did not start with those using 50x or 100x leverage but rather with those previously seen as "absolutely safe" low leverage: 30% borrowing, 0.5x contracts, which also got swept away. The days of October 10-11 are typical textbook cases, where the market didn't even give you time to react, with a sudden spike, a wave of liquidations, and a widespread impact, leaving no chance to escape.
Thus, low leverage is not safe; liquidation may be delayed but will eventually come.
The Second Group is Market Makers and Quantitative Institutions.
Do you think market makers are invincible? Many people imagine market makers as "supporters" who always stand at the bottom of the market, believing that depth is always there and slippage is always covered. Market makers are not gods; they can run out of money, incur losses, and panic.
On March 12, 2020, the depth was as thin as paper; during the multiple waterfalls in 2021, the actions of Alameda and Jump were noticeably conservative; after the LUNA explosion in 2022, even crypto banks and structured institutions were swept away. The market conditions in October and November of this year are almost a historical replay, with many market makers' available funds visibly decreasing, and the depth of spot trading and perpetual contracts showing noticeable deterioration, while quantitative strategies were withdrawn, and ETF cross-market hedging fell behind.
The chain reaction of stablecoins decoupling, market makers, lending whales, and quantitative institutions retreating, even becoming the "ignition" for accelerated crashes. "Market supporters" are not "eternal bottom holders." When depth begins to thin and hedging costs rise, they are not stabilizing the market but fighting for survival.
The Third Group is DAT Model Institutions, Token Reserve Institutions, and Family Funds.
They are the "accelerators" of the bull market, but don't forget that as institutions, they have no faith, only spreadsheets. Once the logic for rising prices halts, they are the first to withdraw. Since September, if you closely observe on-chain addresses, you can feel their rhythm changing: mNAV continuously deviating, reserve accounts slowly reducing positions, some DAT products' rolling fund flows stopping, and several structured institutions starting to use Bitcoin and Ethereum to fill the gaps in their spreadsheets. This has been particularly evident in the past two weeks, with on-chain data showing an increase in their selling and transfer activities, almost identical to the patterns seen in December 2021 and early 2022.
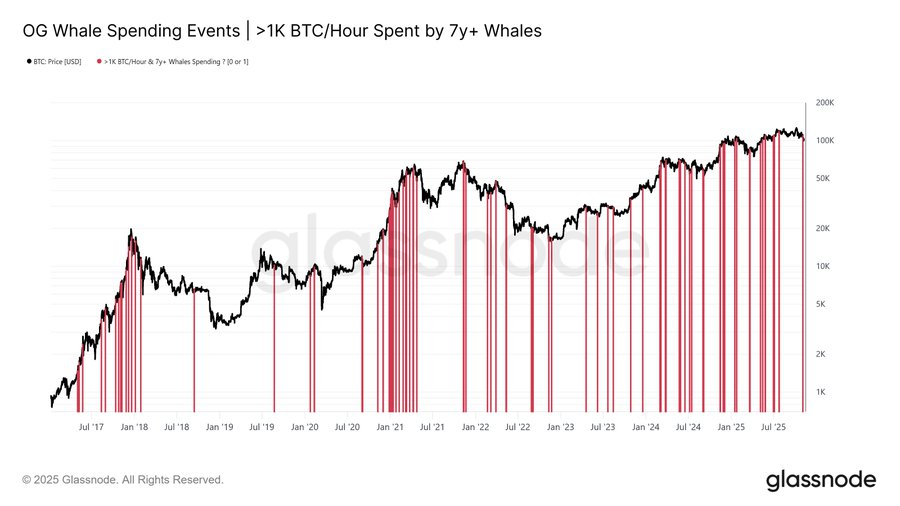
Source: Glassnode
So when you put all of this together, you will find that the current market is very much like the aftershocks following the ICO bubble in 2019, and also resembles the prelude to the liquidation wave that started in 2021.
Combining the above three factors reveals the essential state of the current market: it's not that the bull market is over, but that the load is too heavy and needs to be "unloaded." The power of the bulls has been exhausted, market depth has been withdrawn, and the structured demand from institutions has weakened, leading to a temporary depletion of upward momentum. Of course, this is not yet the kind of "chaos" that marks the end of a bear market. There hasn't been extreme panic on-chain, funds have not fully retreated, and whales are not panic selling. It feels more like the bull market story is only halfway told, the narrative is not dead, but the main characters are starting to exit, leaving behind a chaotic battle among secondary characters.
Is this the beginning of the "bear market liquidation chain"?
From historical experience, on-chain data, market-making behavior, and institutional posture, this indeed exhibits characteristics of "early bear market liquidation," not the kind of crash that is immediately obvious, but rather a "chronic ischemia," gradually making the market aware that the logic for rising prices has been exhausted. In the next 1-2 months, if Bitcoin continues to test the $80,000 support repeatedly, and the rebounds remain weak, it can be confirmed that: the first half of the bull market has ended, and the market has entered a "structural reconstruction period."
However, if funds flow back in, depth recovers, and institutions resume buying (albeit with some effort, as they have mostly bought what they needed), then this downward movement may just be a "mid-bull market liquidation," similar to the "halftime breaks" seen in September 2017 and September 2020.
Regardless, the trend of Bitcoin is always more complex than the charts. The market is deciding who will take on the next liquidation target: market makers completely liquidated? DAT model institutions? Crypto banks? Reserve-based small countries?
We cannot predict the trend clearly, but what we can do is to reduce leverage and avoid taking chances.
免责声明:本文章仅代表作者个人观点,不代表本平台的立场和观点。本文章仅供信息分享,不构成对任何人的任何投资建议。用户与作者之间的任何争议,与本平台无关。如网页中刊载的文章或图片涉及侵权,请提供相关的权利证明和身份证明发送邮件到support@aicoin.com,本平台相关工作人员将会进行核查。


