Master Discusses Hot Topics:
Although there was no significant rebound or drop this weekend, I feel the market has become a bit more relaxed. The market has finally started to show some signs regarding tonight's U.S. stock market and the interest rate cuts in December, unlike last week when it was in a frenzy.
Everything now depends on the opening of the U.S. stock market tonight; typically, the Asian market doesn't stir up much. The real direction is still determined by those American machines that love to panic on weekends and continue to sell off in the Monday morning session.
Additionally, the most frustrating part of this week is that Thanksgiving and Black Friday are squeezed together. The U.S. stock market will be closed on Thursday and only open for half a day on Friday, so the only days to really stir up the market are the first three days.
As long as nothing crazy happens in these few days, we can catch a breath next week. But once December arrives, the difficulty will increase again. You know, year-end funds, institutional settlements, and data releases will all come out at that time.
Back to the market, what really caught my eye was the structure of Bitcoin's chips I saw this morning. The range from 82K to 85K had only 310,000 chips four days ago, and now it has surged to 796,000 chips.
In plain terms, during the moment of the sharp drop over these four days, it wasn't just retail investors bottom-fishing; the entire market stuffed in a whopping 490,000 chips in that narrow range.
Some say retail investors are panicking? I don't think that's entirely true; this kind of dense accumulation trend is mostly a sign of large funds spilling over. In other words, when it dropped to 82K, it wasn't retail investors bottom-fishing; it was a bunch of whales jumping in to grab chips.
What effect will this chip accumulation have? As long as the massive chips at 93K above don't suddenly sell off collectively, this dense chip area below will eventually exert a gravitational effect, pulling the price back up. At that time, the market will be in a shallow bear rebound, not dropping deeply but rising slowly.
Bitcoin has already touched the strong resistance level of 88.1K this morning, with three overlapping pressures: the lower Bollinger band of the 5-day line, the middle Bollinger band of the 8-hour line, and the daily EMA7, all squeezed together.
If it doesn't move sideways for a few K lines here, it would be against the natural order. Short-term bulls can still sneak a bit of profit around 86.1-85.5K; if it breaks below 85K, then just forget it. It’s better to give up directly, don’t hesitate.
The hardest resistance above is the middle Bollinger band of the 12-hour line at 90.2K and the lower Bollinger band of the weekly line at 90.6K. Currently, it’s clear that the range from 88.1K to 90.6K is the limit for this round of daily-level rebounds.
The weekly structure is more evident; last week the MA50 broke down, and the trend line broke down, which is a typical trend looking for a correction. But the good news is that the support from 74.6K to 86K on the weekly line has been basically validated, so we will see a rebound and repair in the coming weeks.
What truly convinces me that the bottom has emerged is the daily trading volume on November 21, which hit the highest in nearly six months, even larger than the crash on October 10. This indicates that 80.6K is the recent bottom, and the darkest moment for bulls has passed; now we just need to see how the rebound unfolds.
Ethereum is similar; the lower Bollinger band on the weekly line is at 2852, and the 4-hour EMA30 is at 2857. It was just touched and then pushed down; the current volatility is still moderate. The short support is at 2770-2750, and the strong resistance is at 2871-2892, which is still near the Fibonacci 0.618 level.
In the short term, as long as it dares to rebound to 2850-2882, it can be shorted. If it can't break through 2892 again, this wave of Ethereum's rebound will be declared temporarily over.
And now we are in the stage of catching up; if it stabilizes at 2850, the next target will be 3000-3170. However, both the Asian and European markets are testing the market, and the real direction will still depend on tonight's U.S. market.
Master Looks at Trends:
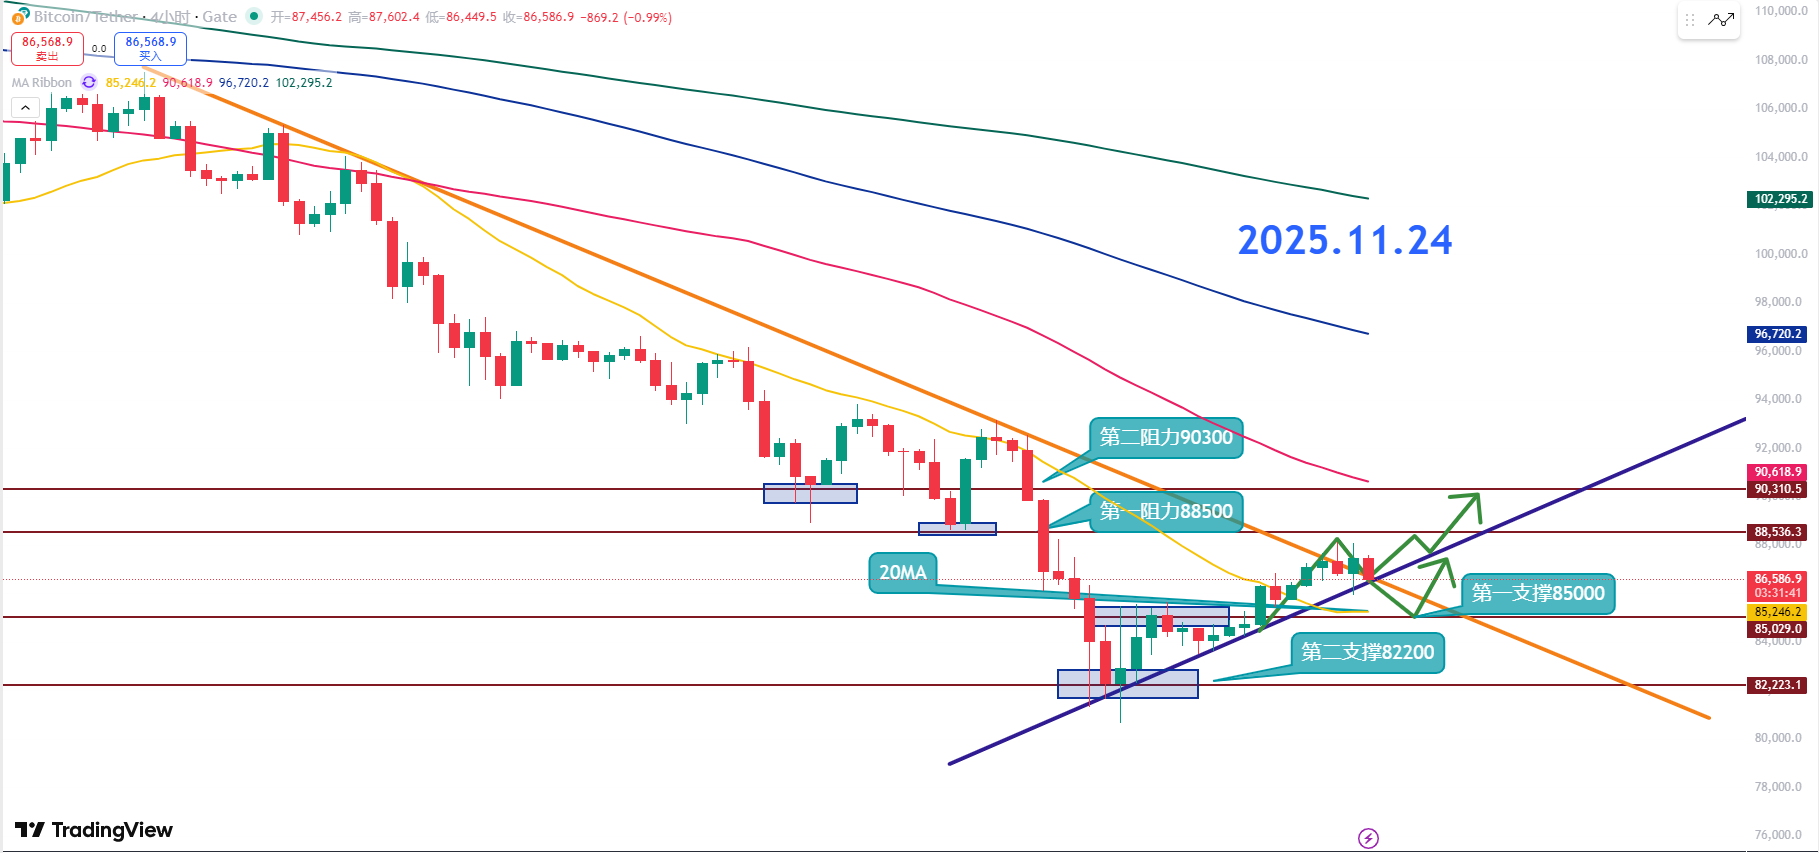
Resistance Level Reference:
Second Resistance Level: 90300
First Resistance Level: 88500
Support Level Reference:
First Support Level: 85000
Second Support Level: 82200
Currently, the first support level of 85K on the 4-hour chart is very critical. The overlap of 85K and the 20-day moving average makes this a typical technical pullback area. No matter how strong the short-term rise is, it could drop back at any time to test the 20MA, so I consider the 20MA as the second line of defense.
We are currently in a trend re-testing phase, and whether the pullback can stabilize is very important. Next is the box range of 85K to 88.5K; short-term trading will focus on this range.
The question arises, why is 85K critical? Because this is a technical level where a rebound will occur after a drop. Short-term traders can try here, but for long-term investors, if this position cannot hold, they will directly prepare to look at the second support at 82.2K.
The first resistance at 88.5K, as long as it is effectively broken and stabilized, will lead to a re-test of the second resistance at 90K. But it won't surge past 90K in one go; it’s likely to first pull back, shaking off a wave of retail investors' chips before looking bullish.
11.24 Master’s Wave Strategy:
Long Entry Reference: Not currently referenced
Short Entry Reference: Light short in the 88000-88500 range, Target: 87000-86000
If you truly want to learn something from a blogger, you need to keep following them, rather than making hasty conclusions after just a few market observations. This market is filled with performers; today they screenshot long positions, and tomorrow they summarize short positions, making it seem like they "always catch the top and bottom," but in reality, it’s all hindsight. A truly worthy blogger will have a trading logic that is consistent, coherent, and withstands scrutiny, rather than jumping in only when the market moves. Don’t be blinded by flashy data and out-of-context screenshots; long-term observation and deep understanding are necessary to discern who is a thinker and who is a dreamer!
This article is exclusively planned and published by Master Chen (WeChat public account: Coin God Master Chen). If you want to learn more about real-time investment strategies, solutions, spot trading, short, medium, and long-term contract trading techniques, and knowledge about candlesticks, you can add Master Chen for learning and communication. A free experience group for fans has been opened, along with community live broadcasts and other quality experience projects!

Warm reminder: This article is only written by Master Chen on the official account (as shown above), and any other advertisements at the end of the article and in the comments are unrelated to the author!! Please be cautious in distinguishing authenticity, thank you for reading.
免责声明:本文章仅代表作者个人观点,不代表本平台的立场和观点。本文章仅供信息分享,不构成对任何人的任何投资建议。用户与作者之间的任何争议,与本平台无关。如网页中刊载的文章或图片涉及侵权,请提供相关的权利证明和身份证明发送邮件到support@aicoin.com,本平台相关工作人员将会进行核查。


