
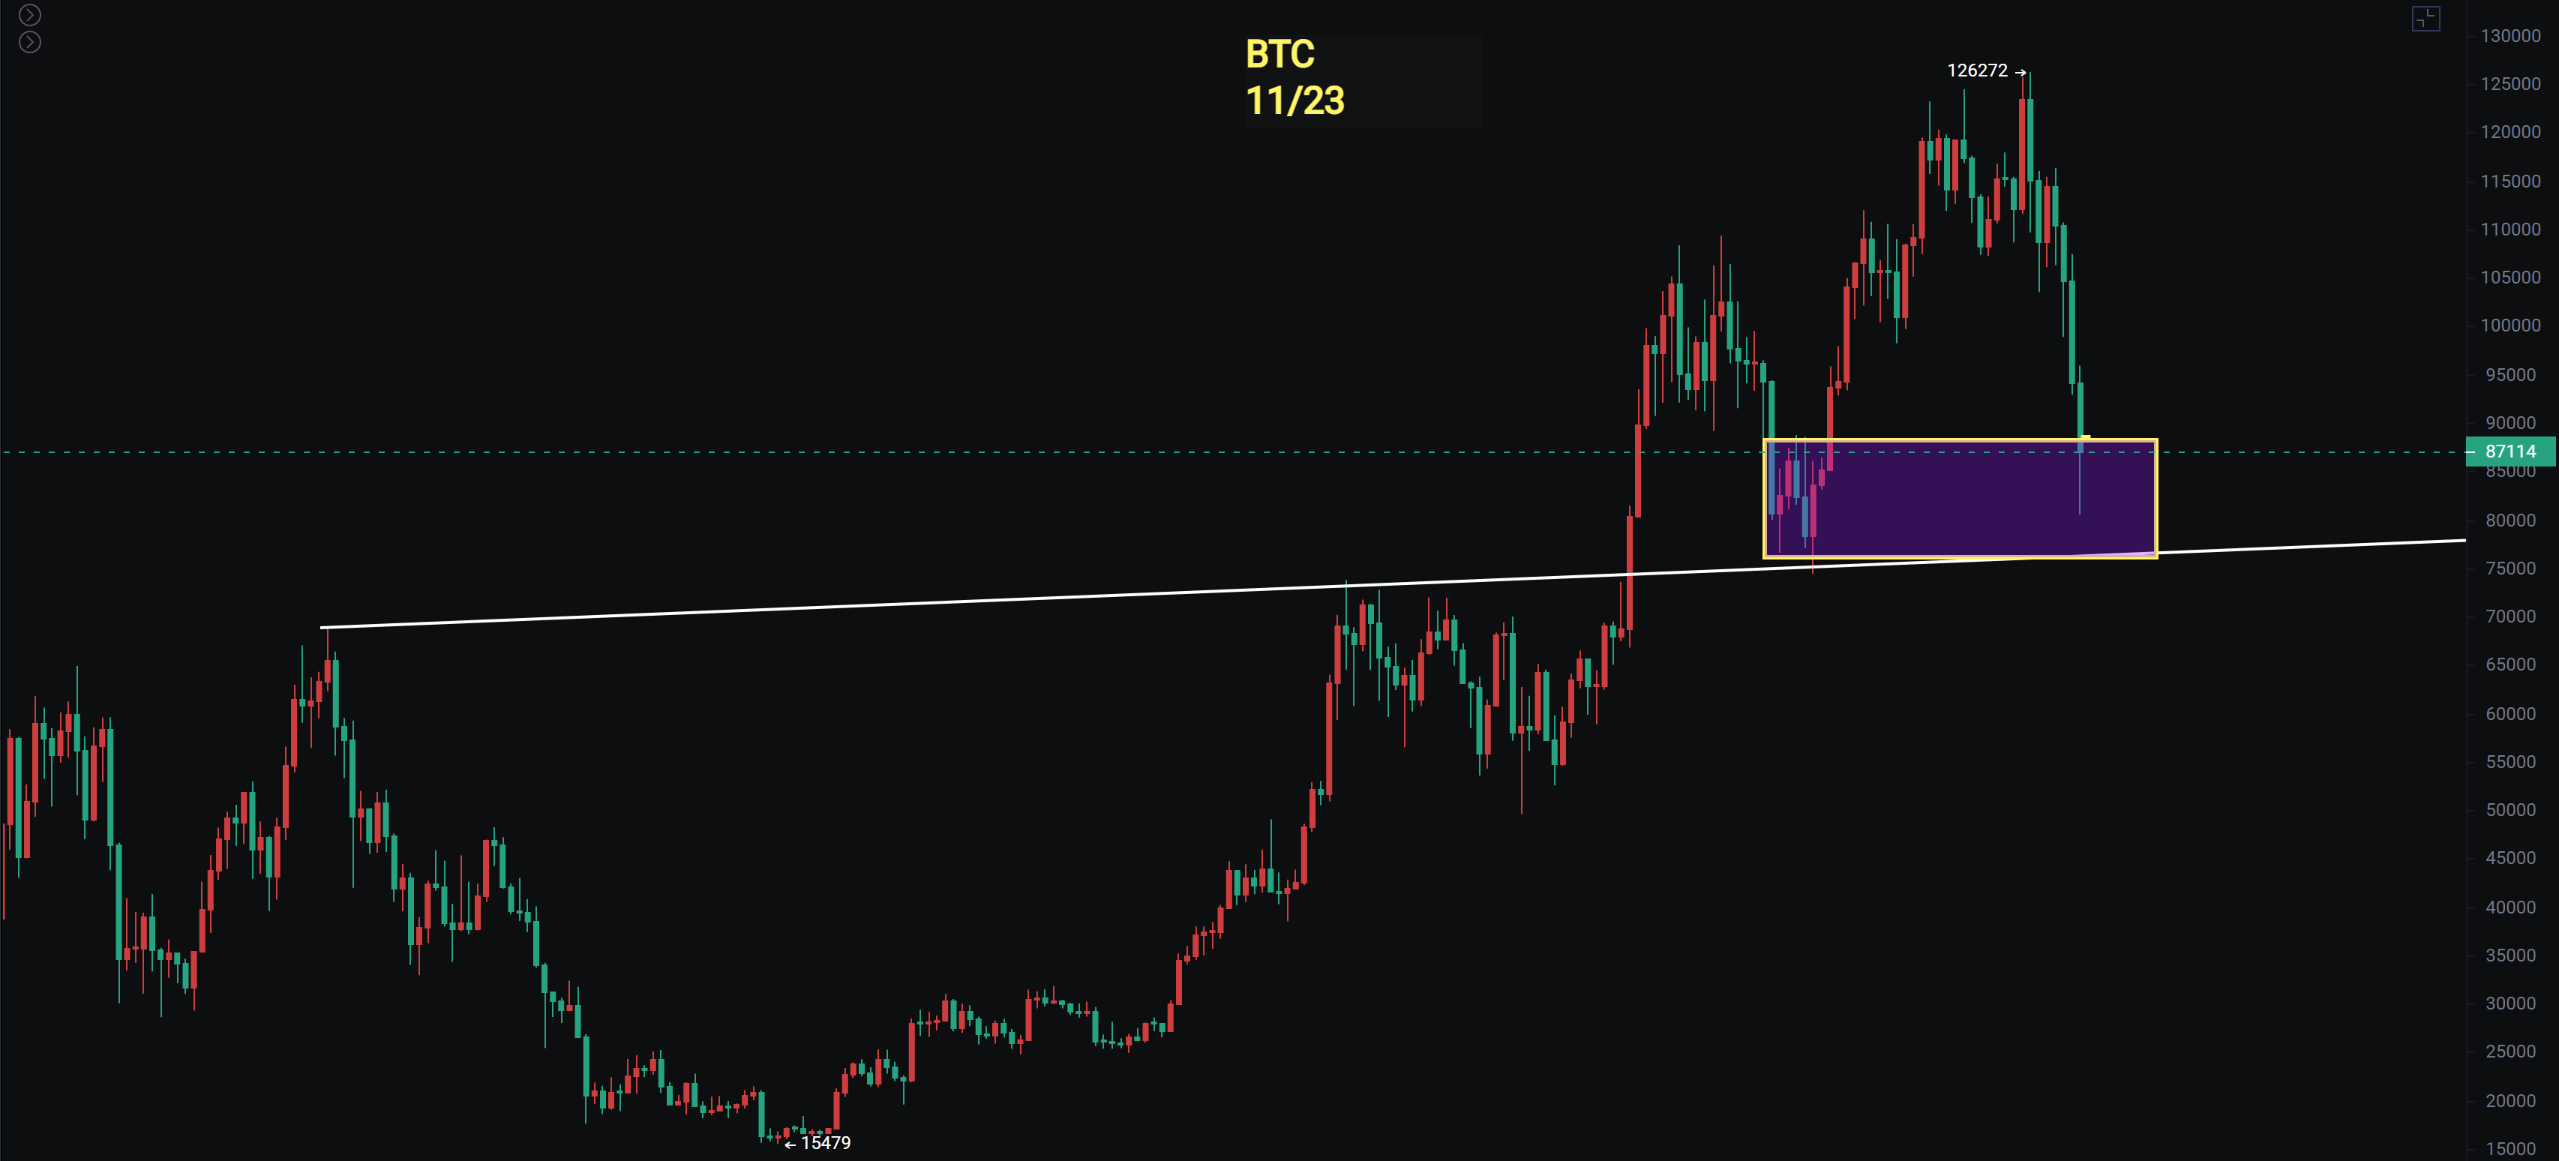
The Bitcoin weekly chart is about to close, with a minimum spike at 80600. The next support level is around 74500, which is a strong support. It is currently difficult to determine whether the daily line has completely bottomed out, but it is approaching the rebound zone. The weekly line is testing the support of the M head, and normally it should not break down in one go. The probability of a rate cut in December is 71%, and there is about half a month left, which is also a positive factor. Additionally, from 2019, 2020 to the present, we have been able to grasp the "Spring Festival red envelope market" every year. Therefore, we also believe that there is a high probability of a Spring Festival market this year, which means a wave of rebound is coming.
The performance of the U.S. stock market next week is exceptionally critical. The three major U.S. stock indices have shown a false breakout and have fallen back. From the overall weekly and monthly lines, engulfing patterns have appeared. Therefore, the trend next week is very crucial; if it continues to break down, there may be a significant drop. Moreover, Bitcoin has already fallen by 36%, which will have a considerable impact.
Bitcoin
Bitcoin has temporarily dropped to a minimum of 80600, and the one-hour level rebound is currently encountering the recent one-hour descending pressure line. To determine if it has bottomed out, it needs to break through the pressure at 88600 and the entire four-hour downtrend line. Currently, the market is still considered a small rebound, but for spot traders, it is possible to accumulate in batches in the 74500-80000 range and above 80600 to bet on a rebound.
Support: 74500 - 80600
Resistance: 88600 - 94300 - 100300
Ethereum
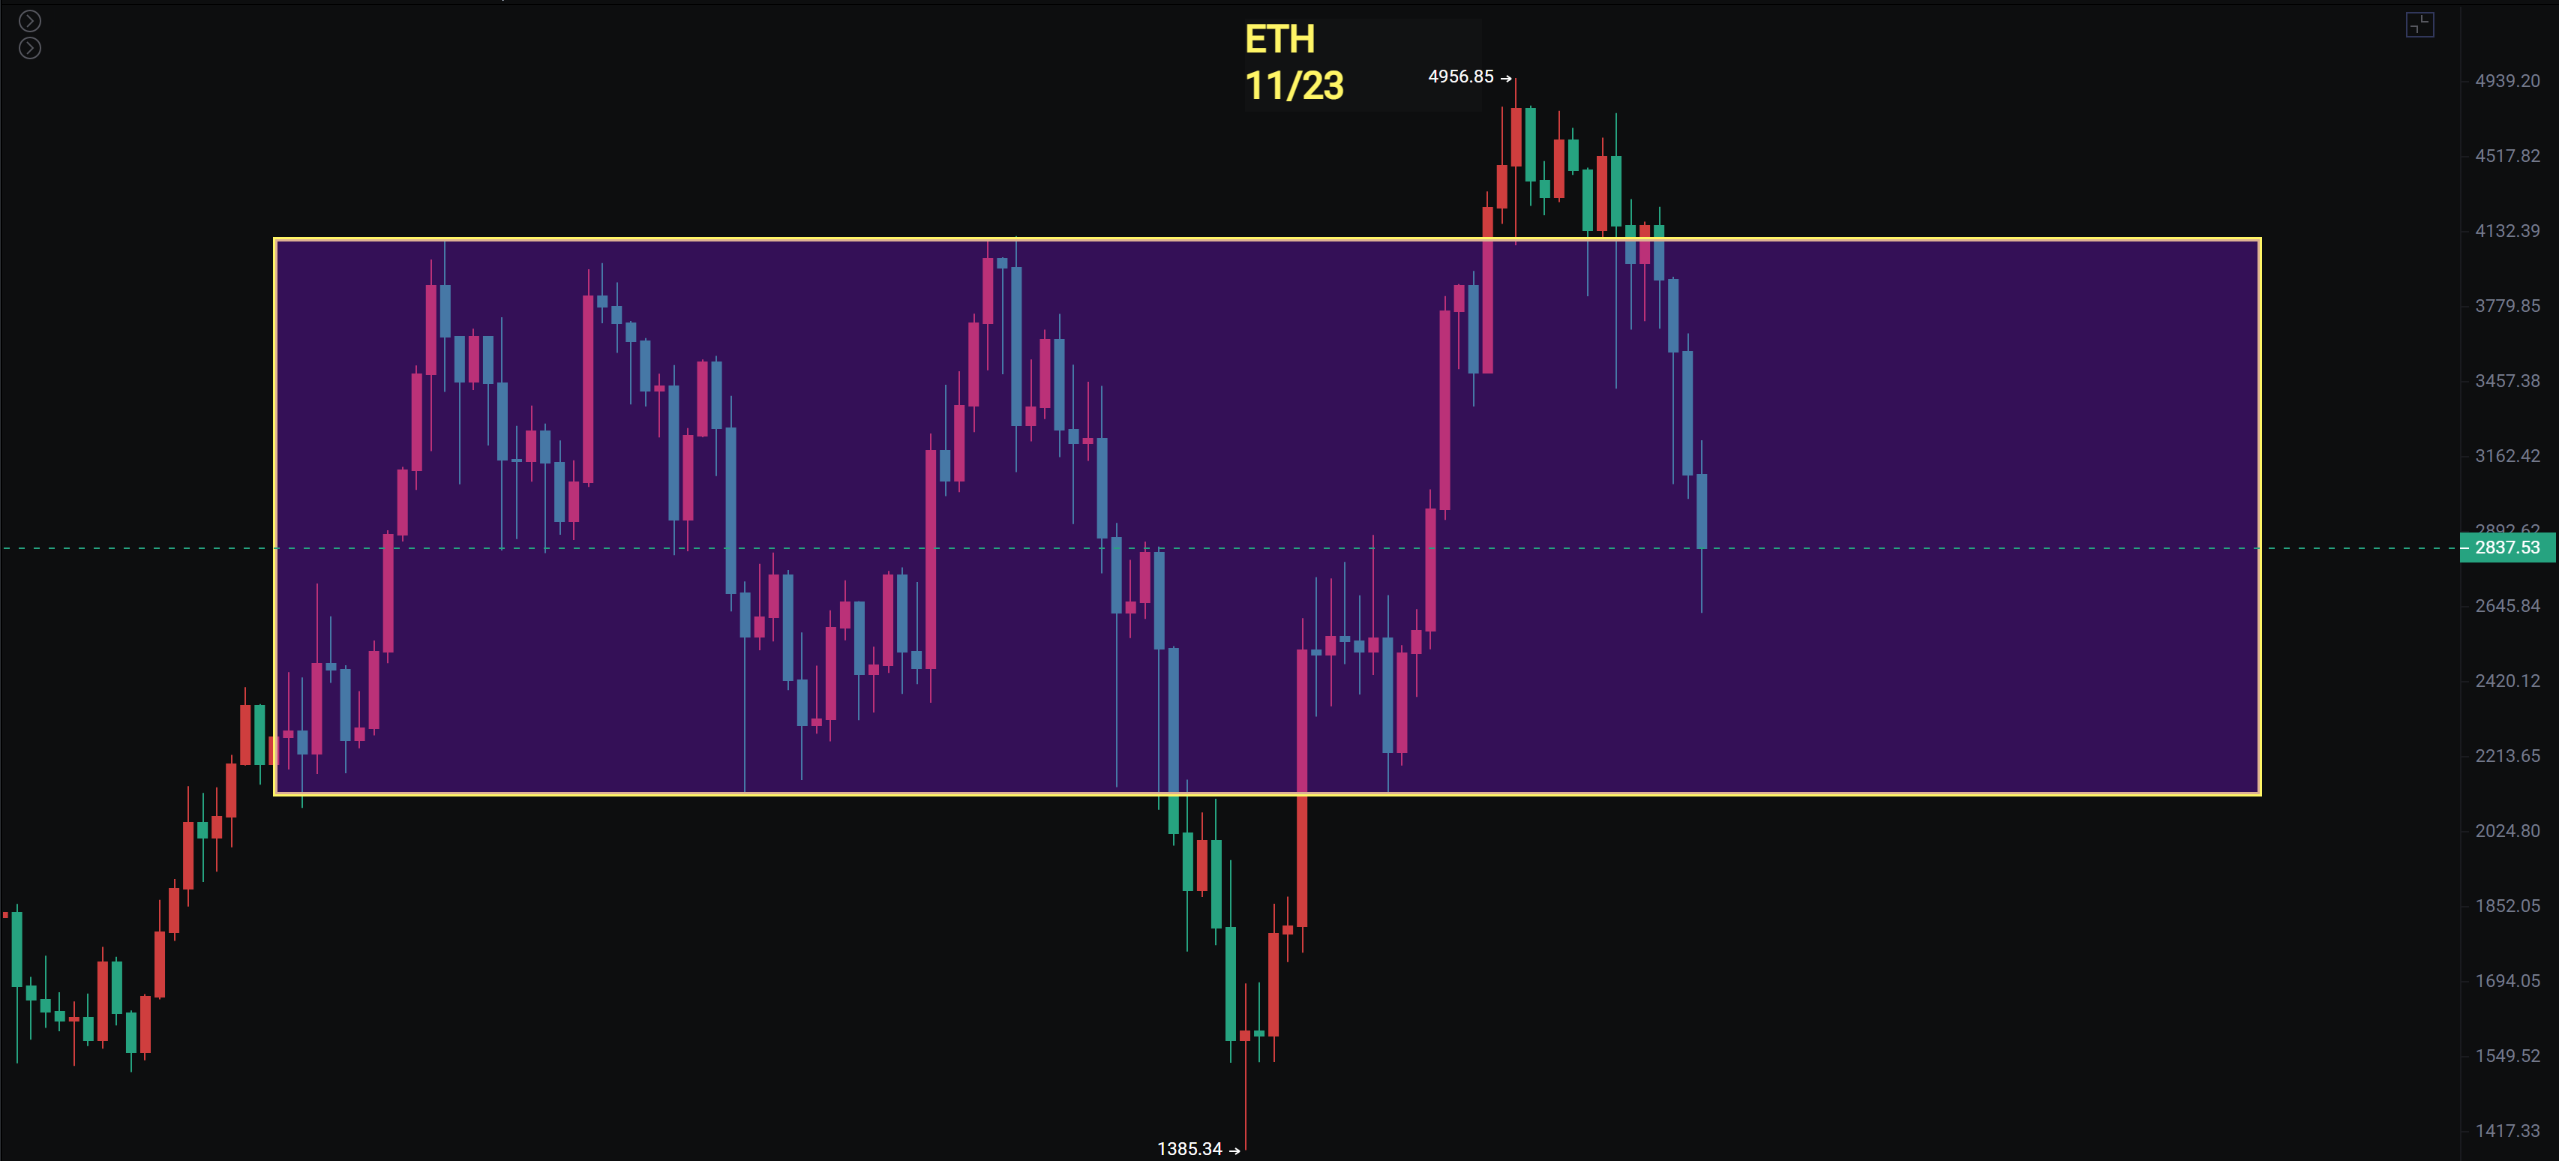
Ethereum has been bearish since the MACD crossed below the zero line. Additionally, the weekly chart previously formed two sets of "double bullish engulfing with a bearish candle," and it has now dropped to around the Fibonacci 0.618 level with a spike. Although the monthly line has also shown a top divergence, the situation is slightly better than Bitcoin. The daily line has dropped to the upper support of the 2300-2800 range, and spot trading can still be accumulated in batches, with a stop loss at 2623, but contracts can only be traded for very short-term rebounds. More attention should be paid to the rebound opportunities in altcoins.
Support: 2300 - 2623
Resistance: 3170 - 3600
If you like my views, please like, comment, and share. Let's navigate through the bull and bear markets together!!!
The article is time-sensitive and for reference only, updated in real-time.
Focusing on K-line technical research, sharing global investment opportunities. Public account: BTC Trading Prince Fusu

免责声明:本文章仅代表作者个人观点,不代表本平台的立场和观点。本文章仅供信息分享,不构成对任何人的任何投资建议。用户与作者之间的任何争议,与本平台无关。如网页中刊载的文章或图片涉及侵权,请提供相关的权利证明和身份证明发送邮件到support@aicoin.com,本平台相关工作人员将会进行核查。


