Yesterday, Bitcoin was at 80,600, and it accurately bottomed out, rising more than 5,000 dollars overnight. So, can we still bottom out at 80,000 today? Can we continue to enter around Ethereum at 2,600? Can it hold?
Today, we will analyze these two or three themes.
Today, we mainly discussed these three themes: entry range, take profit, stop loss levels, and two plans for a steady and aggressive approach. Just follow the steps: find the position, find the pattern, control the risk.
Can we bottom out at 80,000?
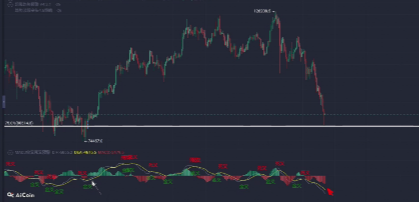
First, we need to look at the 4-hour level. Yesterday, it was mentioned that if a sideways consolidation forms at the 4-hour or hourly level, and if it gives a second chance to return to around 80,000, if it falls back at this position, it will form a sideways consolidation box around 80,000.
Moreover, it would be best if the 4-hour chart also formed a MACD divergence. Currently, the 4-hour chart has not formed a golden cross yet.
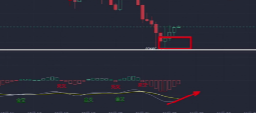
Right now, it is in a V-shaped reversal, and we are waiting for it to pull back.
For Bitcoin, considering the V-shaped reversal, we need to think about where to short. First, if we are looking for a short position, the short pressure levels we see are between 86,000 and 92,000. These two pressure points are 86,738 and over 92,000, which is at the 4-hour level.
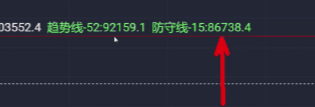
In a fast scenario, it could reach 90,000 to 92,000 in three to five days, and 86,000 is within reach. I can't wait long; we will wait for a short and see where it slightly reverses.
The key is the pattern. Assuming a medium to long-term perspective, if we want to bottom out more safely, we need to look at the pattern. Brothers, have you seen the MACD pattern of Bitcoin's recent rise? This golden cross and the range of this golden cross.
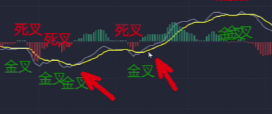
Has it formed a dual golden cross, where one golden cross is lower than the second golden cross? Thus, a dual golden cross structure is formed here. Although this is not a standard small double bottom, this is the insidious nature of the market makers.
What you need to pay attention to is that its MACD has already shown a bottom divergence, forming a dual golden cross. It has repeatedly tested this structure for bottoming, which is relatively much safer and will not catch a falling knife like this structure. Let's compare whether the MACD has formed a golden cross here.
Has it even failed to form the first golden cross? This golden cross, if broken, does not count, and this MACD has not even contracted.
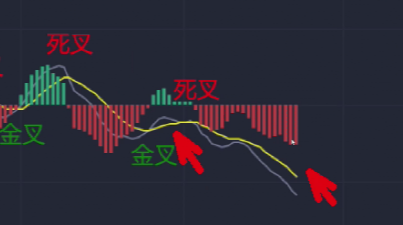
Its energy bars are still expanding, so even if we bottom out, we need to ensure we bottom out properly. After that, if it rises a few thousand dollars, we need to secure our profits and ensure we have a safety net to avoid turning profitable trades into losses.
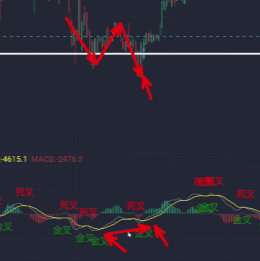
Now, let's look at Ethereum. From the daily level, it is clear that it does not meet the bottoming structure, like here with the dual golden cross.
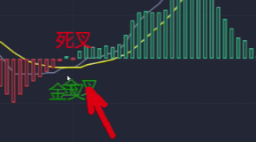
One golden cross, dual golden cross, these two golden crosses are closely combined, and under such a structure, its main upward wave has started.
Currently, Ethereum has dropped to an important support level, which is around 2,600.
Yesterday, the bottoming opportunity was around 2,600, and some of our group members entered at 2,630 and some at 2,680, building their long positions in batches.
For spot trading, I personally believe that 2,600 and 2,700 can be accumulated in batches. Think about it: it took only 18 days to drop from 3,700 to 2,700, a drop of 1,000 points.
If the spot price rises from 2,700 or 2,600 to 3,000, do you have confidence in holding this range?
This indicates that it is only suitable for intraday trading; if you pride yourself on selling high, then don't talk about bottoming.
For friends doing spot trading, it's simple: you can bottom out in batches at 2,600 and 2,700, and you can build positions in batches down to 2,380 and 2,400. Accumulate in batches when it drops by 80 to 100 dollars. There’s nothing wrong with that.
If we are doing short-term trading, where do we go long? For intraday trades, if it pulls back to around 2,680 or 2,600, we can go long.
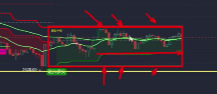
From the 15-minute structure, it is currently climbing, but to be honest, it has not yet reached the medium to long-term position. This 15-minute area is clearly a box consolidation.
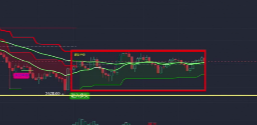
When it reaches the pressure around 2,800, it will consolidate within this box. As long as it does not break 2,820, we can short at highs. If it pulls back to 2,630, 2,680, or 2,700, we can clear our positions and go long in these mid to lower areas.
免责声明:本文章仅代表作者个人观点,不代表本平台的立场和观点。本文章仅供信息分享,不构成对任何人的任何投资建议。用户与作者之间的任何争议,与本平台无关。如网页中刊载的文章或图片涉及侵权,请提供相关的权利证明和身份证明发送邮件到support@aicoin.com,本平台相关工作人员将会进行核查。