# 1. Core Principles of the Indicator
1. What is the RSI+OBV Multi-Dimensional Verification Strategy?
The RSI+OBV multi-dimensional verification strategy is an analytical method that integrates two classic tools: RSI (Relative Strength Index) and OBV (On-Balance Volume). It significantly enhances the reliability and accuracy of trading signals through the mutual verification of multiple conditions.
Core Idea:
Centered on "volume-price resonance," meaning that price changes and capital flows must be synchronized.
RSI is responsible for assessing the upward/downward momentum of prices.
OBV is responsible for tracking the true flow of market funds.
Combined with increased trading volume to confirm market consensus on signals, it captures potential turning points in trends in advance using divergence signals. By cross-verifying across multiple dimensions, it effectively filters out erroneous signals generated by single indicators, accurately identifying high-quality trading opportunities that possess both "price momentum" and "fundamental support."
2. Calculation Formula:

# 2. Signal Definition: Detailed Explanation of Strength Signals
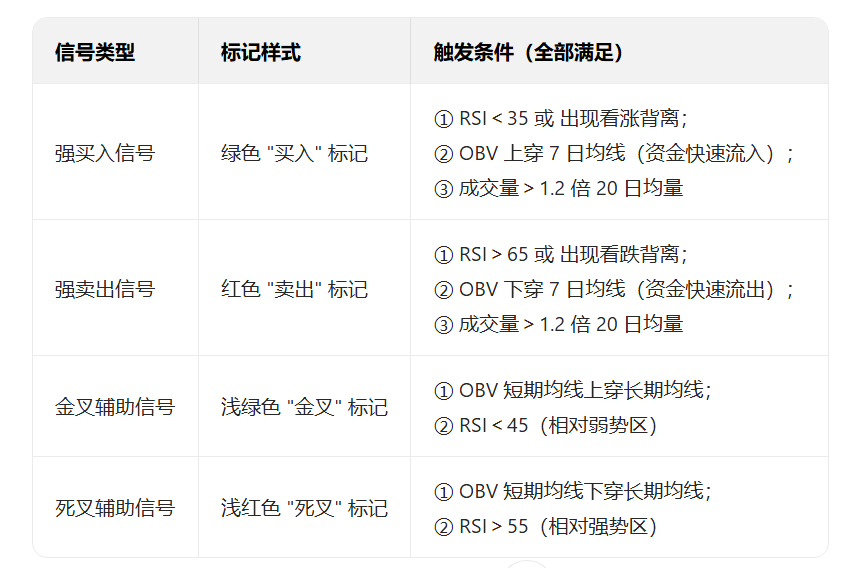
This strategy categorizes trading signals into strong signals (primary trading basis) and auxiliary signals (trend confirmation or oscillation reference) to adapt to different market environments.
1. Signal Priority and Application Strategy
Strong Signal Priority Principle: Strong signals ("buy" or "sell") have the highest priority and reliability, performing best at the initial stage of trend initiation or key turning points, and should be executed first.
Auxiliary Signal Supplement Principle: Auxiliary signals should serve as references for trend confirmation or, when strong signals are not triggered, be combined with candlestick patterns and support/resistance levels for secondary confirmation to avoid sole reliance.
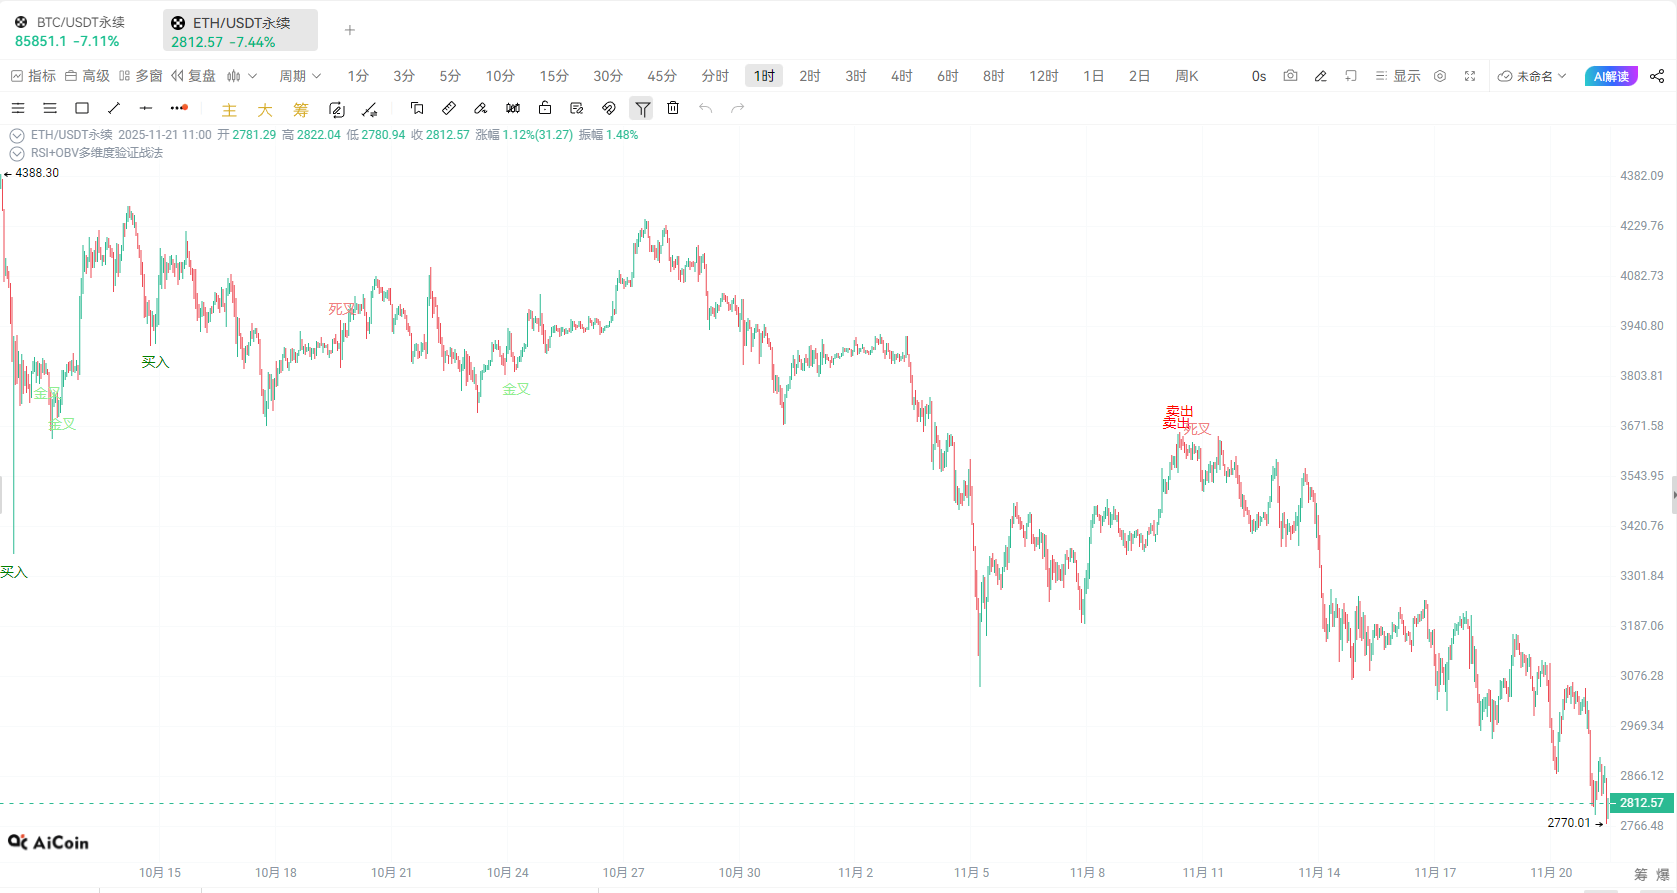
# 3. Custom Indicator · Signal Effect
(Chart OKX-BTC USDT Perpetual Contract 1-Hour Cycle)

(Chart OKX-ETH USDT Perpetual Contract 1-Hour Cycle)
# 4. Custom Indicator · Script Source Code
// This indicator was created by the AICOIN Research Institute. If you encounter any usage issues, you can join the indicator community for consultation.
// @version=2
// === Parameter Settings ===
rsi_period = 14
div_lookback = 14
maobvshortlen = 7
maobvlonglen = 30
volumemalen = 20
volumesurgefactor = 1.2 // Relaxed to 1.2 times the average volume
// === Technical Indicators ===
rsi = rsi(close, rsi_period)
change = close - close[1]
obv = cum((change > 0 ? 1 : change < 0 ? -1 : 0) * volume)
maobvshort = ma(obv, maobvshort_len)
maobvlong = ma(obv, maobvlong_len)
volumema = ma(volume, volumema_len)
// === RSI Area (Relaxed Threshold) ===
rsi_oversold = 35
rsi_overbought = 65
// === Volume Surge Determination (Relaxed Multiple) ===
volumesurge = volume > volumema * volumesurgefactor
// === OBV and Price Divergence (Shortened Lookback Period and Removed [1] Delay) ===
pricenewhigh = close > highest(close, div_lookback)
obvnotnewhigh = obv <= highest(obv, divlookback)
bearishdivergence = pricenewhigh and obvnotnewhigh
pricenewlow = close < lowest(close, div_lookback)
obvnotnewlow = obv >= lowest(obv, divlookback)
bullishdivergence = pricenewlow and obvnotnewlow
// === Signal Logic (Allow RSI or Divergence to Trigger) ===
buysetup = (rsi < rsioversold) or bullish_divergence
sellsetup = (rsi > rsioverbought) or bearish_divergence
isbuy = buysetup and crossup(obv, maobvshort) and volumesurge
issell = sellsetup and crossdown(obv, maobvshort) and volumesurge
// Auxiliary Signals: Short and Long OBV Moving Average Cross + RSI Filter
isbuyweak = crossup(maobvshort, maobvlong) and rsi < 45
issellweak = crossdown(maobvshort, maobvlong) and rsi > 55
// === Alerts ===
alertcondition(is_buy, title='RSI+OBV Buy', direction="buy")
alertcondition(is_sell, title='RSI+OBV Sell', direction="sell")
alertcondition(isbuyweak, title='OBV Golden Cross Confirmation', direction="buy")
alertcondition(issellweak, title='OBV Death Cross Confirmation', direction="sell")
// === Chart Text ===
plotText(is_buy, title="Buy", text='Buy', color='green', refSeries=low, placement='bottom')
plotText(is_sell, title="Sell", text='Sell', color='red', refSeries=high, placement='top')
plotText(isbuyweak, title="Golden Cross", text='Golden Cross', color='lightgreen', refSeries=low, placement='bottom')
plotText(issellweak, title="Death Cross", text='Death Cross', color='lightcoral', refSeries=high, placement='top')
// === Simple Trade Execution ===
exitShort(is_buy, price='market', amount=1)
enterLong(is_buy, price='market', amount=1)
exitLong(is_sell, price='market', amount=1)
enterShort(is_sell, price='market', amount=1)
# 5. Comprehensive Summary
1. Practical Application Tips:
In Trending Markets:
Strong signals perform best at the initial stage of trend initiation.
If OBV short-term golden/death crosses can be combined with RSI's overbought/oversold zones, they can more effectively capture trend reversal points.
Volume surge conditions are key to verifying the reliability of signals.
In Oscillating Markets:
During market consolidation, auxiliary signals will relatively increase, and should be treated with caution.
It is strongly recommended to combine candlestick patterns, support levels, and resistance levels for secondary confirmation to avoid invalid trades.
2. Risk Management Recommendations
All trade executions are recommended to be paired with strict stop-loss strategies to protect account safety.
Fixed Ratio Stop-Loss: Set a floating stop-loss of 5% to 10%, executed immediately after entry.
Structured Stop-Loss: Place stop-loss levels just outside the nearest key support levels (for buying) or resistance levels (for selling).
Dynamic Stop-Loss (Recommended): Dynamically adjust stop-loss positions in conjunction with the ATR (Average True Range) indicator to keep stop-loss in sync with market volatility.
From the actual trading results, the RSI+OBV multi-dimensional verification strategy can improve signal reliability and capture trend reversals through multi-dimensional verification. However, in oscillating markets, due to the potential for many auxiliary signals, it is recommended to combine with other indicators (such as candlestick patterns, support, and resistance levels) for comprehensive analysis, further enhancing signal reliability and win rate, making it more suitable for medium to short-term trend traders.
Join our community to discuss and become stronger together!
Official Telegram Community: t.me/aicoincn
AiCoin Chinese Twitter: https://x.com/AiCoinzh
Group Chat - Wealth Group: https://www.aicoin.com/link/chat?cid=10013
免责声明:本文章仅代表作者个人观点,不代表本平台的立场和观点。本文章仅供信息分享,不构成对任何人的任何投资建议。用户与作者之间的任何争议,与本平台无关。如网页中刊载的文章或图片涉及侵权,请提供相关的权利证明和身份证明发送邮件到support@aicoin.com,本平台相关工作人员将会进行核查。