Have you ever lost your direction in the market? Are you troubled by lagging signals and false breakouts?
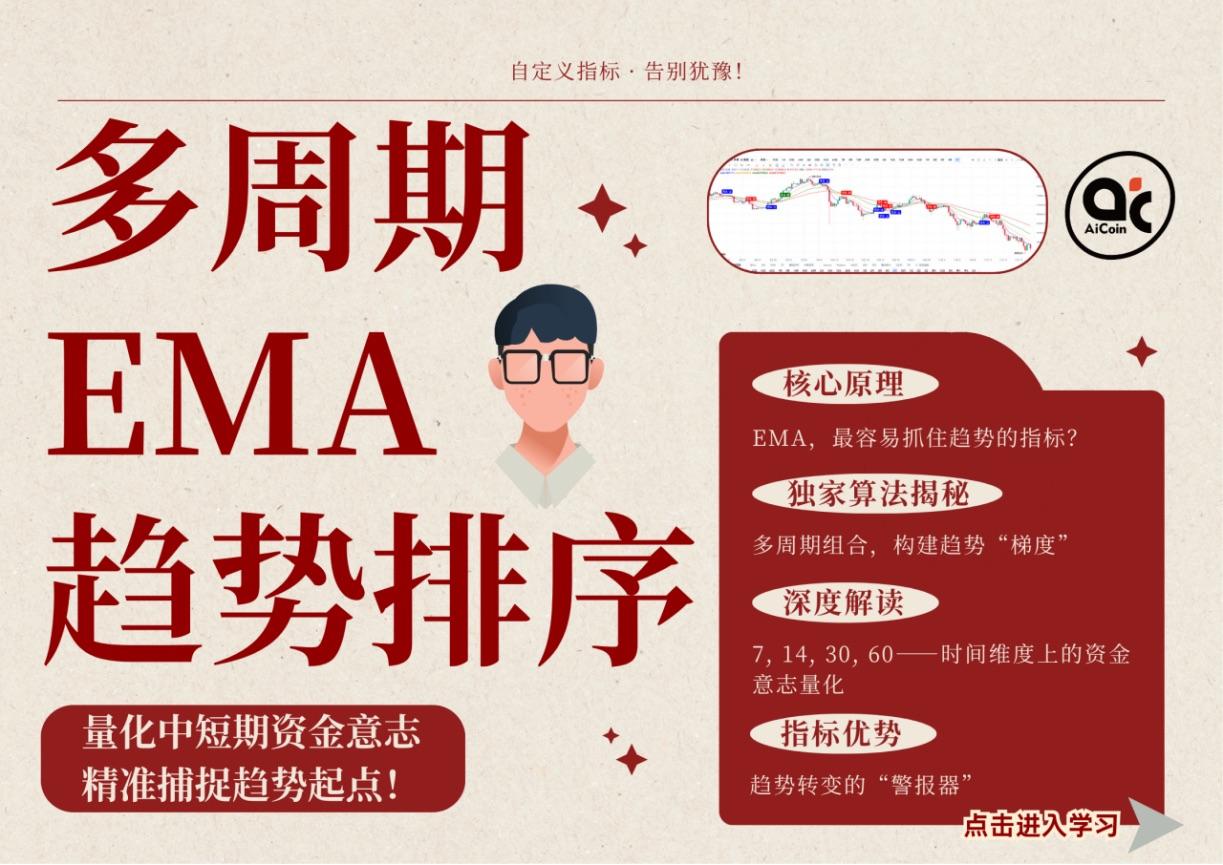
We bring you a deeply optimized trend tool—【Multi-Period EMA Trend Ranking Indicator】. It is not just an indicator, but a decision-making system for quantifying short to medium-term capital flows, designed to help you capture the strongest and healthiest moments to start a trend!

I. Core Principle: EMA, the Easiest Indicator to Capture Trends?
Exponential Moving Average (EMA) is the foundation of technical analysis because it has two irreplaceable characteristics:
High Sensitivity: EMA gives more weight to recent prices, allowing it to reflect the latest market changes more quickly and effectively reduce signal lag.
Effective Smoothing: It filters out short-term random noise, helping us focus on the true direction of price movement, laying a solid foundation for trend judgment.
However, a single EMA can be misleading. Our indicator addresses this core pain point through multi-period combinations.
II. Exclusive Algorithm Reveal: Multi-Period Combination, Building Trend "Gradients"
The essence of our indicator algorithm is: we only confirm a trend when the average cost lines of different periods are perfectly aligned. This ensures the reliability of signals and eliminates consolidation and weak fluctuations.
📊 Strict Judgment Logic:
🟢 Bullish Arrangement: EMA7 > EMA14 > EMA30 > EMA60
This means that the average cost of all funds from ultra-short to medium-term is sequentially rising, indicating the market has the most perfect, upward, multi-layered momentum.
🔴 Bearish Arrangement: EMA7 < EMA14 < EMA30 < EMA60
This means that the average cost of all periods is sequentially declining, indicating the market is under the most solid, downward, continuously releasing selling pressure.
Value Proposition: This detection of four-period ranking greatly enhances the purity and reliability of signals, allowing you to participate only in the clearest trend markets.
III. In-Depth Interpretation: 7, 14, 30, 60—Quantifying Capital Intent Across Time Dimensions
The choice of parameters is the soul of our indicator. This set of numbers is not random; they construct a complete observation system from short to long on the time axis, aiming to cover and reflect all active short to medium-term capital behaviors in the market.

Core Conclusion: Our signals only activate when all capital from 7 days to 60 days aligns in the same direction. This indicator is quantifying the intent of all short to medium-term capital for you!
IV. Indicator Advantages: The "Alarm" for Trend Changes
Compared to traditional simple arrangement detection, our indicator focuses more on the "change" of trends, providing you with clear entry and exit points.

Let your trading decisions say goodbye to "feelings" and "guesses," and only follow the guidance of bullish and bearish signals!
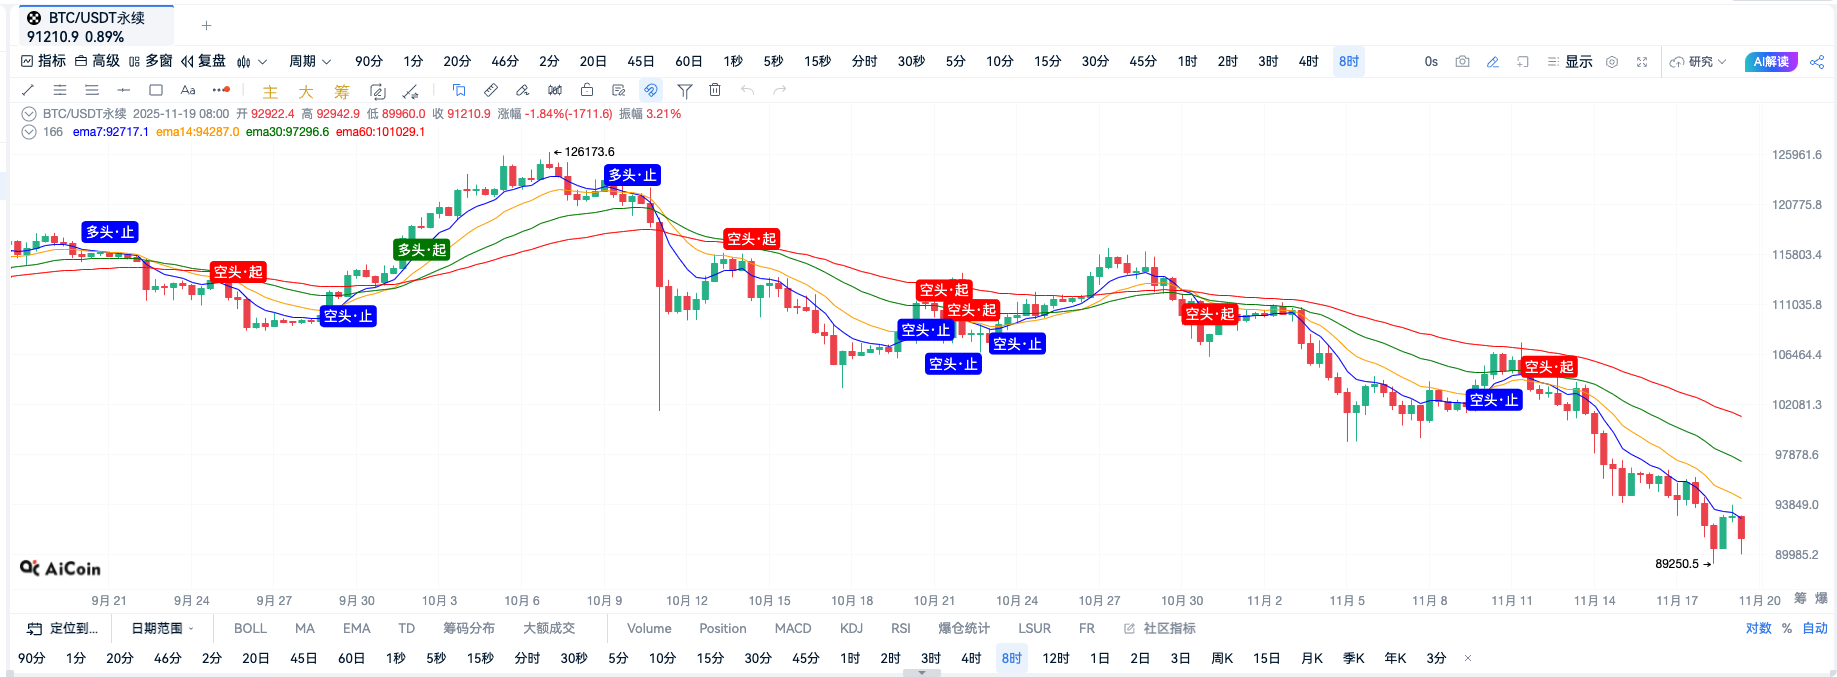
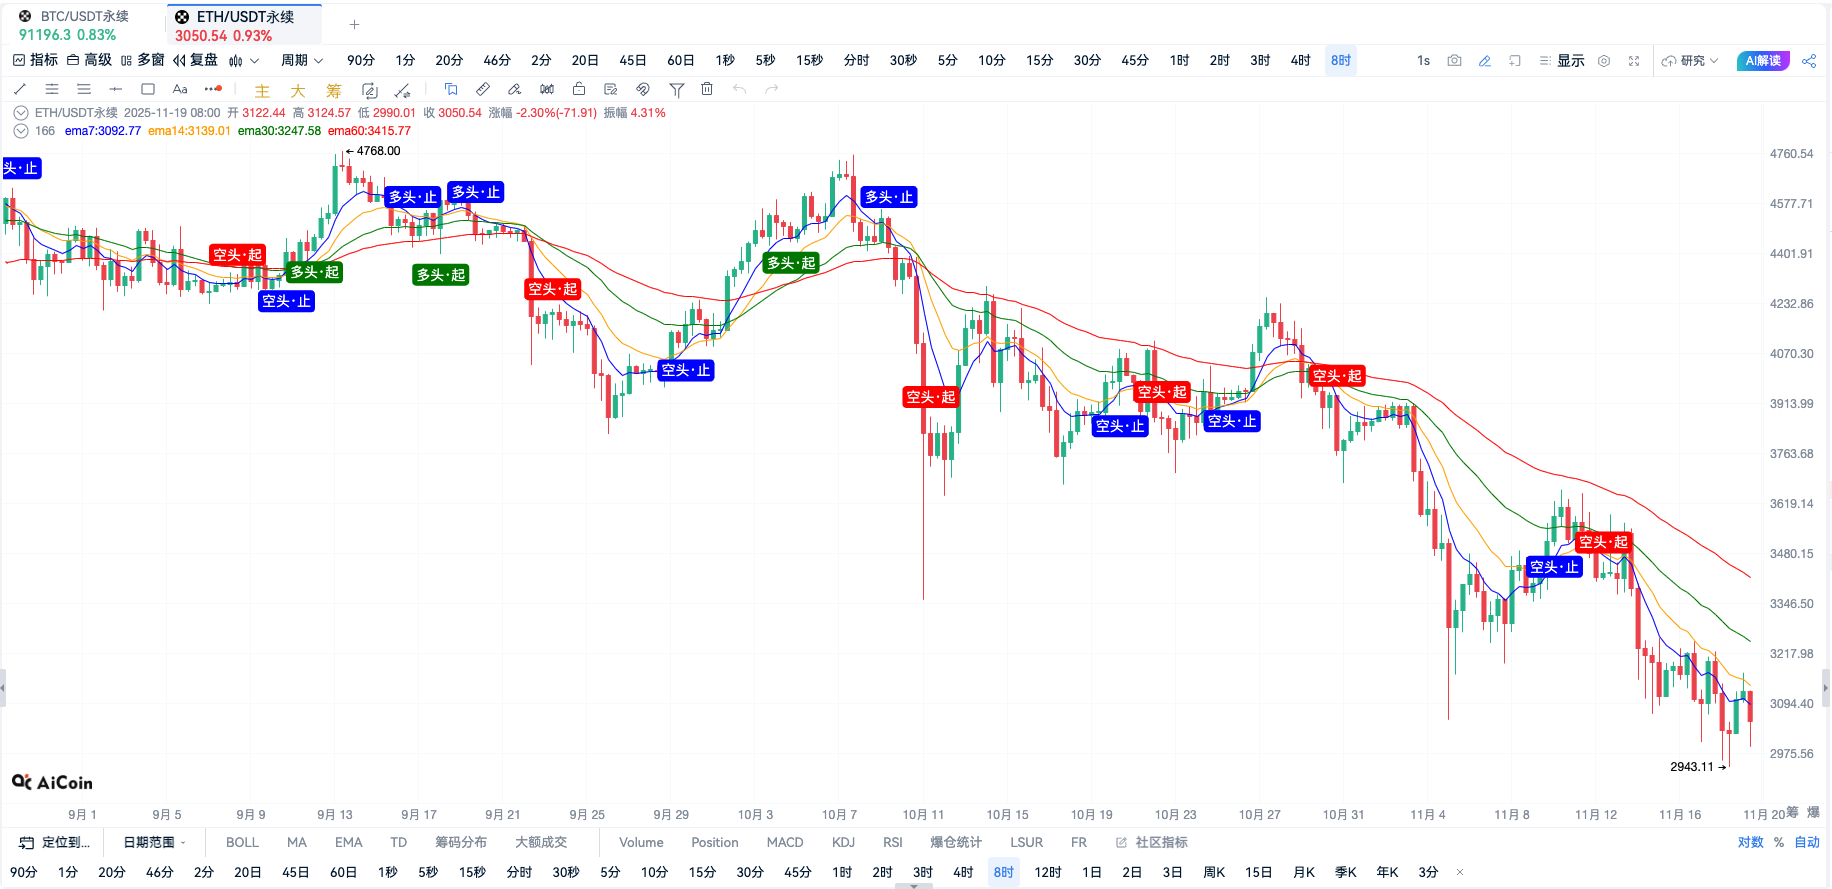
V. Custom Indicator · Signal Effect

(Chart OKX-BTCUSDT Perpetual Contract 8-Hour Period)

(Chart OKX-ETHUSDT Perpetual Contract 8-Hour Period)
VI. Custom Indicator · Script Source Code
// @version=2
// Calculate the values of different period EMAs
ema7 = ema(close, 7);
ema14 = ema(close, 14);
ema30 = ema(close, 30);
ema60 = ema(close, 60);
// Calculate conditions for bullish and bearish arrangements
bullish = ema7 > ema14 and ema14 > ema30 and ema30 > ema60;
bearish = ema7 < ema14 and ema14 < ema30 and ema30 < ema60;
// Detect transitions between bullish and bearish arrangements
bullishStart = bullish and not bullish[1];
bearishStart = bearish and not bearish[1];
bullishEnd = not bullish and bullish[1];
bearishEnd = not bearish and bearish[1];
// Create alerts
alertcondition(bullishStart, title='Bullish Start', direction='buy');
alertcondition(bearishStart, title='Bearish Start', direction='sell');
alertcondition(bullishEnd, title='Bullish End', direction='sell');
alertcondition(bearishEnd, title='Bearish End', direction='buy');
// Plot on chart
plot(ema7, title='ema7', color='blue');
plot(ema14, title='ema14', color='orange');
plot(ema30, title='ema30', color='green');
plot(ema60, title='ema60', color='red');
plotText(bullishStart, title='Bullish', text = 'Bullish·Start', refSeries = low, bgColor='green', color='white', fontSize=14, placement='bottom' ,display=true);
plotText(bullishEnd, title='Close Long', text = 'Bullish·Stop', refSeries = high, bgColor='blue', color='white', fontSize=14, placement='top' ,display=true);
plotText(bearishStart, title='Bearish', text = 'Bearish·Start', refSeries = high, bgColor='red', color='white', fontSize=14, placement='top' ,display=true);
plotText(bearishEnd, title='Close Short', text = 'Bearish·Stop', refSeries = low, bgColor='blue', color='white', fontSize=14, placement='bottom' ,display=true);
// Create trading strategy
// Close/Open Long for Bullish Arrangement
exitLongPercent(bullishEnd, id = 'bullishEnd', price='market', percent=100)
enterLongPercent(bullishStart, id = 'bullishStart', price='market', percent=10)
// Close/Open Short for Bearish Arrangement
exitShortPercent(bearishEnd, id = 'bearishEnd', price='market', percent=100)
enterShortPercent(bearishStart, id = 'bearishStart', price='market', percent=10)
VII. Summary: A Simple, Stable, and Efficient Trend Tool!
【Multi-Period EMA Trend Ranking Indicator】 is not only a crystallization of technology but also a profound insight into market capital behavior.
✅ Noise Elimination: Four-period filtering captures only the healthiest trends.
✅ Precise Periods: 7, 14, 30, 60 cover short to medium-term capital operations.
✅ Clear Instructions: Bullish/Bearish signals eliminate hesitation in entry and exit.
Opportunities are fleeting! Experience this trend indicator that transforms complex principles into simple instructions, allowing you to easily navigate market trends!
Join our community to discuss and grow stronger together!
Official Telegram community: t.me/aicoincn
AiCoin Chinese Twitter: https://x.com/AiCoinzh
Group Chat - Wealth Group:
https://www.aicoin.com/link/chat?cid=10013
免责声明:本文章仅代表作者个人观点,不代表本平台的立场和观点。本文章仅供信息分享,不构成对任何人的任何投资建议。用户与作者之间的任何争议,与本平台无关。如网页中刊载的文章或图片涉及侵权,请提供相关的权利证明和身份证明发送邮件到support@aicoin.com,本平台相关工作人员将会进行核查。


