Original Title: Below the Band
Original Authors: Chris Beamish, CryptoVizArt, Antoine Colpaert, GlassnodeOriginal Compilation: Jinse Finance
Key Points of the Article:
• Bitcoin has fallen below the STH (short-term holder) cost basis and the -1 STD (standard deviation) range, putting pressure on recent buyers; the $95,000 to $97,000 area has now become a key resistance level. If this area can be reclaimed, it will mark an early step in the recovery of market structure.
• Spot demand remains weak, with significant negative inflows into U.S. spot ETFs, and TradFi asset allocators have not increased any buying.
• Speculative leverage continues to decline, reflected in the decrease of open interest in the top 500 assets and financing rates dropping to cycle lows.
• The options market has significantly repriced risk, with implied volatility rising across various maturities, and skew remaining low as traders pay high premiums for downside protection.
• The liquidity and demand dominated by key strike prices (e.g., 90K) reinforce defensive positioning strategies, with traders more actively hedging rather than increasing upside risk exposure.
• DVOL has returned to monthly highs, linking the broad repricing of risks such as volatility, skew, and flow indicators, and signaling expectations of increased volatility in the near term.
Bitcoin has broken below the previous consolidation range, falling below $97,000 and briefly touching $89,000, creating a new local low and turning its year-to-date gains negative. This deeper decline continues the mild bear market trend we emphasized last week and raises questions about the potential re-emergence of structural support. In this issue, we will use on-chain pricing models and the loss realization of short-term holders to assess the market's reaction to this decline. We will then analyze options, ETF fund flows, and futures positions to evaluate how speculators are adjusting their sentiment in this new round of weakness.
On-Chain Insights
Breaking the Lower Bound
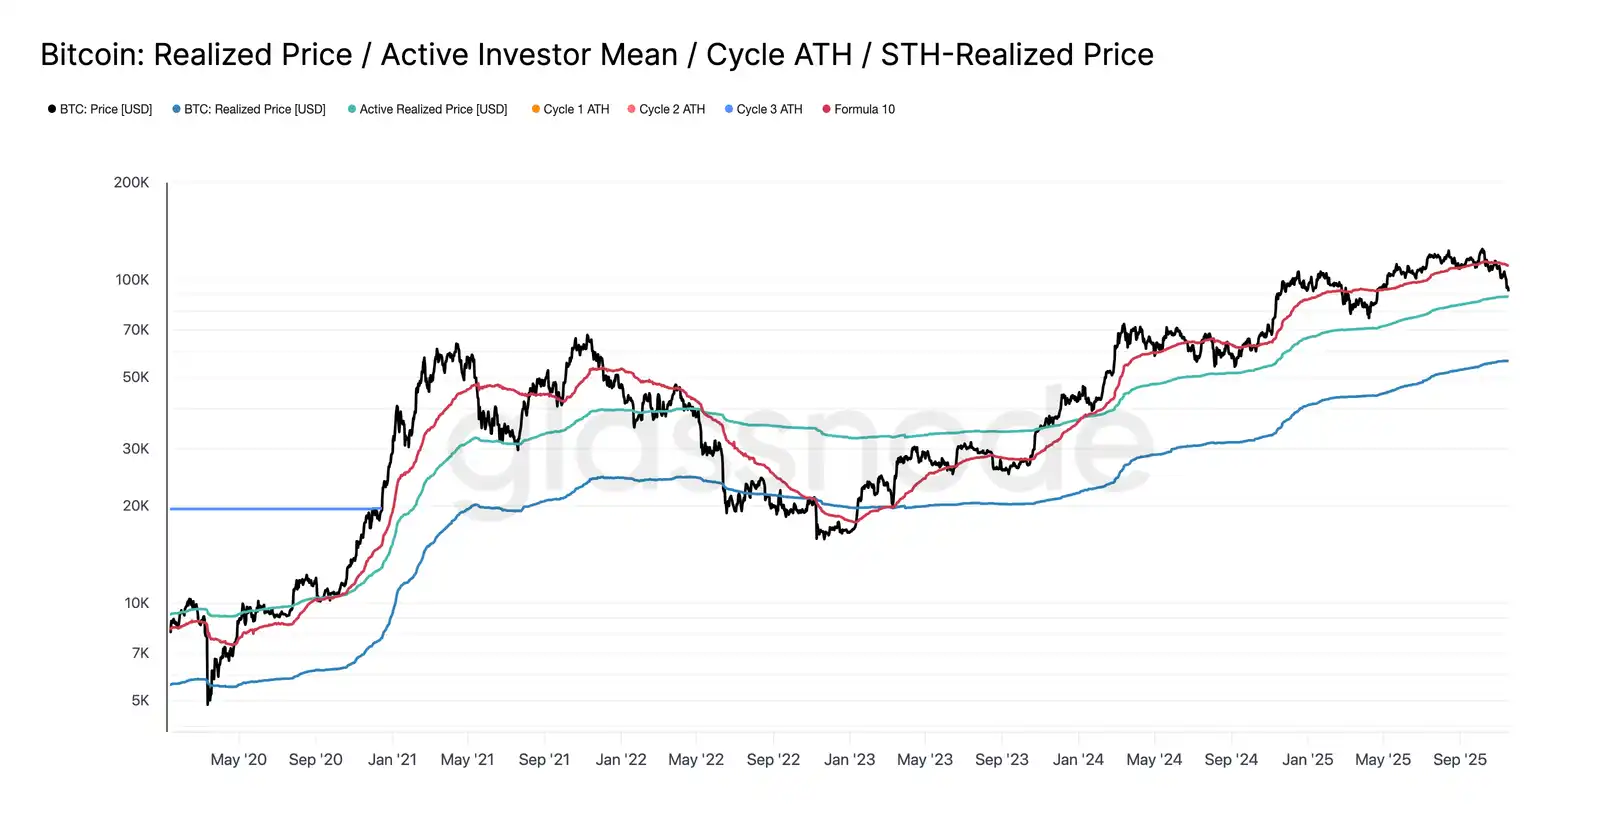
Falling below $97,000, the lower limit of last week's "consolidation range," signals the risk of a deeper pullback. The price then plummeted to $89,000, forming a new local low, below the -1 standard deviation level relative to the short-term holder cost basis (currently around $109,500).
This decline confirms that almost all investor groups have incurred losses recently, a structure that historically triggers panic selling and weakens market momentum, requiring time to recover. In the short term, the $95,000 to $97,000 range may constitute local resistance; if the price can reclaim this range, it indicates that the market is gradually restoring balance.

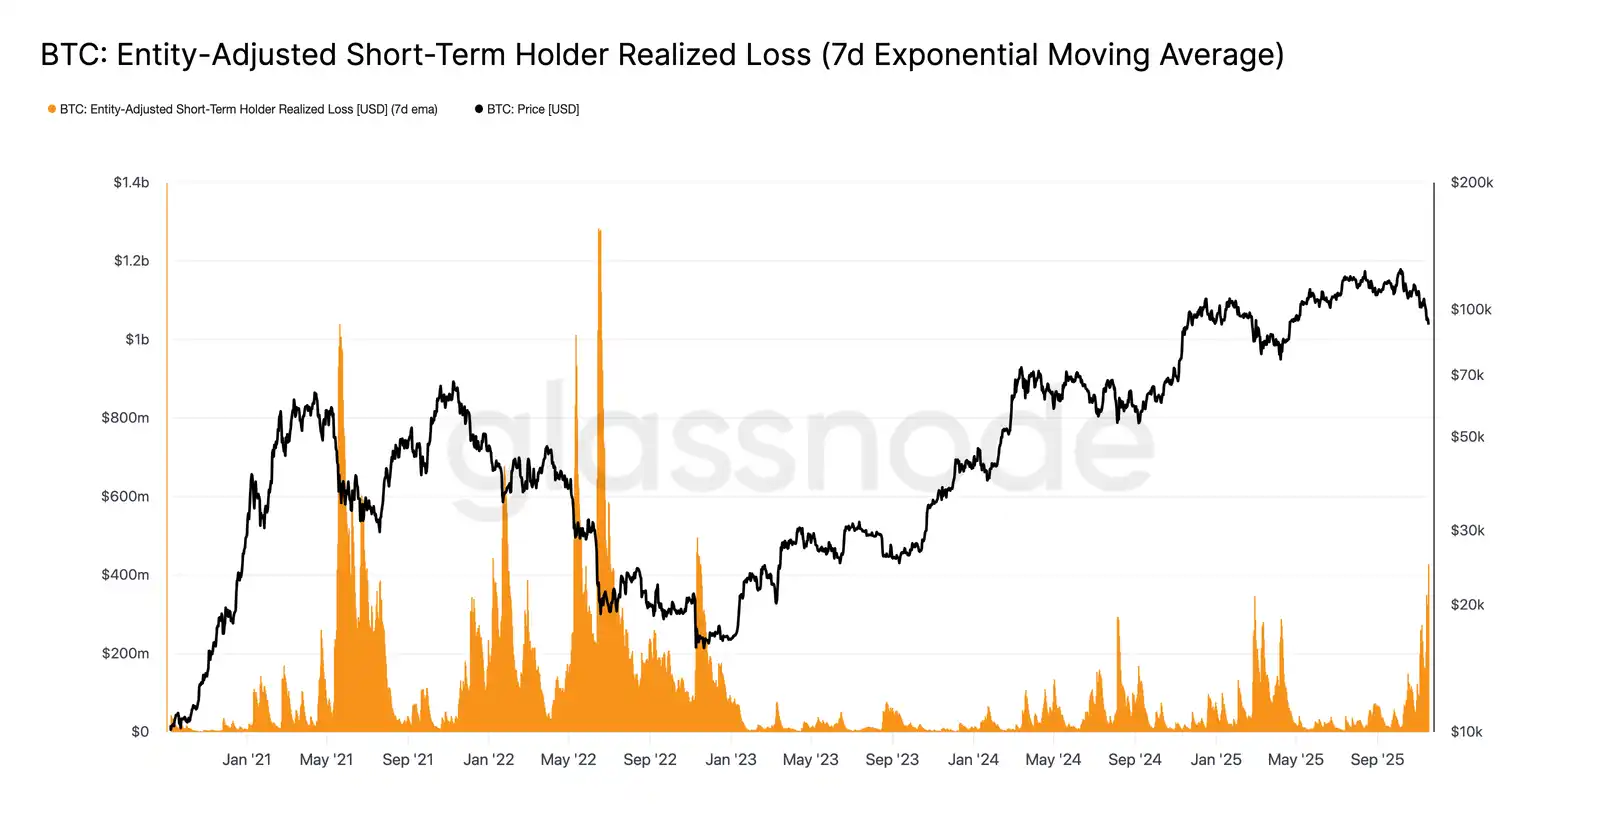
Panic Selling Peaks
From investor behavior, this crash marks the third time since early 2024 that the price has fallen below the short-term holder cost basis model's lower limit. However, the level of panic among top buyers is noticeably higher this time. The 7-day moving average of realized losses for STH has surged to $523 million daily, the highest level since the FTX collapse.
Such high realized losses highlight a heavier top structure formed between $106,000 and $118,000, with a density far exceeding previous cycle peaks. This means that either stronger demand is needed to absorb the sold BTC, or the market must undergo a longer and deeper accumulation phase to restore balance.
Testing Active Demand
Revisiting valuation models, the market has currently entered uncharted territory, with speculative interest significantly increasing during this mild bear market phase. The first major defensive area is at the Active Investors' Realized Price, currently around $88,600. The trading price of Bitcoin near this level corresponds to the cost basis of non-sleeping holders who have actively traded in recent months, making it a potential mid-term trading range.
However, if the price decisively falls below this model, it would mark the first time in this cycle that prices have dropped below the cost basis of active investors, clearly indicating that bearish momentum is dominating the market.
Another Form of Retreat
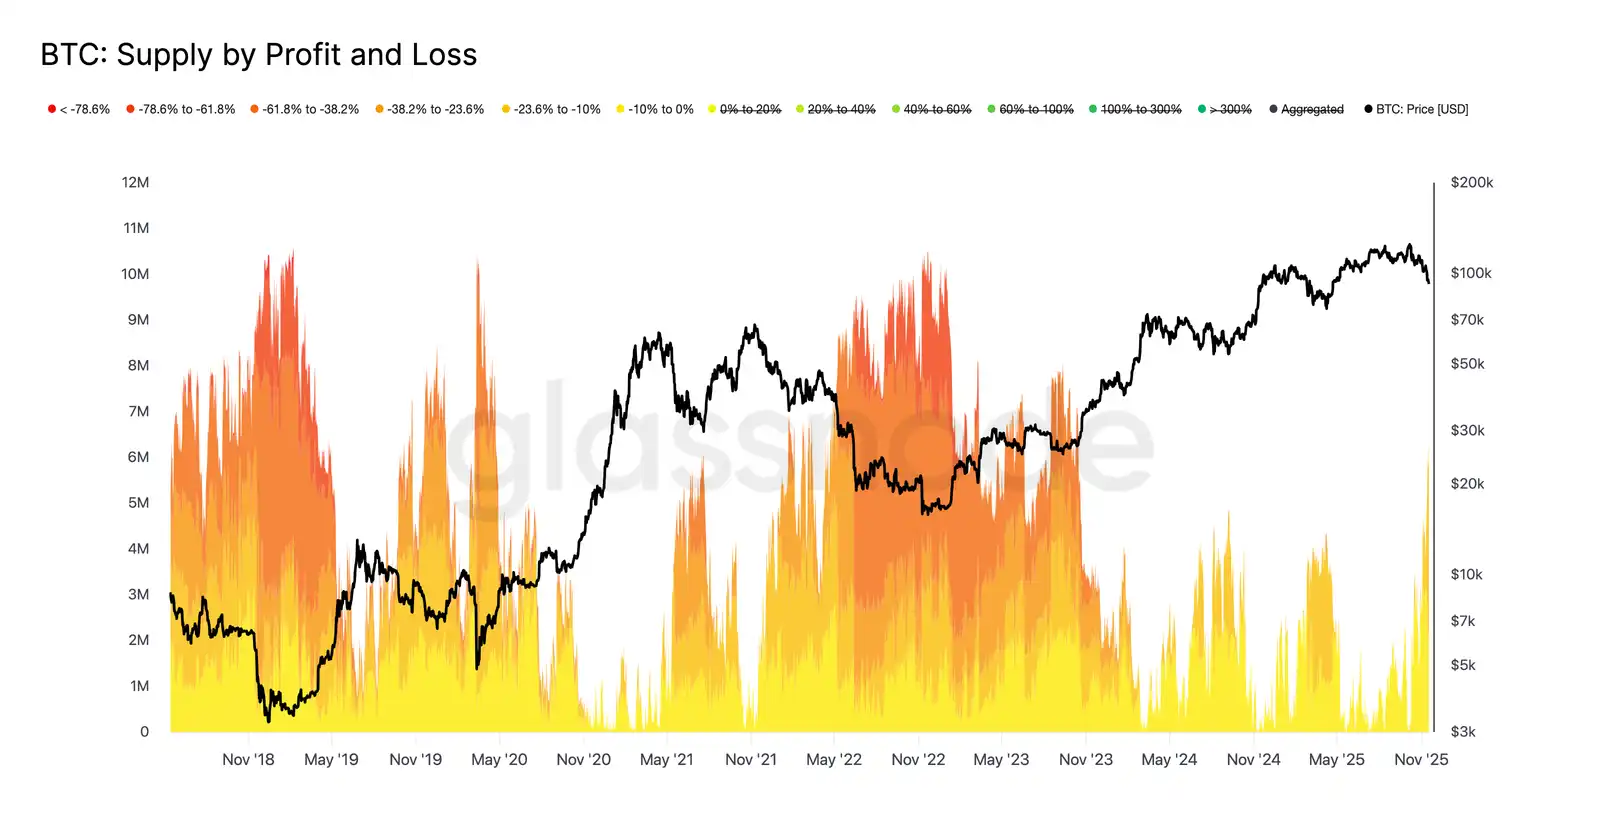
Although Bitcoin's price has fallen below the main lower limit of the short-term holder cost basis model, the scale and extent of losses suffered by investors are far less extreme than during the 2022-2023 bear market. The following chart tracks all currently loss-making cryptocurrencies, grouped by the depth of their unrealized drawdowns. Currently, about 6.3 million Bitcoins are in a loss state, with most losses ranging from -10% to -23.6%.
This distribution is more akin to the brief range-bound market of Q1 2022 rather than a deep capitulation phase.
Thus, the price range between the Active Investors' Realized Price ($88,600) and the true market average ($82,000) may serve as a boundary distinguishing the mild bear market phase from the comprehensive bear market structure similar to 2022-2023.
Off-Chain Insights
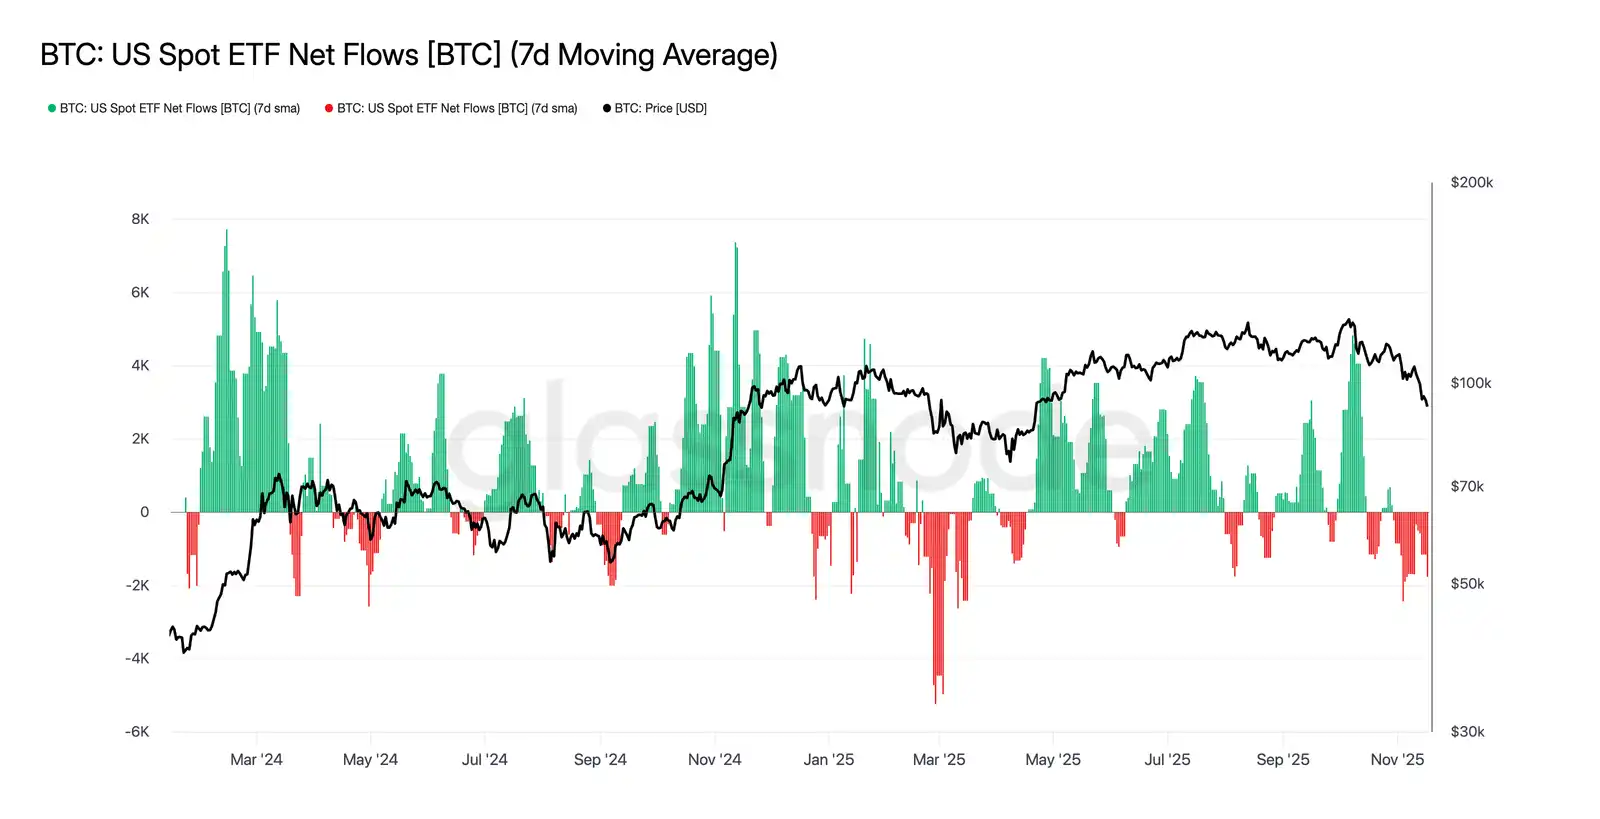
Insufficient ETF Demand
The flow of U.S. spot ETF funds continues to reflect a clear lack of demand, with the 7-day average remaining negative in recent weeks. Ongoing outflows indicate that traditional financial asset allocators are unwilling to increase their holdings in the current downtrend, contrasting sharply with the strong inflow patterns that previously supported market rises. The continued weakness suggests that non-discretionary investment demand has significantly cooled, highlighting the lack of new buying from one of the market's largest marginal buyer groups, further reinforcing the overall constrained demand situation. The absence of sustained inflows into ETFs indicates that a crucial demand pillar has yet to recover, leading to a lack of key demand sources in this cycle's market.
No Signs of Risk
This week's open interest in futures has continued to decline, falling in tandem with prices, indicating a sustained reduction in speculative activity. Traders are not buying the dip but are systematically closing positions, resulting in derivative market positions being significantly lower than previous downturn levels. This lack of leverage expansion underscores the cautious attitude of market participants and aligns with the broader trend of weakened demand from risk-seeking groups.
The ongoing contraction of futures positions highlights that the market remains unwilling to deploy capital, further exacerbating the lack of confidence behind the current price movements.
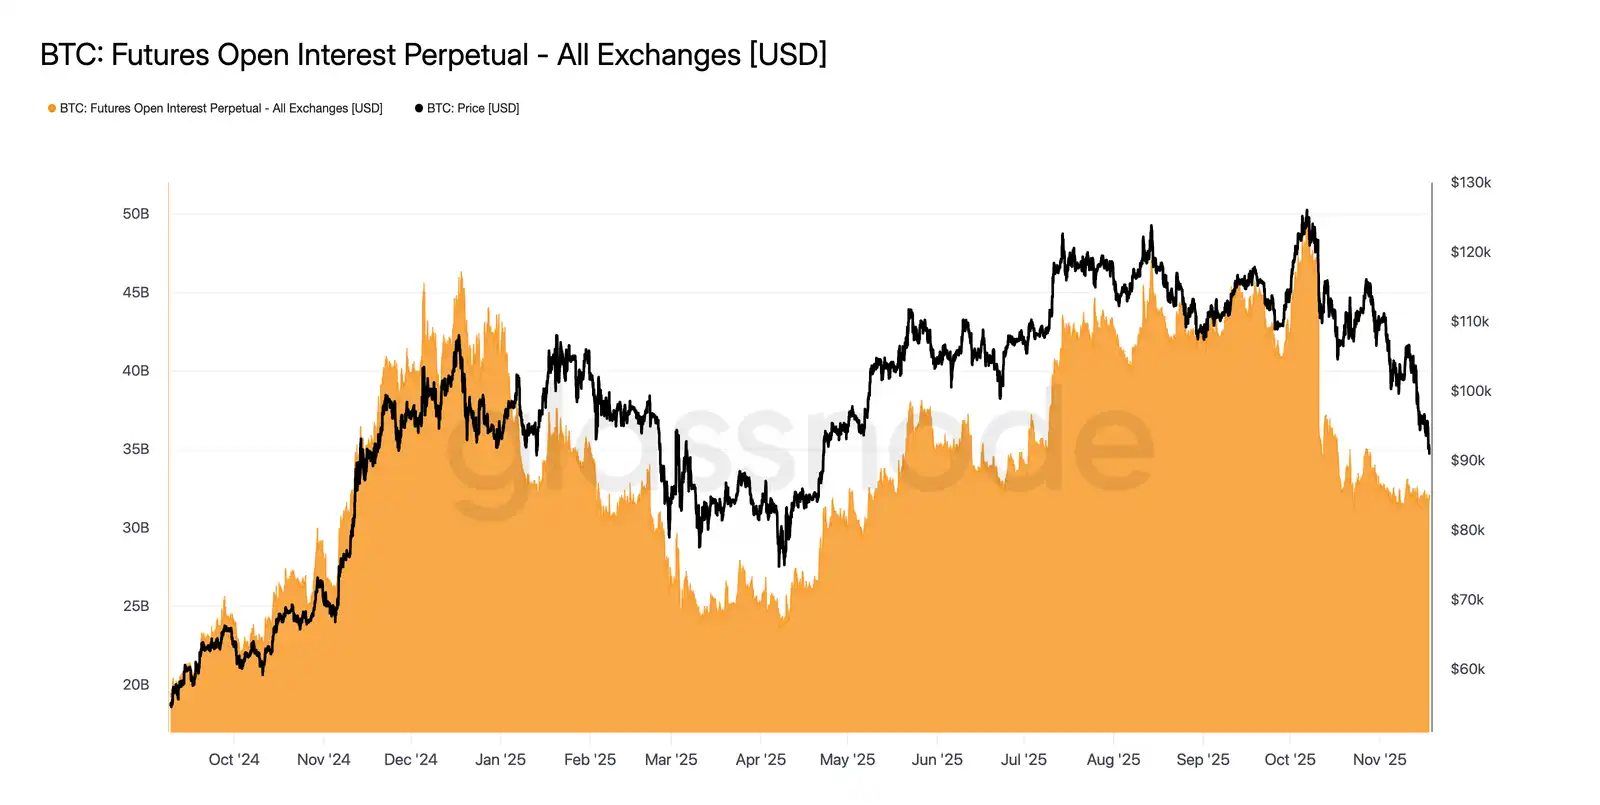
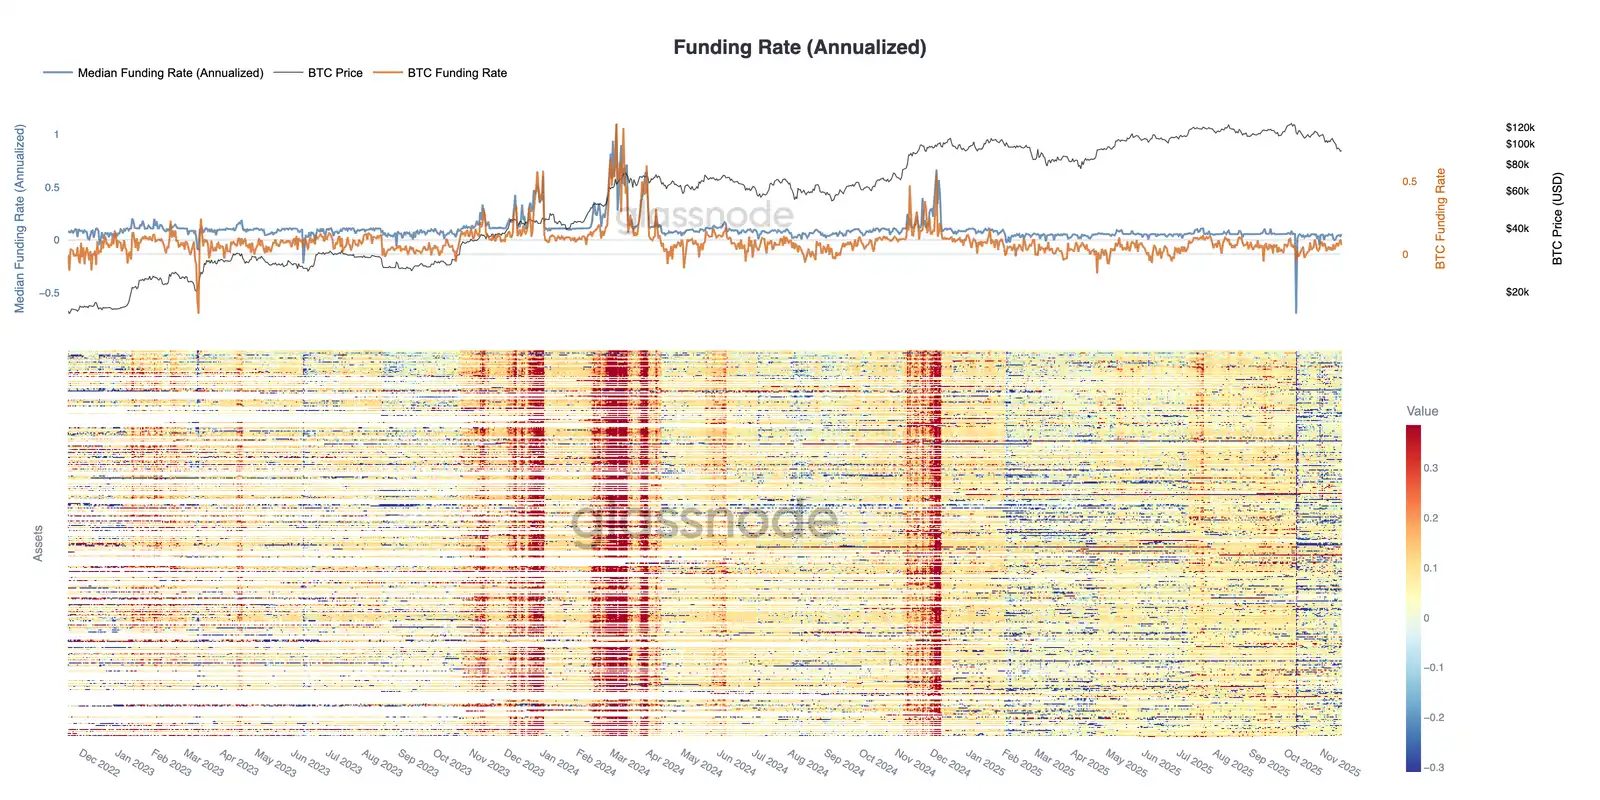
Financing Rates at Cycle Lows
As open interest in futures continues to decline, the derivatives market signals a significant reduction in speculative positions. Traders are closing positions rather than buying the dip, leading to leverage in open interest being significantly lower than previous downturn levels.
This dynamic is also reflected in the financing market, where the rates for the top 500 assets have clearly shifted to neutral or even negative ranges. Previously observed positive premiums have now turned negative, highlighting the widespread cooling of leveraged long demand and the market's shift towards more defensive strategies.
The decline in open interest and negative financing together confirm that speculative leverage is being systematically withdrawn from the market, reinforcing risk-averse sentiment.
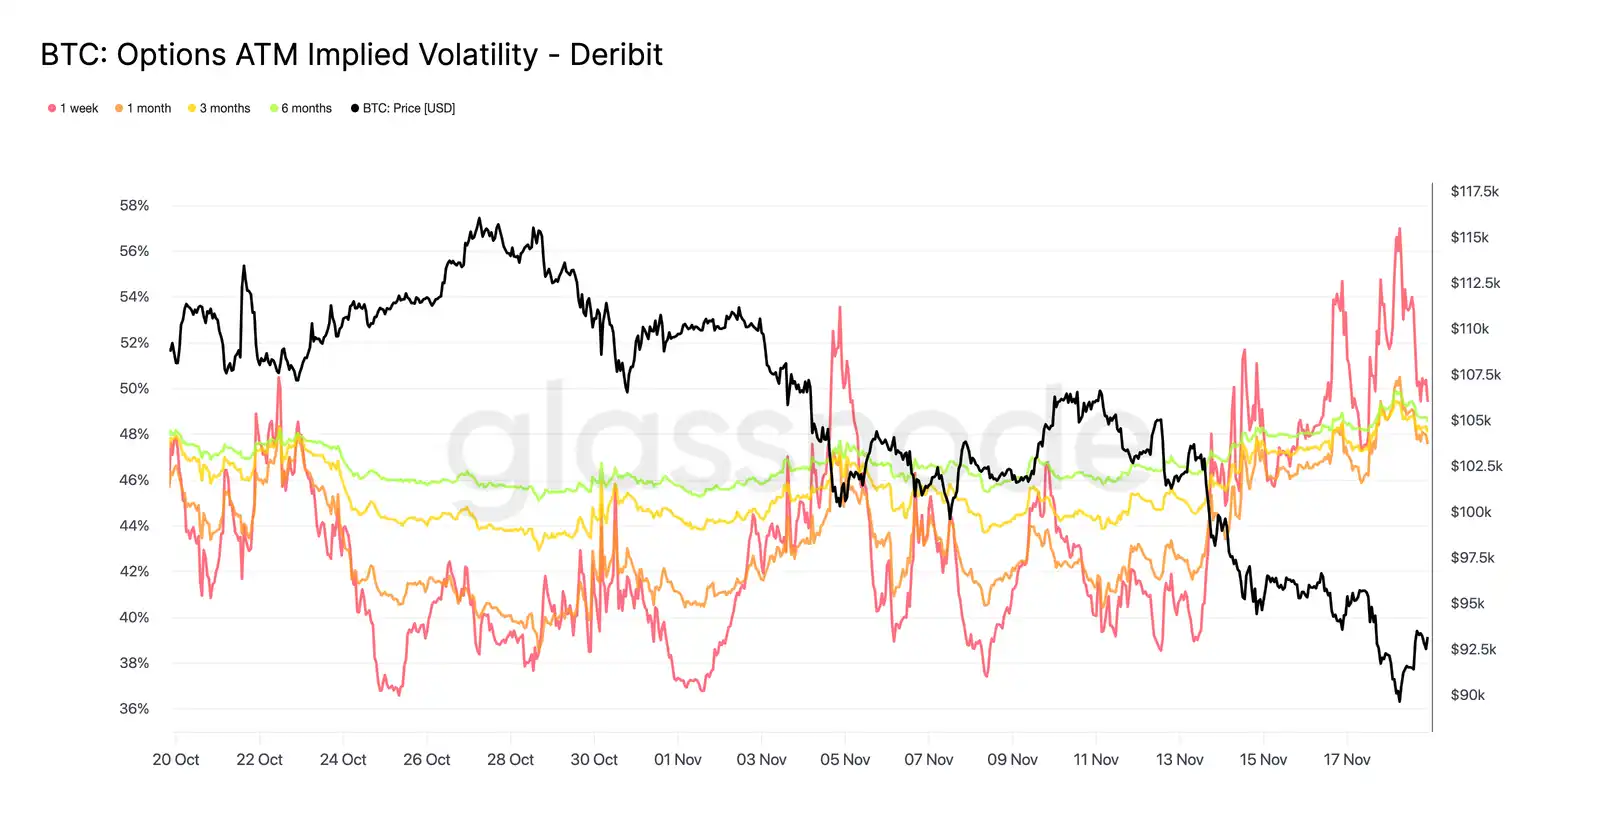
Implied Volatility Surges
The options market is typically the first to reprice risk, and after Bitcoin's price briefly fell below $90,000, the options market quickly completed its risk reassessment. Implied volatility across all maturities has risen sharply, with the near-term options reacting most strongly. The chart shows that the volatility of short-term options has significantly increased, with widespread repricing occurring across the entire options curve.
This increase reflects two driving factors. First, there is heightened demand for downside protection as traders prepare for potentially larger pullbacks. Second, the response from the short gamma trading sector. Many traders have had to buy back short options and roll positions upward, mechanically pushing up near-term implied volatility.
Implied volatility is currently close to the levels seen during the October 11 liquidation event, indicating that traders have rapidly reassessed recent risks.
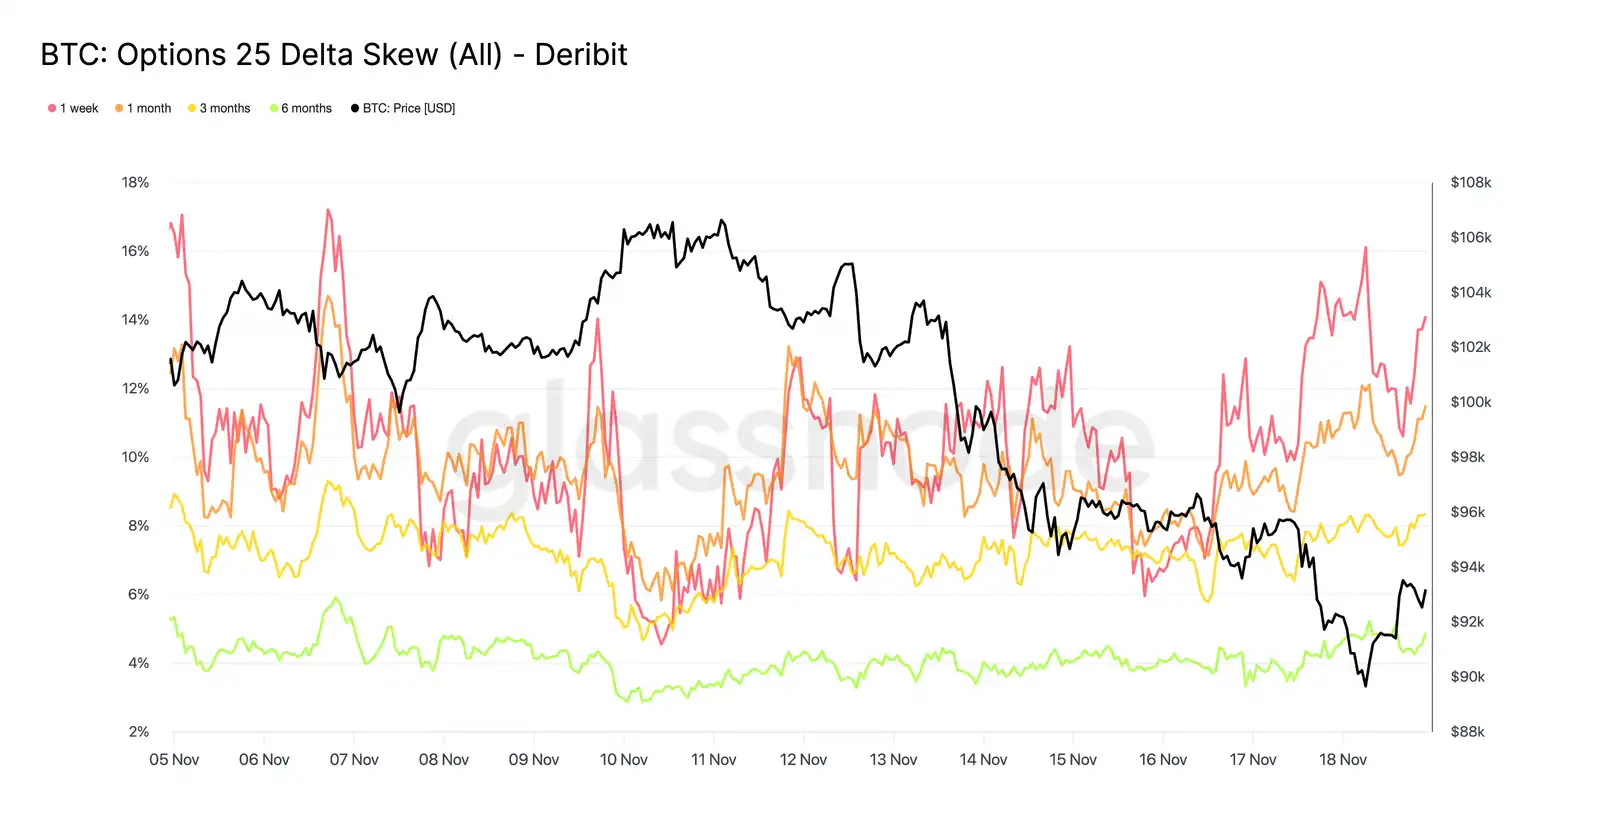
This Deviation Confirms Concerns
Shifting from implied volatility to skew, the options market conveys the same message. The 25-delta skew remains negative across all maturities, with the skew for one maturity approaching extremely bearish levels. The premium for one-week put options is about 14%, indicating that regardless of spot prices, traders are willing to pay higher prices for downside protection.
This behavior can create a self-fulfilling prophecy. When traders buy these put options, dealers often end up holding short positions. To hedge this risk, they sell futures or perpetual contracts. This selling behavior increases market pressure and may amplify the weakness that traders are trying to avoid.
The yield curve for long-term bonds is also skewed bearish, but to a lesser extent. The yield curve for six-month bonds is slightly below 5%, indicating that market concerns are primarily focused on short-term bonds rather than across the entire maturity range.
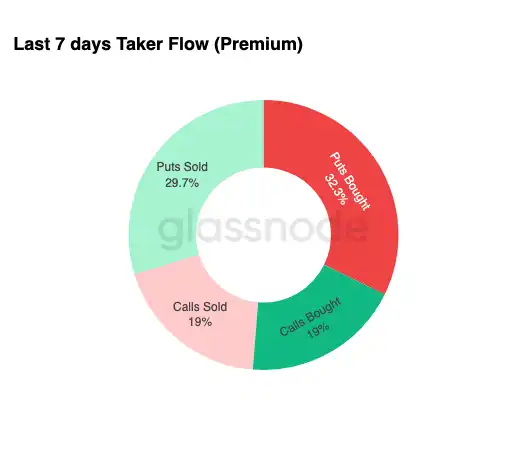
Demand for Downside Protection
From market deviations to actual trading activity, the trading flow over the past seven days also corroborates the same pattern. Traders have purchased a large amount of put option premiums, far exceeding the demand for call options. This aligns with hedging behavior, reflecting that traders are more inclined to guard against further market declines rather than betting on market rises.
The sluggish trading activity in call options further confirms that traders have not increased significant risk exposure ahead of the year-end. Compared to the liquidity of put options, both the buying and selling volumes of call options remain low, supporting the view that caution rather than speculation is driving position changes.
Overall, this combination indicates that the market is preparing for volatility and is more inclined towards protection rather than risk-taking.
90K Strike Price Option Premium
Continuing the overall fund flow data, the put option premium at the 90K strike price shows that protective demand is accelerating as prices weaken. Over the past two weeks, the net put option premium at this strike price remained relatively balanced until Bitcoin fell below the $93,000 mark. Once it broke this level, traders increased their selling of these put options, leading to a significant rise in the premium for the 90K strike price options.
This behavior indicates that as spot pressure intensifies, traders are willing to pay increasingly higher prices for downside protection. This move also aligns with the previous rise in short-term implied volatility, as concentrated demand at key strike prices typically drives up the prices of near-term contracts on the curve.
The sharp repricing of the 90K put options highlights how quickly downside hedging activity accelerates when key price levels are breached.

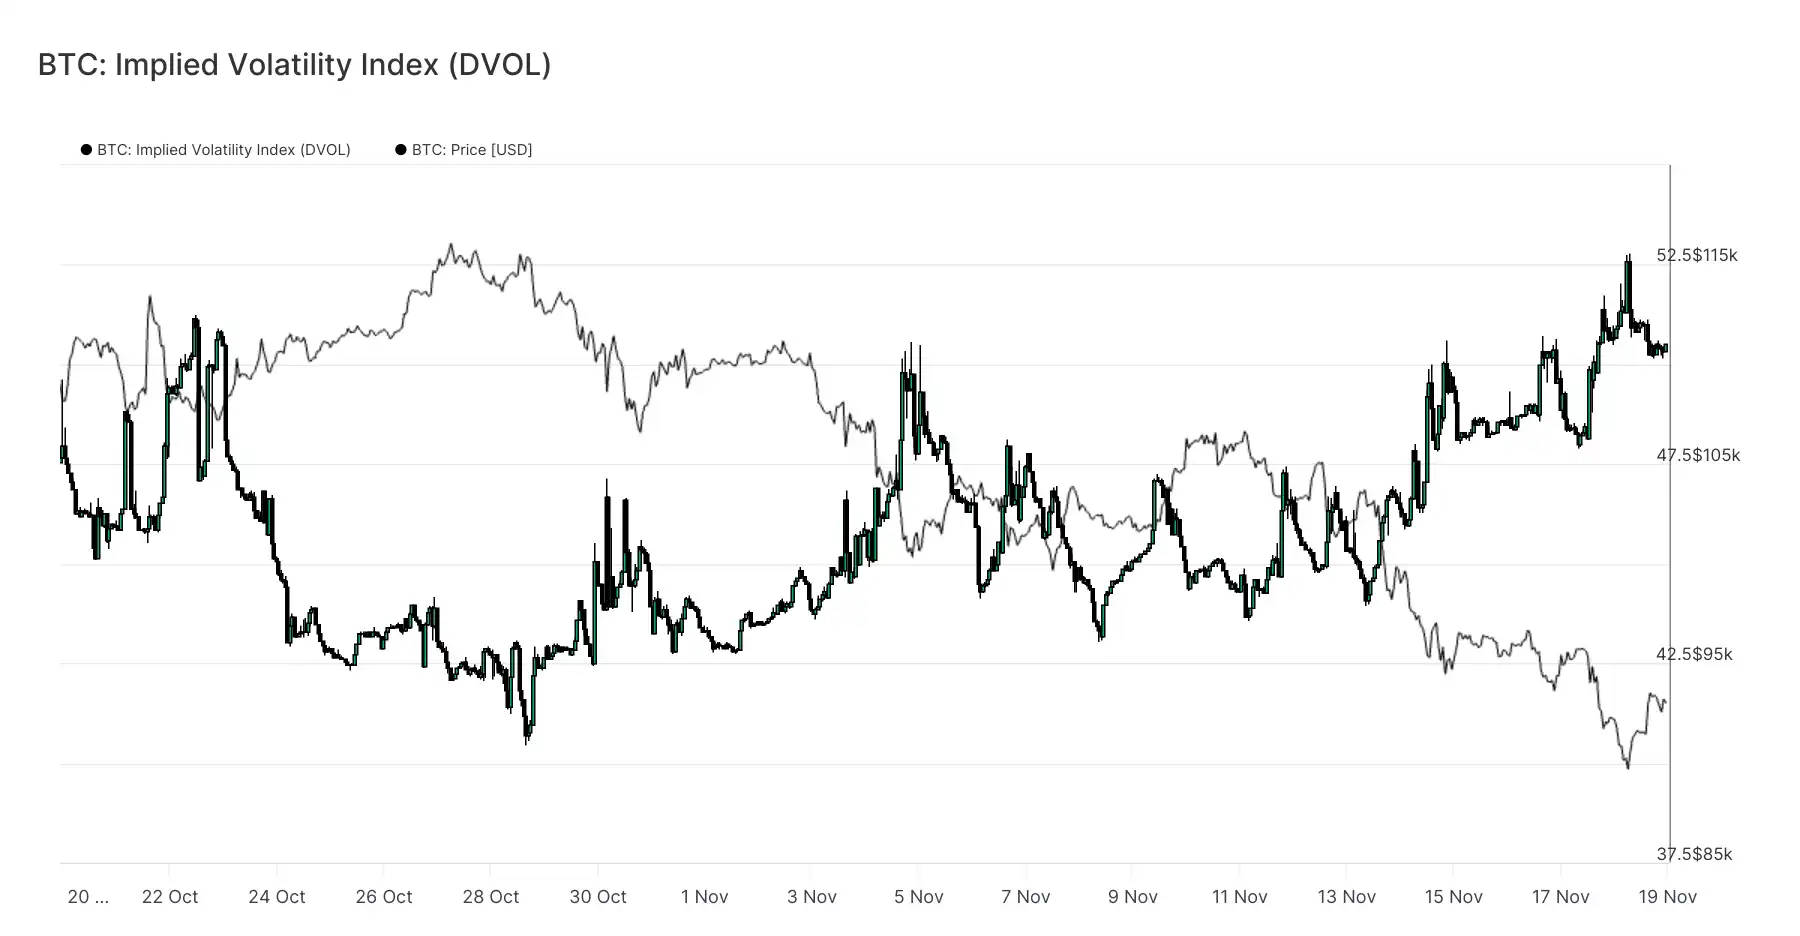
Pricing Market Vulnerability
The DVOL index shifts from individual option prices to broader volatility indicators, reflecting the extent of the market's repricing of risk. After nearing 40 three weeks ago, the DVOL index has rebounded to close to 50, a monthly high. DVOL reflects the implied volatility of a basket of fixed-maturity options, so when the DVOL index rises, it indicates that traders expect greater price fluctuations in the future.
This increase connects the overall trend in the options market. Implied volatility across all maturities is rising, skew remains negative, recent fund inflows have a negative delta, and traders seem unwilling to increase risk ahead of year-end. These factors collectively suggest that the market is preparing for significant price volatility. Key driving factors include the liquidation risk of perpetual contracts, macroeconomic uncertainty, and weak spot demand due to ETF fund inflows.
The next event that could change this volatility pattern is the Federal Open Market Committee (FOMC) meeting in three weeks. Until then, the options market will continue to emit cautious signals, clearly indicating a preference for hedging.
The rise in DVOL further confirms that the market is digesting expectations of greater future volatility, with traders preparing for market fluctuations.
Conclusion
Bitcoin continues to experience a challenging market phase characterized by weak market structure, shrinking speculative demand, and a significant increase in risk-averse sentiment in the derivatives market.
Spot demand remains sluggish, ETF fund inflows are negative, and the futures market shows no intention of increasing leverage in a weak state.
Meanwhile, implied volatility, skew, and hedging fund flows all indicate that investors' concerns about recent downside risks are intensifying, and they are paying increasingly higher premiums for protection.
All these factors together create a market seeking stability, with its future direction depending on whether demand can re-emerge near key cost levels or if the current vulnerability will evolve into a deeper adjustment or bear market.
免责声明:本文章仅代表作者个人观点,不代表本平台的立场和观点。本文章仅供信息分享,不构成对任何人的任何投资建议。用户与作者之间的任何争议,与本平台无关。如网页中刊载的文章或图片涉及侵权,请提供相关的权利证明和身份证明发送邮件到support@aicoin.com,本平台相关工作人员将会进行核查。


