Last night, my personal prediction was that the market would first test support before starting a rebound. After the U.S. stock market opened in the evening, Bitcoin spiked upwards and reached our entry price. In the early morning, it successfully hit our target price of around 89,000, then triggered a low point. Currently, both long and short positions are close to securing a profit of over 7,000. Congratulations to those who followed along.
Returning to the market, the current daily level opened low and is rising high. Bitcoin is once again operating near the MA5 moving average, and the K-line has changed from green to red. The MACD and KDJ indicators show a slowdown in short-term bullish sentiment. If tomorrow's daily update continues the rebound sentiment and produces a TD2 red energy bar while the coin price stabilizes around 93,500-94,000, it can be confirmed that the short-term daily level may experience a wave of rebound sentiment to fill the gap at the weekly K level, with strong resistance above at the 98,500-100,000 level. Of course, if Bitcoin fails to break through the short-term resistance of 93,500-94,000 today, the market will once again fall back to the support level of around 89,000 to consolidate the bottom.
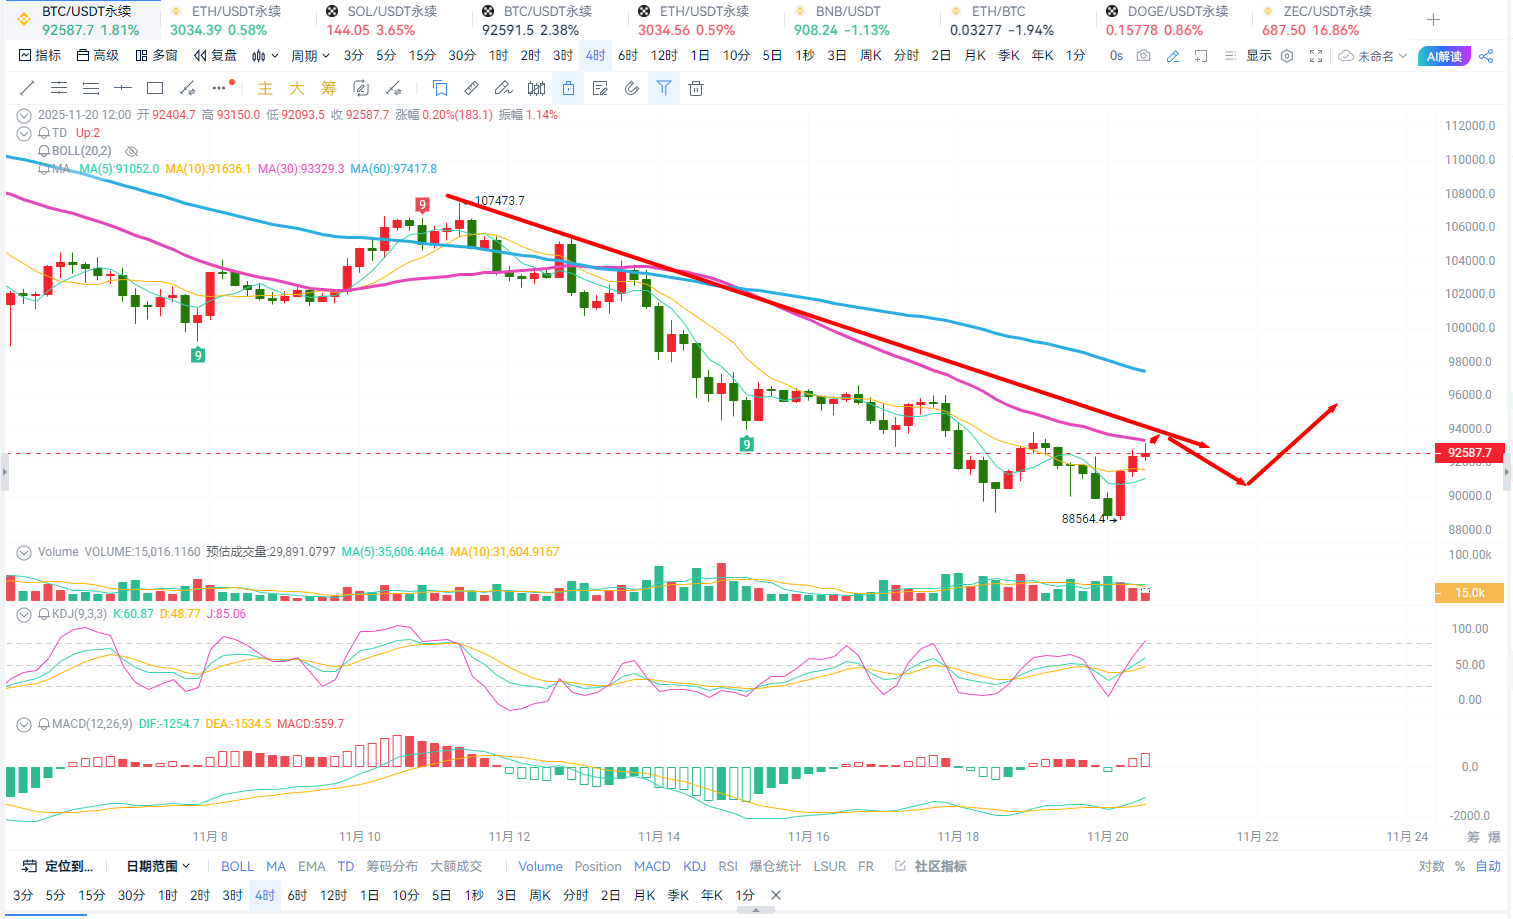
At the 4-hour level, Bitcoin is currently operating near the middle track of the BOLL band. The MACD and KDJ indicators show a slight rebound in short-term sentiment, and the MA5 and 10-day moving averages are also showing slight upward signs. However, the MA30 moving average still maintains a downward pressure, indicating that there is strong resistance above. Combined with the hourly chart, Bitcoin's overall trend still leans towards slight oscillation and adjustment, with support at the low point still referenced around 89,000-88,000. For intraday operations, my personal view is to maintain a primarily bullish mindset, with a secondary focus on bearish strategies.
Operational Strategy: 93,200-94,000 bullish, Target: 91,500-90,000, Stop Loss: 94,500
Low bullish entry points are referenced around 90,000-89,000.
Ethereum's short-term trend is basically in sync with Bitcoin. Currently, the short-term trend leans towards slight oscillation and adjustment, with short-term resistance referenced around 3,070-3,165, and support at the low point referenced around 2,950-2,880. It is expected that the overall market will lean towards oscillation and adjustment repair from day to night. Therefore, my personal view is to maintain a primarily bullish mindset, with a secondary focus on bearish strategies.
Operational Thought: 3,060-3,100 bullish, Target: 3,000-2,950, Stop Loss: 3,135
Low bullish entry points are referenced around 2,950-2,900.
For the current trend, I expect it to be sufficient, and I will continue to follow up.
My personal views are for reference only; there may be delays in article review and push notifications. The market changes rapidly, so specific entry and exit points should be based on real-time guidance. Please proceed with caution when entering the market.

免责声明:本文章仅代表作者个人观点,不代表本平台的立场和观点。本文章仅供信息分享,不构成对任何人的任何投资建议。用户与作者之间的任何争议,与本平台无关。如网页中刊载的文章或图片涉及侵权,请提供相关的权利证明和身份证明发送邮件到support@aicoin.com,本平台相关工作人员将会进行核查。