Written by:Zack Pokorny
Translated by: Yangz, Techub News
Driven by the growth of on-chain lending, the crypto industry's collateralized loans reached a new all-time high at the end of the third quarter this year. Although this surpassed the long-term peak set in the fourth quarter of 2021 for the first time in nearly four years, the current market landscape is vastly different.
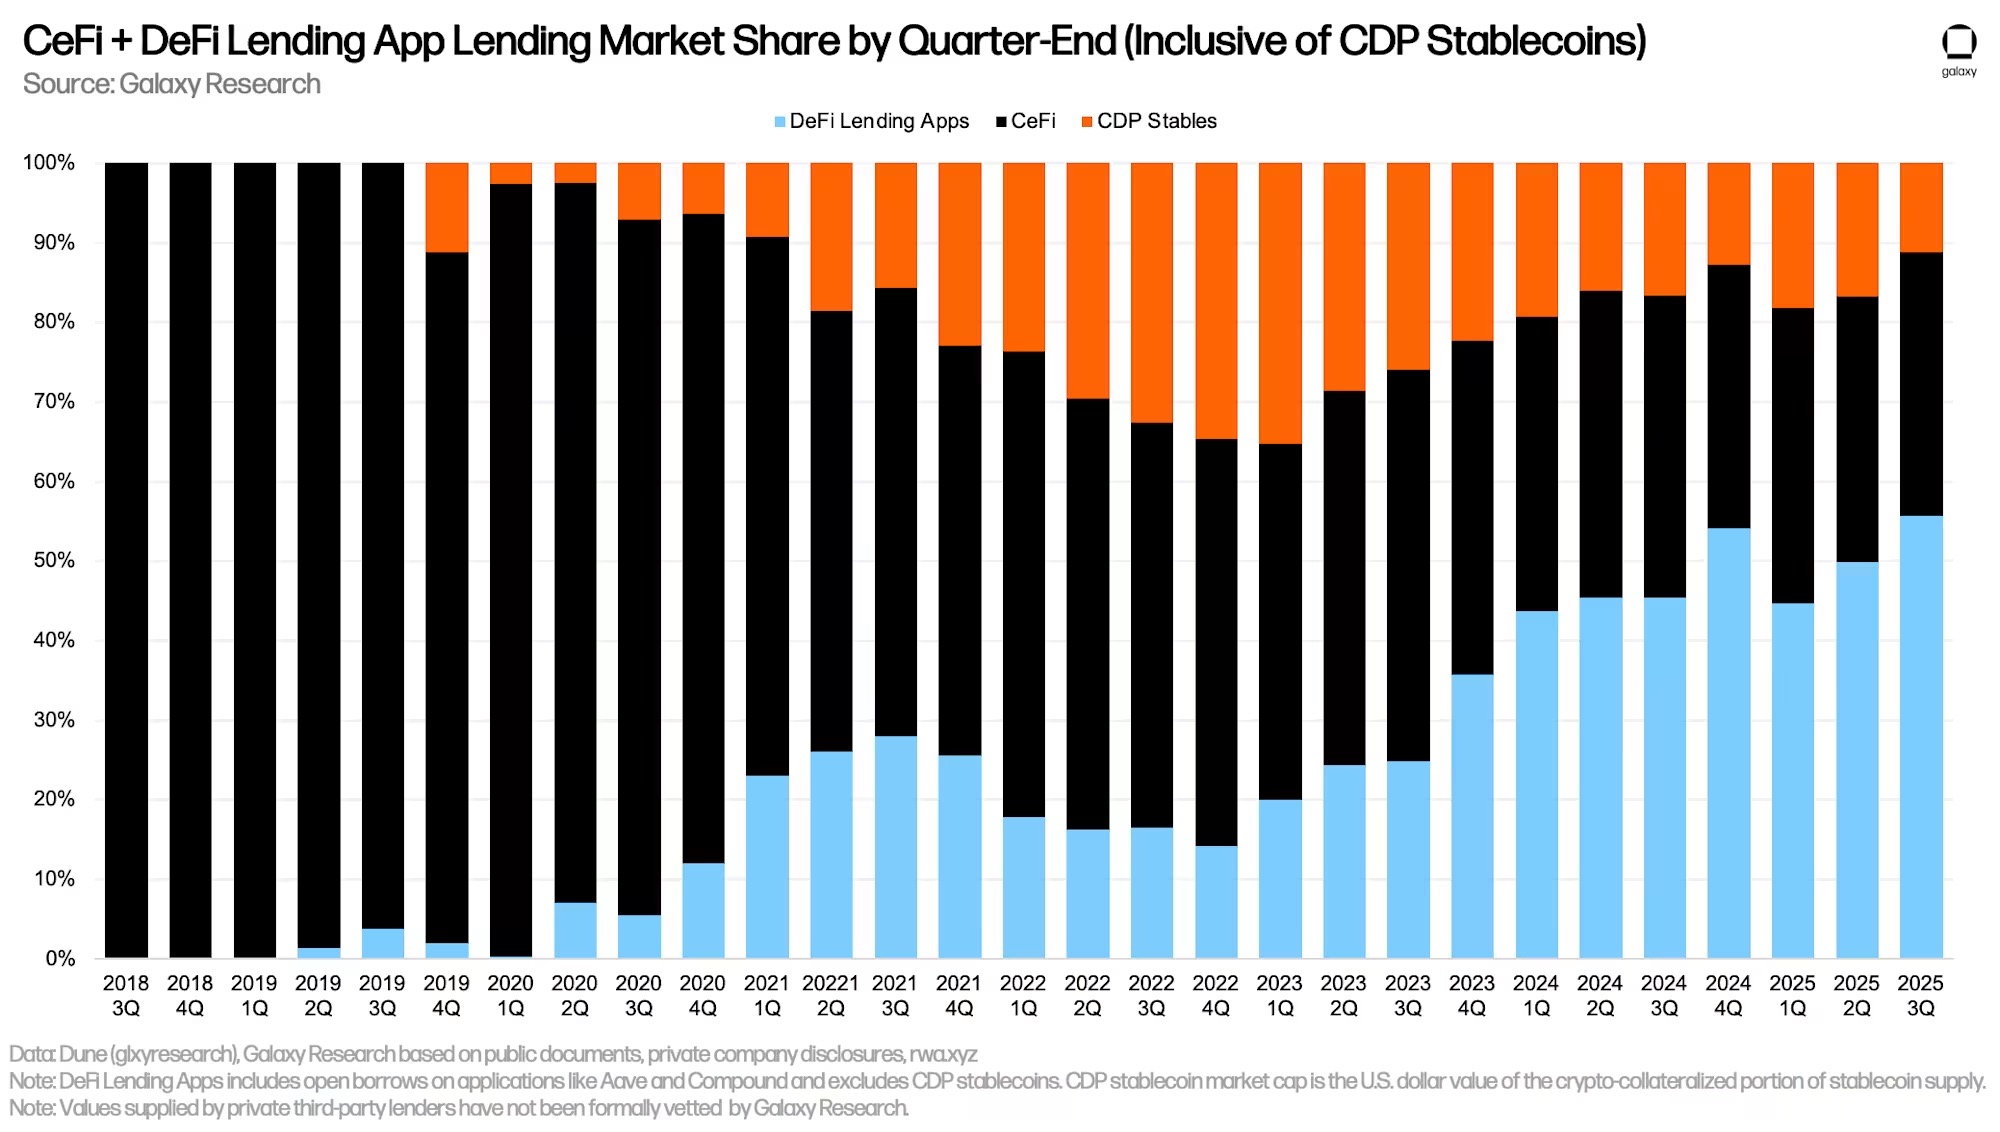
Firstly, on-chain lending currently occupies a larger share of the total lending market; at the end of the fourth quarter of 2021, on-chain lending through lending applications like Aave and collateralized debt position (CDP) stablecoins like DAI accounted for 48.6% of the market. Today, these channels hold a 66.9% market share. Within on-chain lending, the balance between lending applications and CDP stablecoins has also undergone a significant shift. By the end of the third quarter of 2025, lending applications are expected to account for over 80% of the on-chain market, while CDPs will only account for 16%, compared to 53% in the fourth quarter of 2021. This marks a clear shift from synthetic, crypto-backed stablecoins to lending-focused centralized stablecoins like USDT and USDC.
In the centralized lending space, we are witnessing a situation that is starkly different from the previous cycle. As CeFi lending institutions choose to self-regulate, unsecured or under-collateralized loans have become far less common. After the crisis in 2022, surviving companies recognized that opaque, relationship-based lending had become a reputational and business burden. Many companies are now seeking to go public or attract more institutional funding sources, which has forced them to implement stricter internal risk controls and full collateralization standards. The industry sentiment has shifted, with unsecured loans being discarded, resulting in a smaller, more conservative CeFi credit space where transparency and the quality of collateral (or its existence) are at the core of credibility.
On the surface, we should not view the new lending peak with suspicion. After all, there is no magical threshold of outstanding loans that signals danger. What matters is the quality of the collateral and the purpose of the borrowed funds. In both respects, the current cycle looks very different from 2021. The previous peak was characterized by unsecured loans, chasing speculative yields in short-lived protocols, and more volatile collateral assets. Today, collateralized loans have become the norm, with the sector being systematically more transparent (with rising shares of on-chain borrowing and public companies reporting their accounts), and collateral is more concentrated in BTC, ETH (both of which have lower volatility than in previous cycles), and stable yield-generating assets like Pendle Principal Tokens (PTs).
However, shortly after the end of the third quarter, the futures market experienced its largest liquidation event in history. On October 10, over $19 billion worth of perpetual contract positions were liquidated in just one day, with billions more being automatically deleveraged (ADL). Although this event cleared a significant amount of open contracts, it does not necessarily indicate systemic over-leverage, unlike crypto collateralized loans. Prices plummeted so sharply that even moderately leveraged positions were forcibly liquidated, and many healthy accounts were caught up in chain liquidations and automatic deleveraging triggered by exchange-level risk controls. The perpetual contract market was cleared, but this was primarily due to mechanical design and severe price drops, rather than a general credit surplus.
Key Points
Crypto collateralized loans grew by $20.46 billion (+38.5%) to a new all-time high of $73.59 billion by the end of the third quarter of 2025. This is $4.22 billion (6.09%) higher than the previous all-time high of $69.37 billion set at the end of the fourth quarter of 2021.
The dollar-denominated value of outstanding loans in DeFi applications reached a new quarterly high at the end of the third quarter, increasing by $14.52 billion (+54.84%) to $40.99 billion.
Galaxy Research is tracking over $12 billion in outstanding debt used for direct purchases or to supplement DAT company's treasury strategies. Outstanding debt stagnated for most of the year, with only a $422 million increase in the third quarter.
Open interest (OI) in futures, including perpetual futures, increased by 41.46% quarter-over-quarter, rising from $132.75 billion to $187.79 billion as of September 30, and then reaching a historical high of $220.37 billion on October 6. The liquidation wave of perpetual contracts on October 10 caused open interest to drop by 30% overnight, from $207.62 billion on October 9 to $146.06 billion at the close on October 10.
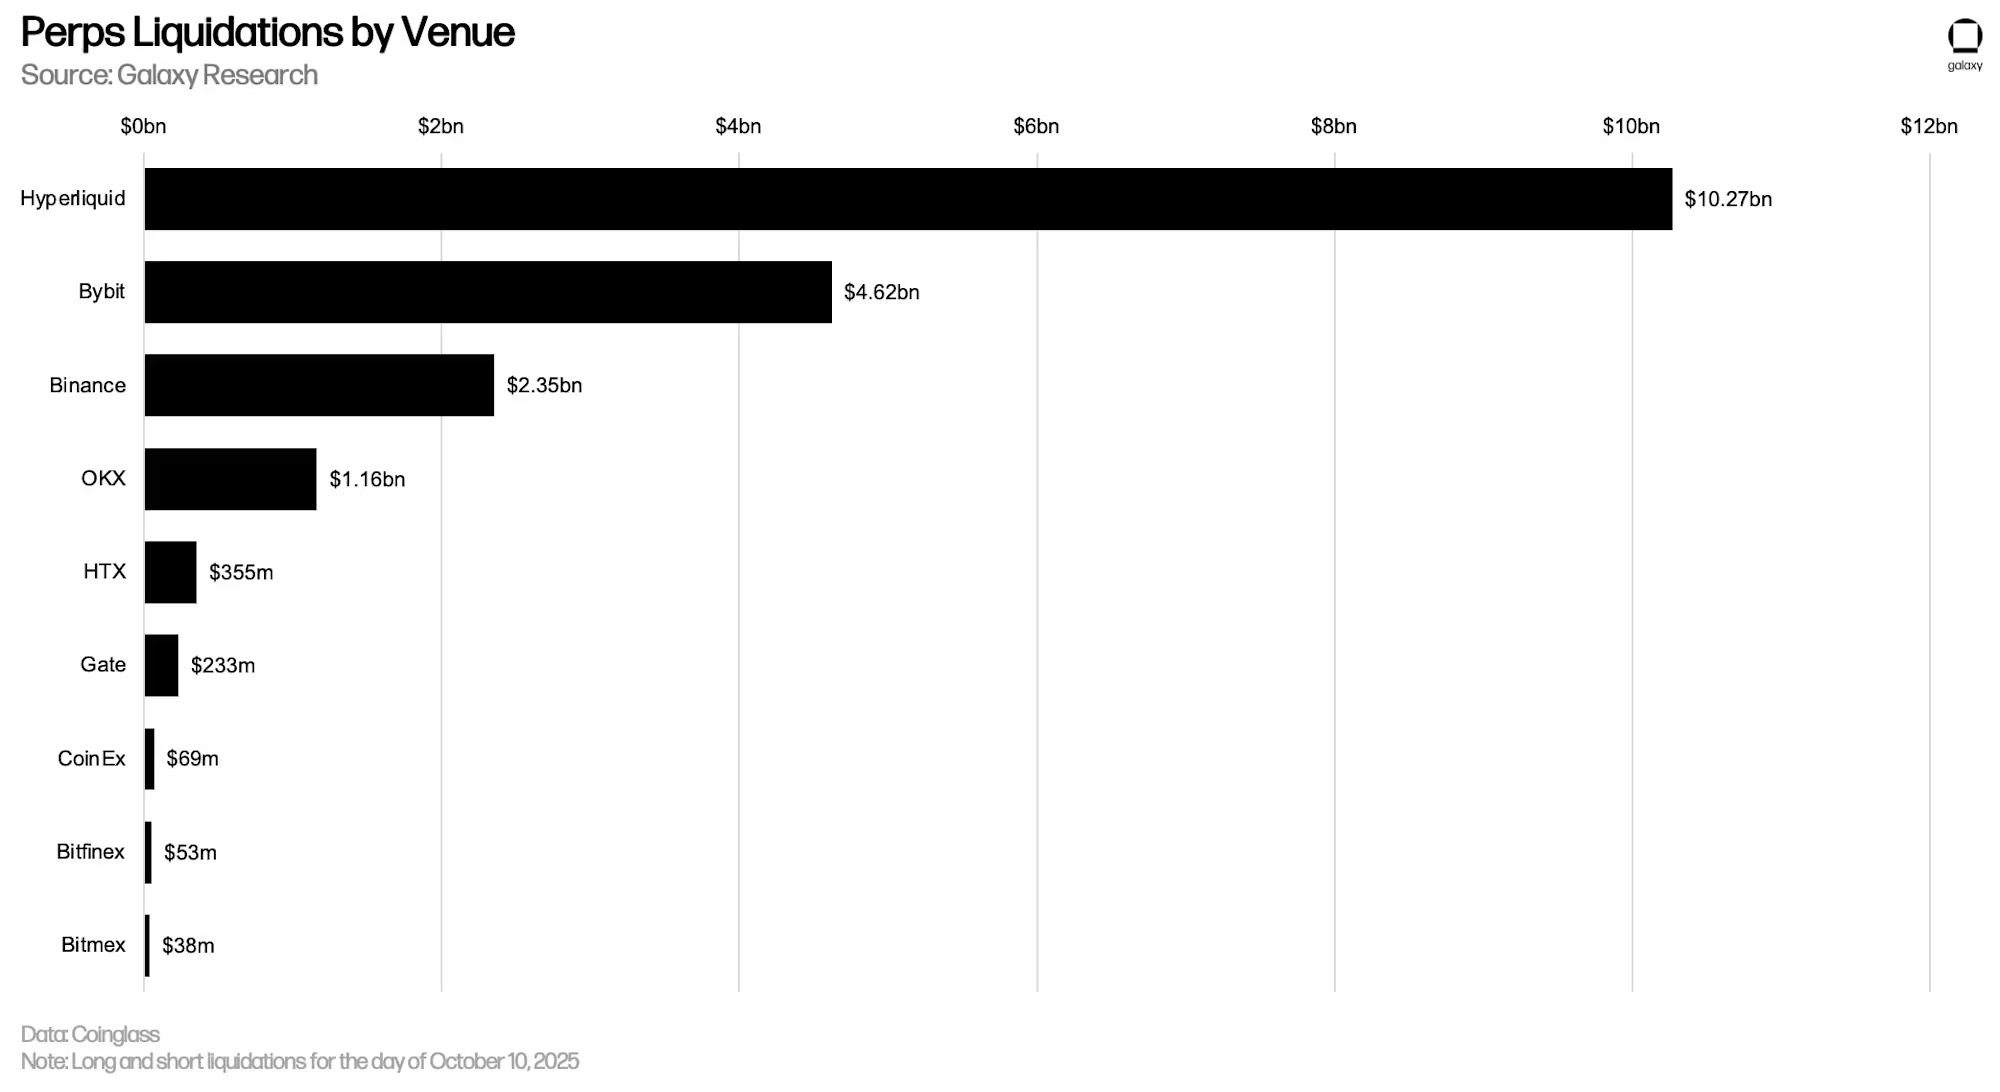
The chain liquidation on October 10 was the largest single-day futures liquidation event in history, with a total liquidation of over $17 billion for both long and short positions. Hyperliquid alone saw $10.08 billion in liquidations within 24 hours, followed by Bybit and Binance, which reported $4.58 billion and $2.31 billion in liquidations, respectively.
Crypto Collateralized Loans
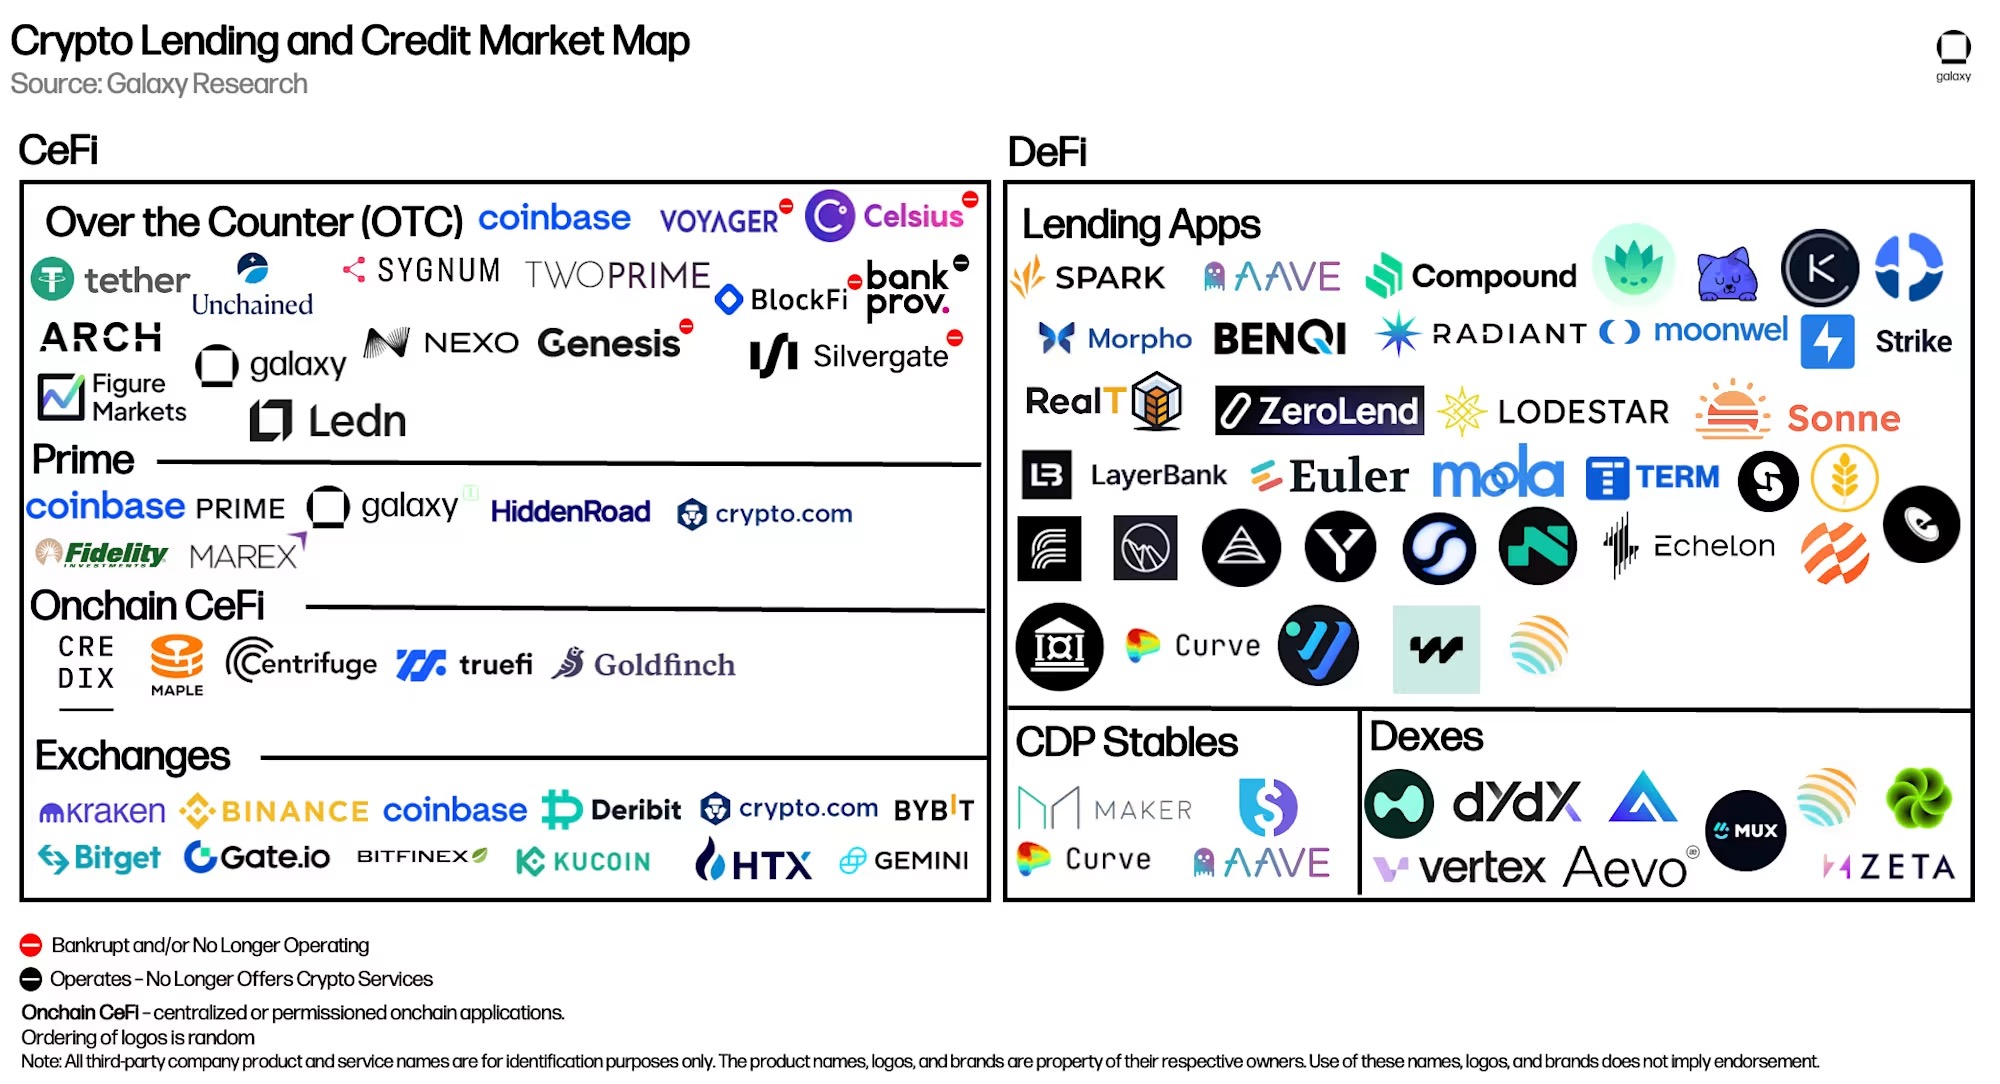
The market map below highlights some of the past and present mainstream participants in the CeFi and DeFi crypto lending markets. Some of the largest CeFi lending institutions by loan size collapsed in 2022 and 2023 due to the plummeting prices of crypto assets and liquidity exhaustion. These lending institutions are marked with red warning dots in the map below. Since Galaxy released its previous crypto leverage report, we have added a new DeFi application and six new instances of DeFi applications that we covered in past reports.
The newly added DeFi application is: JupLend from the Solana ecosystem.
Existing applications with expanded chain coverage include: Aave and Fluid extending to Plasma, Dolomite extending to Botanix, and Euler extending to Linea, Plasma, and Arbitrum.
CeFi
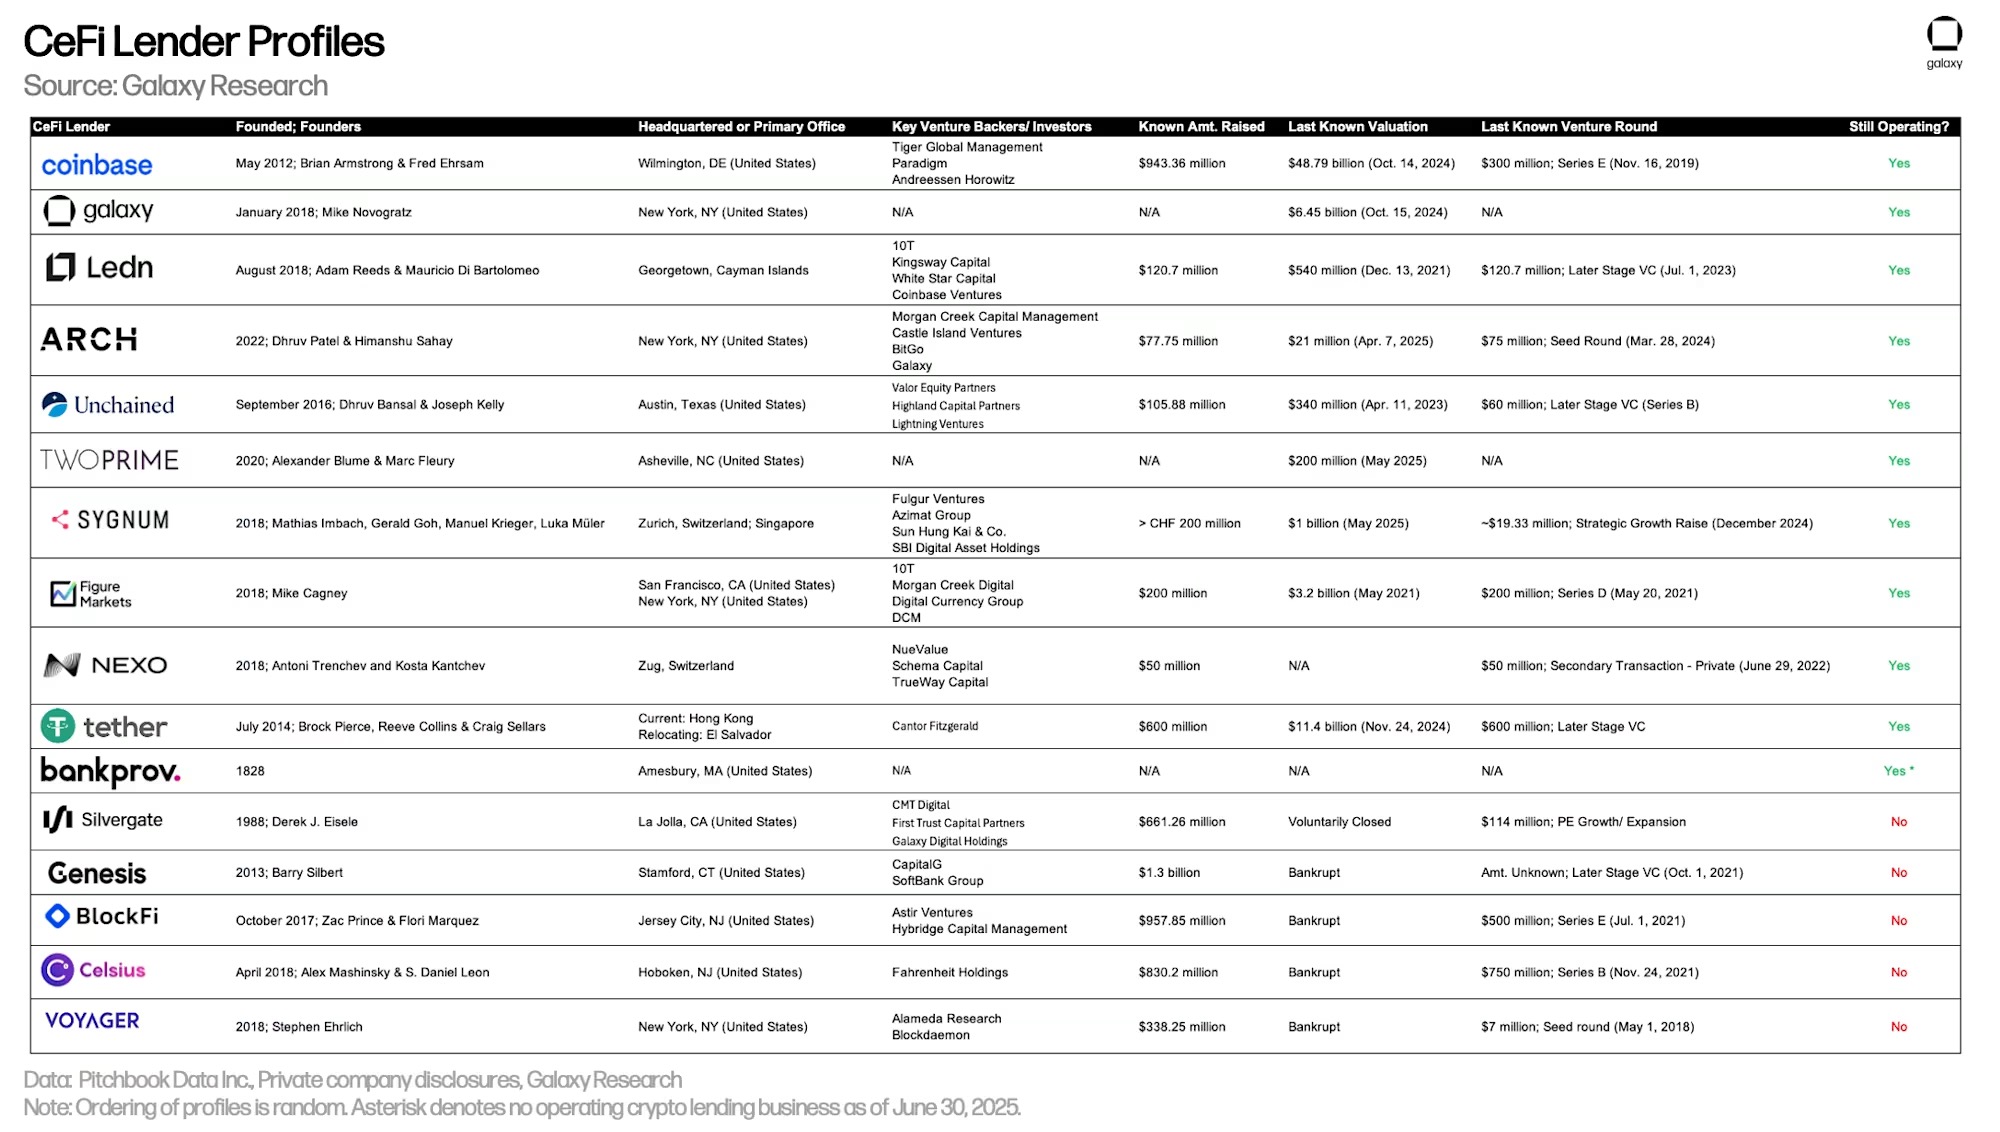
The table below compares the CeFi crypto lending institutions in our market analysis. Some of these companies offer multiple services to investors. For example, Coinbase primarily operates as an exchange but also provides credit to investors through over-the-counter crypto loans and collateralized financing. However, this analysis only shows the scale of their crypto collateralized loan accounts.
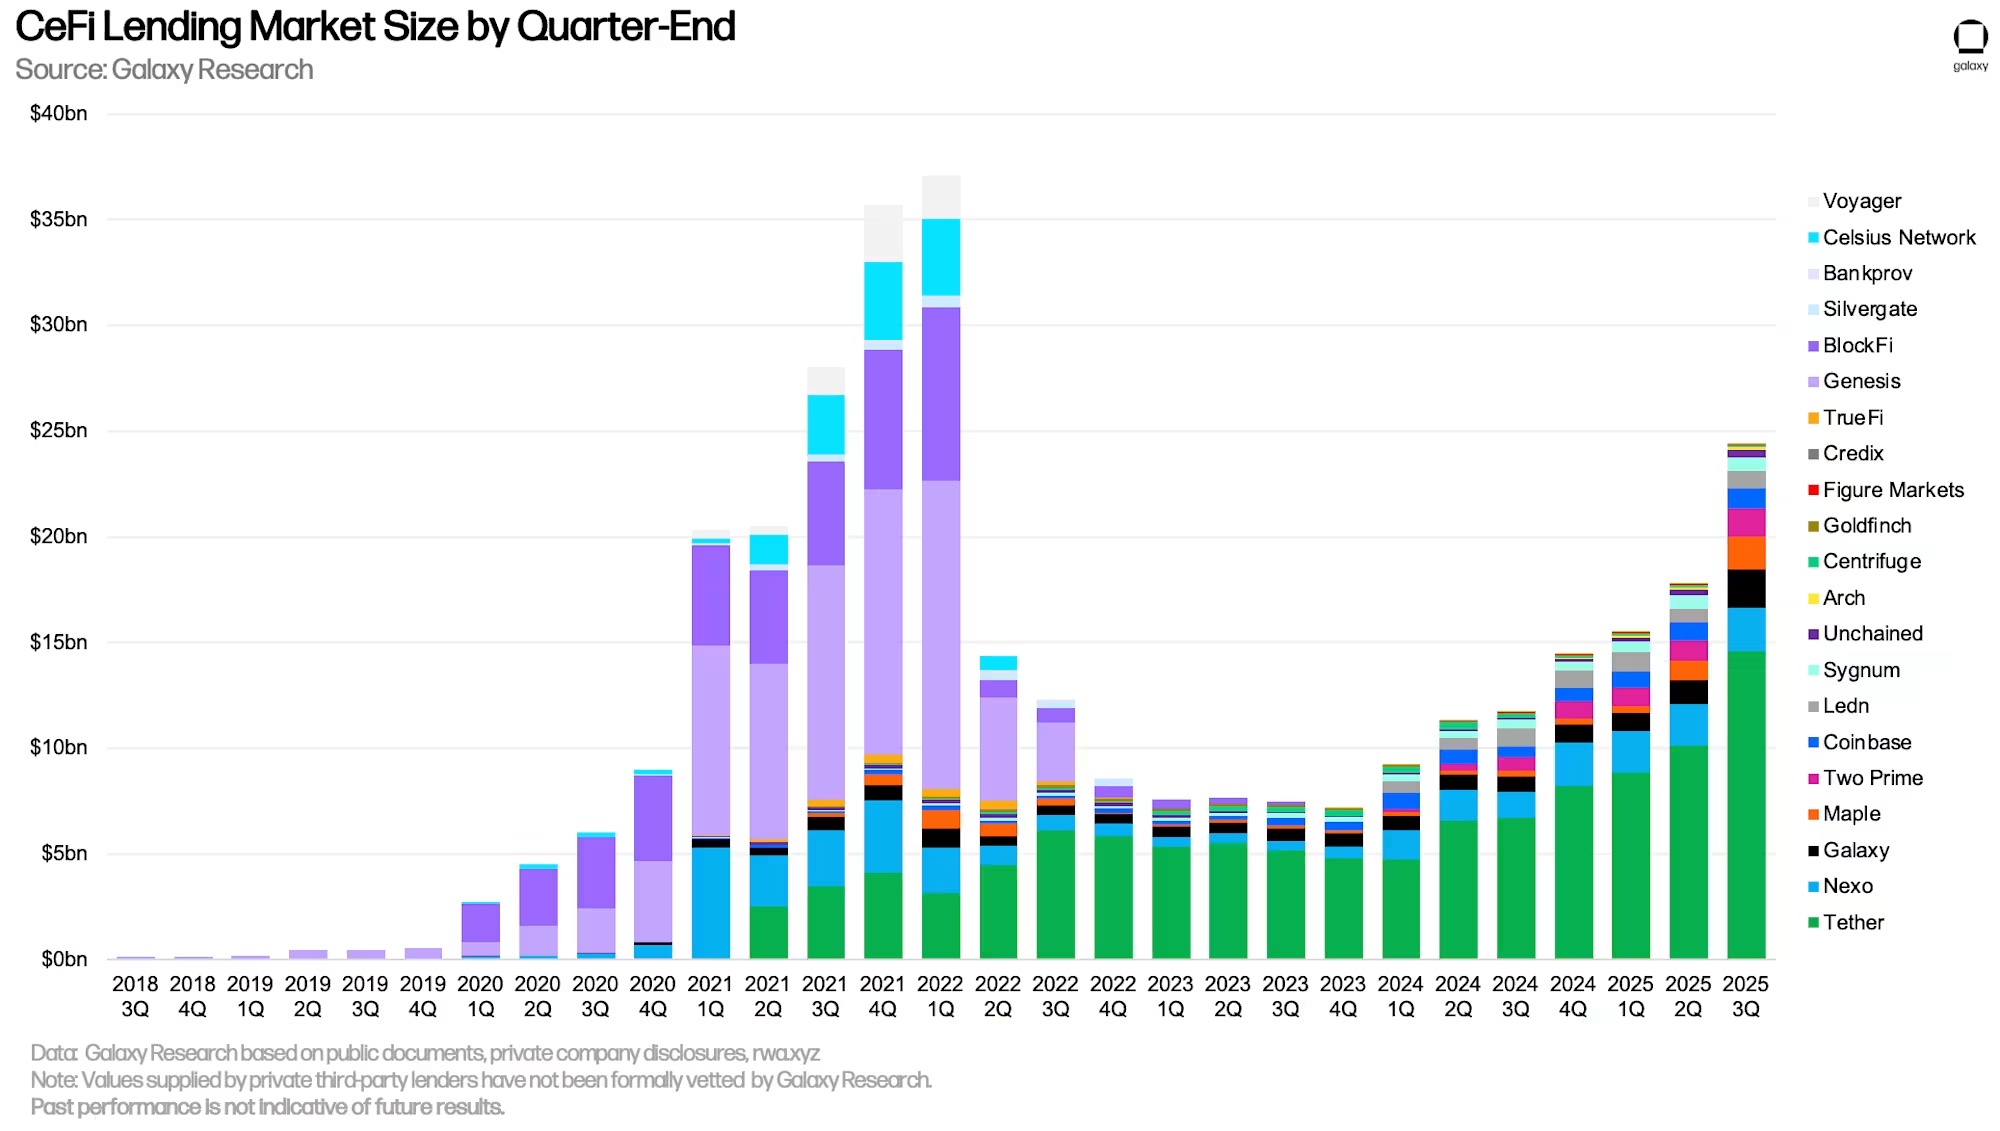
As of September 30, Galaxy Research tracked $24.37 billion in outstanding CeFi loans, a quarter-over-quarter increase of 37.11%, or $6.6 billion, and an increase of $17.19 billion (+239.4%) from the bear market low of $7.18 billion in the fourth quarter of 2023. Nevertheless, outstanding CeFi loans are still 34.3% lower than the historical high of $37.08 billion set in the first quarter of 2022.
In the third quarter, several CeFi lending institutions achieved record growth and loan account sizes:
TwoPrime (based on self-reported data) expanded its accounts by $394 million.
Arch (based on self-reported data) expanded its accounts by $49.29 million.
Galaxy (based on publicly disclosed financial data) expanded its accounts by $693 million.
Maple (based on on-chain data) expanded its accounts by $629.9 million.
Tether (based on its attestation report) expanded its accounts by $4.47 billion.
By outstanding loan value, Tether, Nexo, and Galaxy are the top three lending institutions tracked by Galaxy Research. As of September 30, Tether maintained $14.6 billion in outstanding loans, Nexo had $2.04 billion, and Galaxy had $1.8 billion.
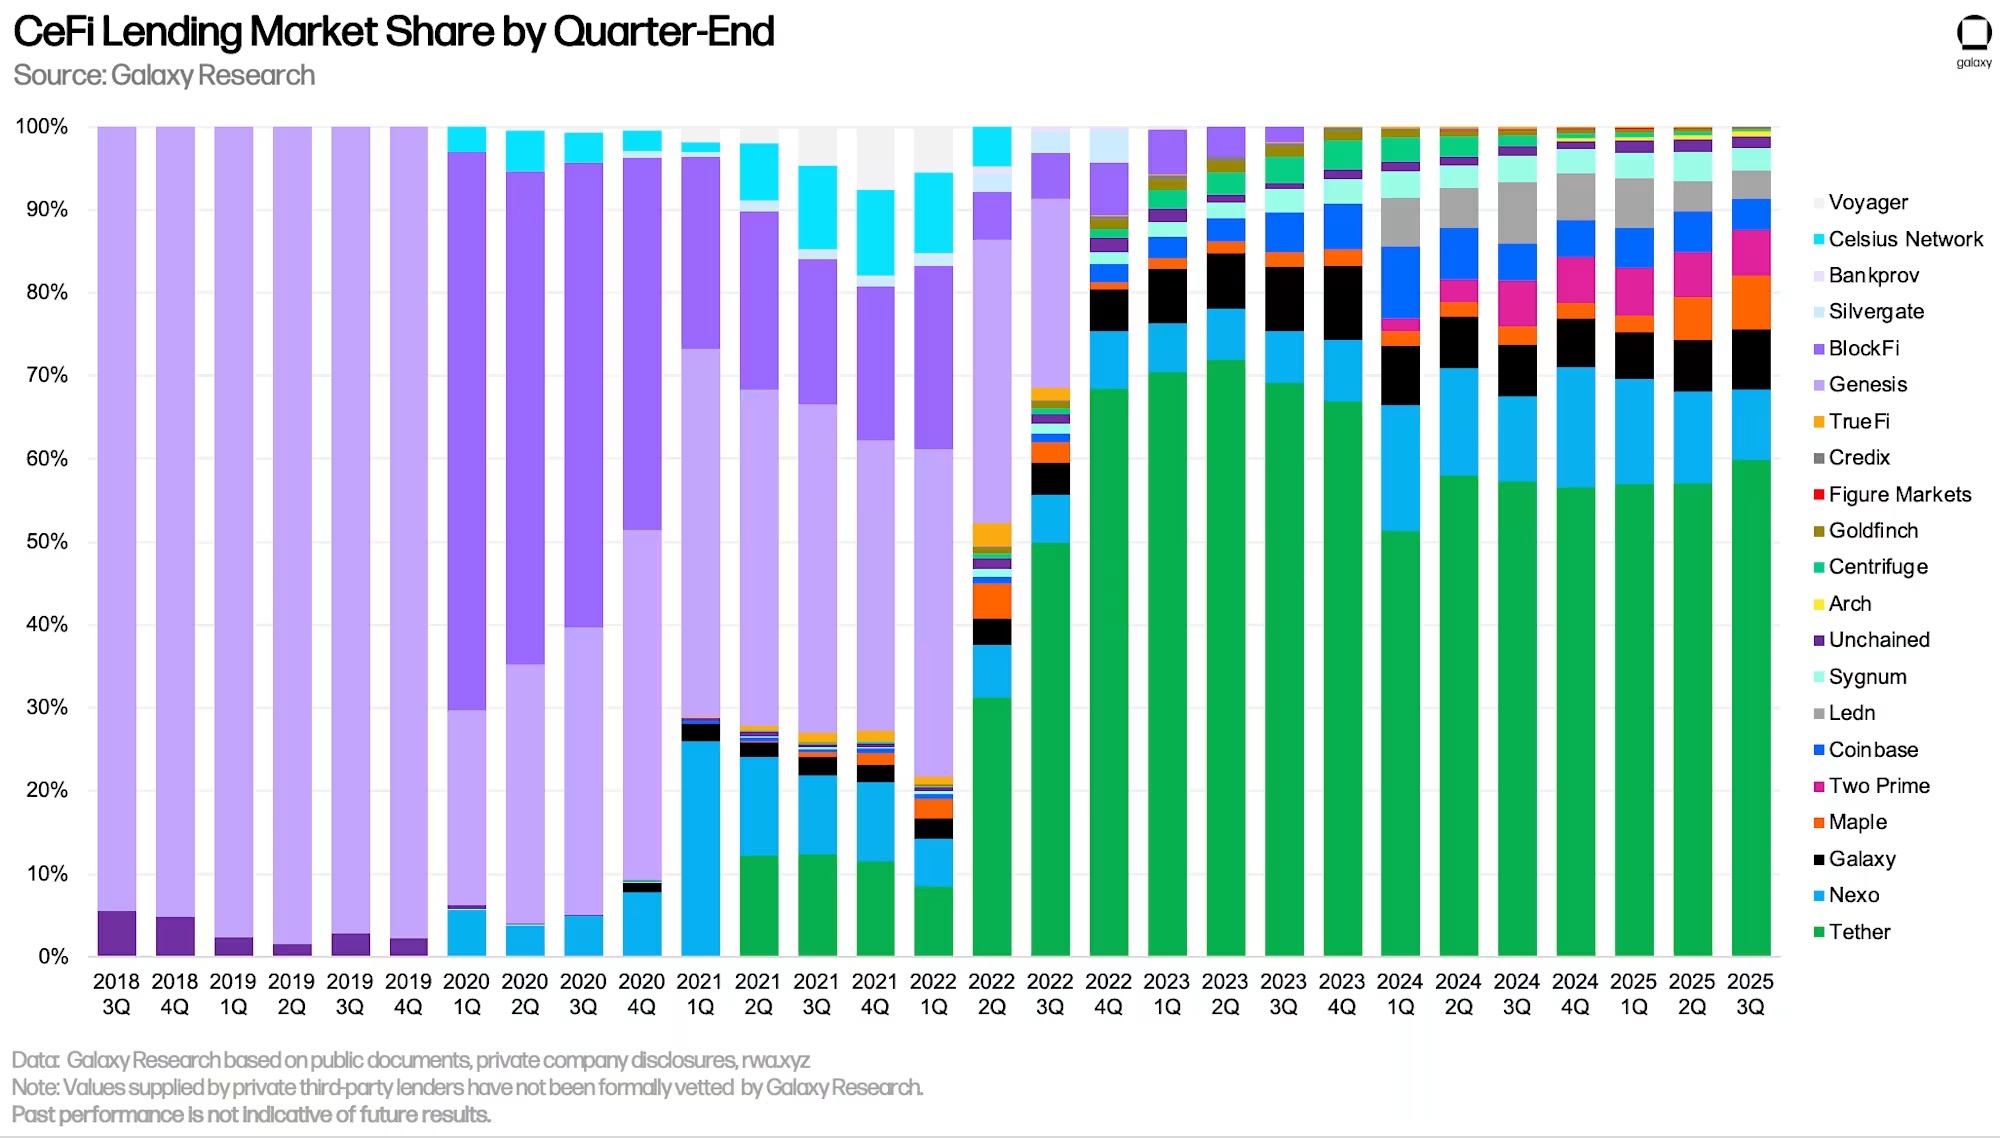
In our analysis, Tether is the dominant lending institution, holding a 59.91% share of the CeFi lending market (up 289 basis points from the previous quarter). Together with Nexo (market share 8.36%, down 265 basis points from the previous quarter) and Galaxy (market share 7.38%, up 115 basis points from the previous quarter), these three leading CeFi lending institutions we track collectively control 75.66% of the market share (up 140 basis points from the previous quarter).
When comparing market shares, it is essential to note the distinctions between different CeFi lending institutions. Some lending institutions only offer specific types of loans (e.g., BTC collateral only, altcoin collateral products, and cash loans excluding stablecoins), serve specific types of clients (e.g., institutional clients versus retail clients), or operate only in specific jurisdictions. The combination of these factors allows certain lending institutions to scale more easily than others.
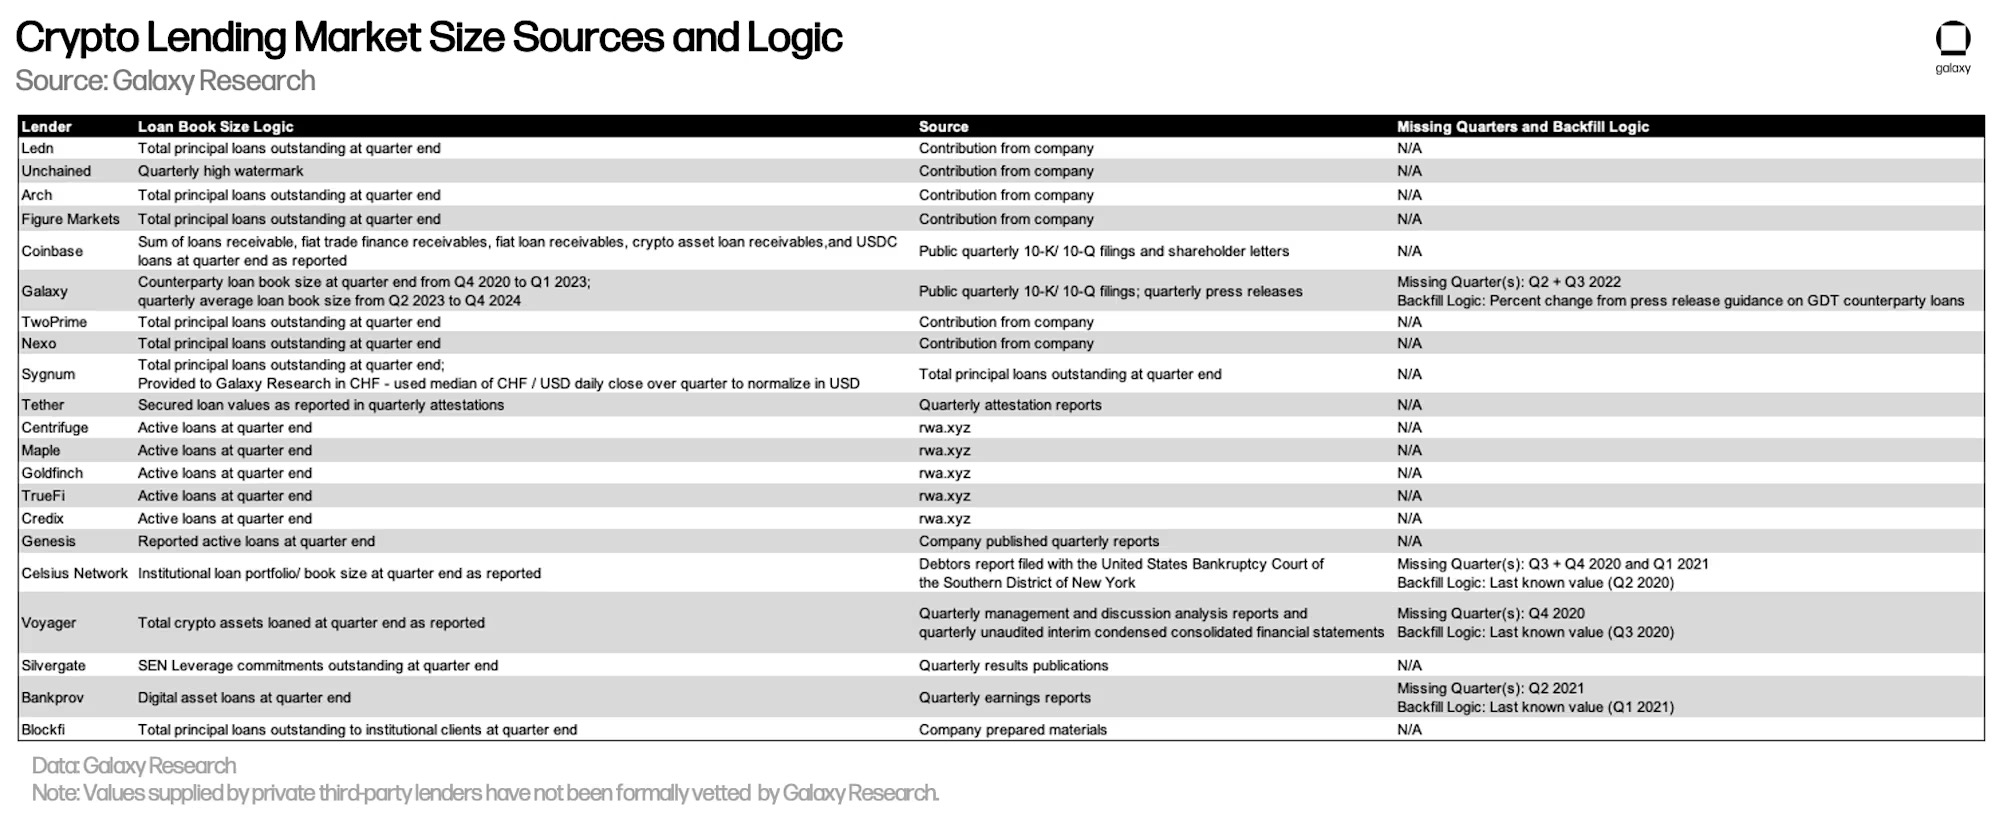
The table below details the data sources for each CeFi lending institution as reported by Galaxy Research, as well as the logic we used to calculate their loan account sizes. While the lending data for DeFi and on-chain CeFi can be obtained from on-chain data (which is transparent and easily accessible), acquiring CeFi data is quite tricky. This is due to inconsistencies in how CeFi lending institutions account for their outstanding loans and the frequency of public information, coupled with the general difficulty in obtaining this information. Please note that the figures provided by private third-party lending institutions have not been formally verified by Galaxy Research.
CeFi vs. DeFi Lending
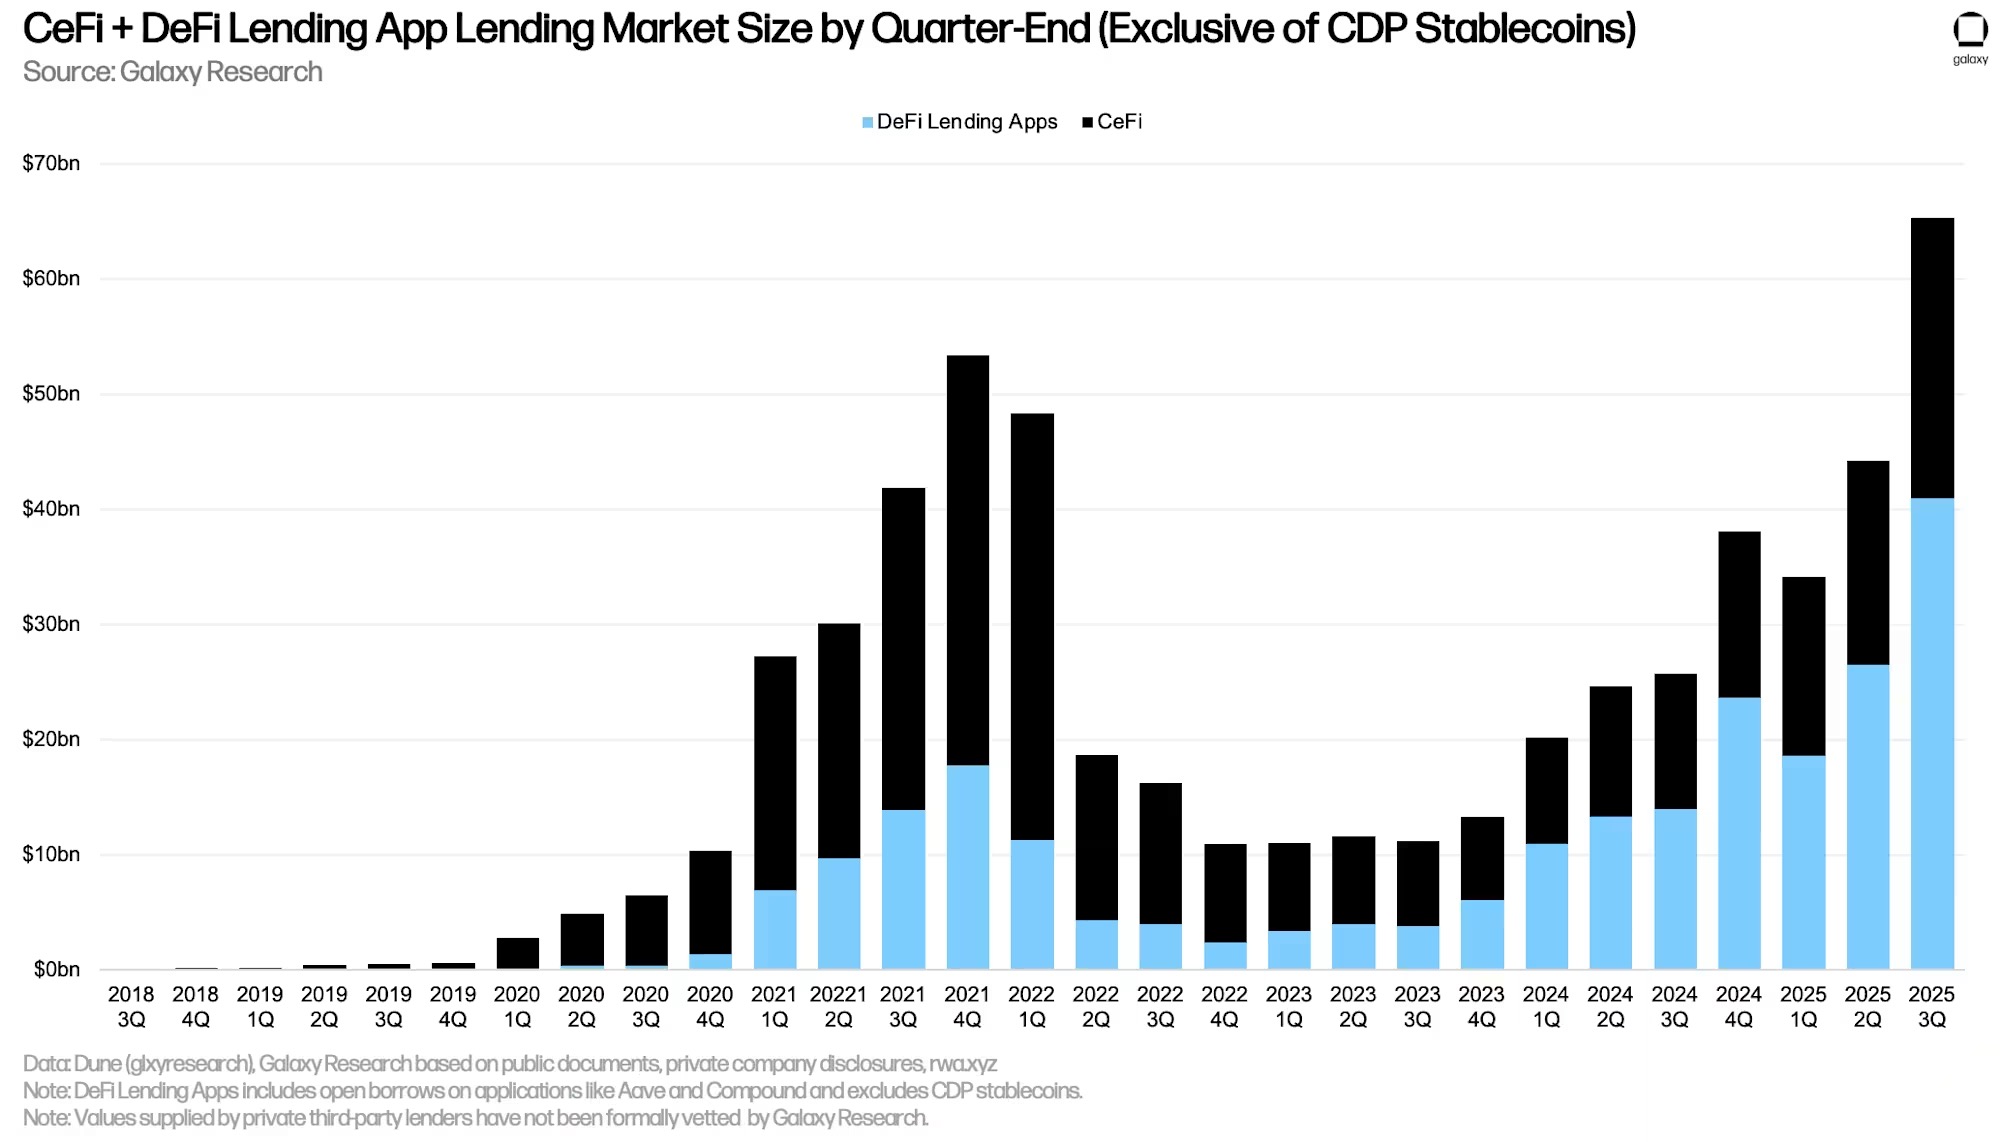
The dollar-denominated value of outstanding loans in DeFi applications reached a new quarterly high at the end of the third quarter, increasing by $14.52 billion (+54.84%) to $40.99 billion. When combining the data from DeFi applications with CeFi lending venues, the total outstanding crypto collateralized loans at the end of the quarter amounted to $65.37 billion. This represents a quarter-over-quarter increase of $21.12 billion (+47.72%), primarily driven by the growth of outstanding loans in various DeFi lending applications. The combined total of outstanding loans from DeFi lending applications and CeFi reached a new all-time high, surpassing the previous peak of $53.44 billion set in the fourth quarter of 2021 by $11.93 billion (22.32%).
Galaxy Research identifies several factors driving the continued growth of DeFi lending:
Incentives and Airdrops: Airdrops and incentive programs encourage users to maintain borrowing even when faced with market conditions or pressures on loan economics. Such programs can be found across numerous applications and chains.
Improved Collateral Assets: Collateral assets like Pendle PTs allow users to leverage efficient collateral with favorable loan-to-value ratios through stablecoin strategies, expanding as stablecoin usage grows.
Price Appreciation: Lending activity is reflexive to asset prices, as users can borrow more funds with the same collateral as prices appreciate. BTC saw a slight increase during the third quarter, ETH appreciated by about 50% and reached a new all-time high for the first time since November 2021, while SOL rose by about 33%.
It is important to note that there is a possibility of double counting between the total CeFi loan account sizes and DeFi borrowing data. This is because some CeFi entities rely on DeFi applications to lend to off-chain clients. For example, a hypothetical CeFi lending institution might collateralize its idle BTC to borrow USDC on-chain and then lend those USDC to off-chain borrowers. In this scenario, the on-chain borrowing of that CeFi lending institution would appear in both the DeFi outstanding borrowing data and as outstanding loans to its clients in the institution's financial statements. Due to a lack of disclosure or on-chain attribution information, it is challenging to filter out this dynamic situation.
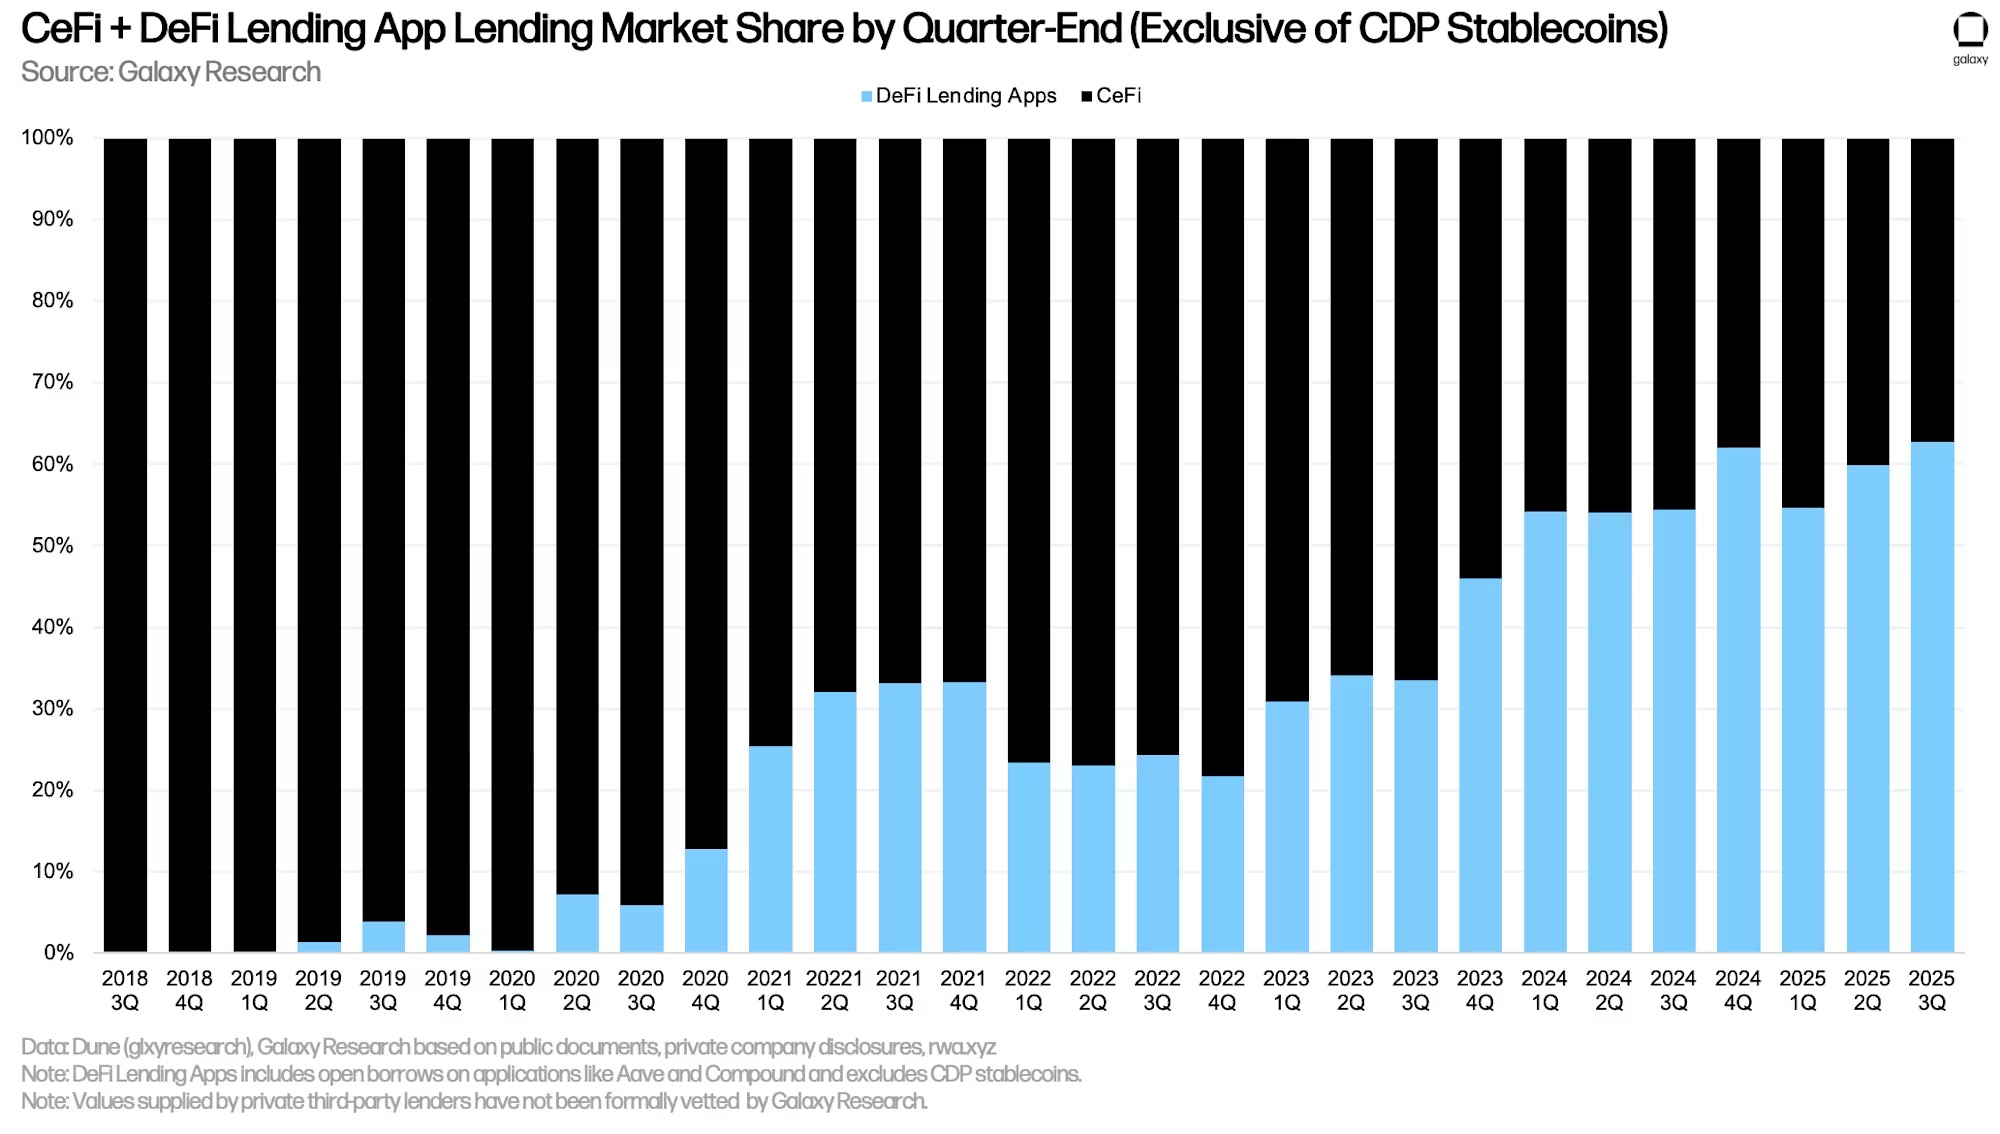
As outstanding loans in DeFi lending applications achieved quarter-over-quarter growth, their relative advantage over CeFi lending platforms rebounded to a new all-time high. By the end of the third quarter of 2025, the dominance of DeFi lending applications relative to CeFi lending platforms reached 62.71%, up from 59.83% at the end of the second quarter of 2025, and an increase of 72 basis points from the peak of 61.99% in the fourth quarter of 2024.
The portion of crypto assets collateralized in the collateralized debt position (CDP) stablecoin supply, one of the three pillars of crypto collateralized loans, decreased by $658 million (-7.4%) quarter-over-quarter. Similarly, there may be double counting between the total CeFi loan account sizes and the CDP stablecoin supply, as some CeFi entities may rely on minting CDP stablecoins through crypto collateral to fund loans issued to off-chain clients.
Overall, crypto collateralized loans grew by $20.46 billion (+38.5%) in the third quarter of 2025, reaching a new all-time high of $73.59 billion, surpassing the previous all-time high of $69.37 billion set at the end of the fourth quarter of 2021 by $4.22 billion (6.09%).
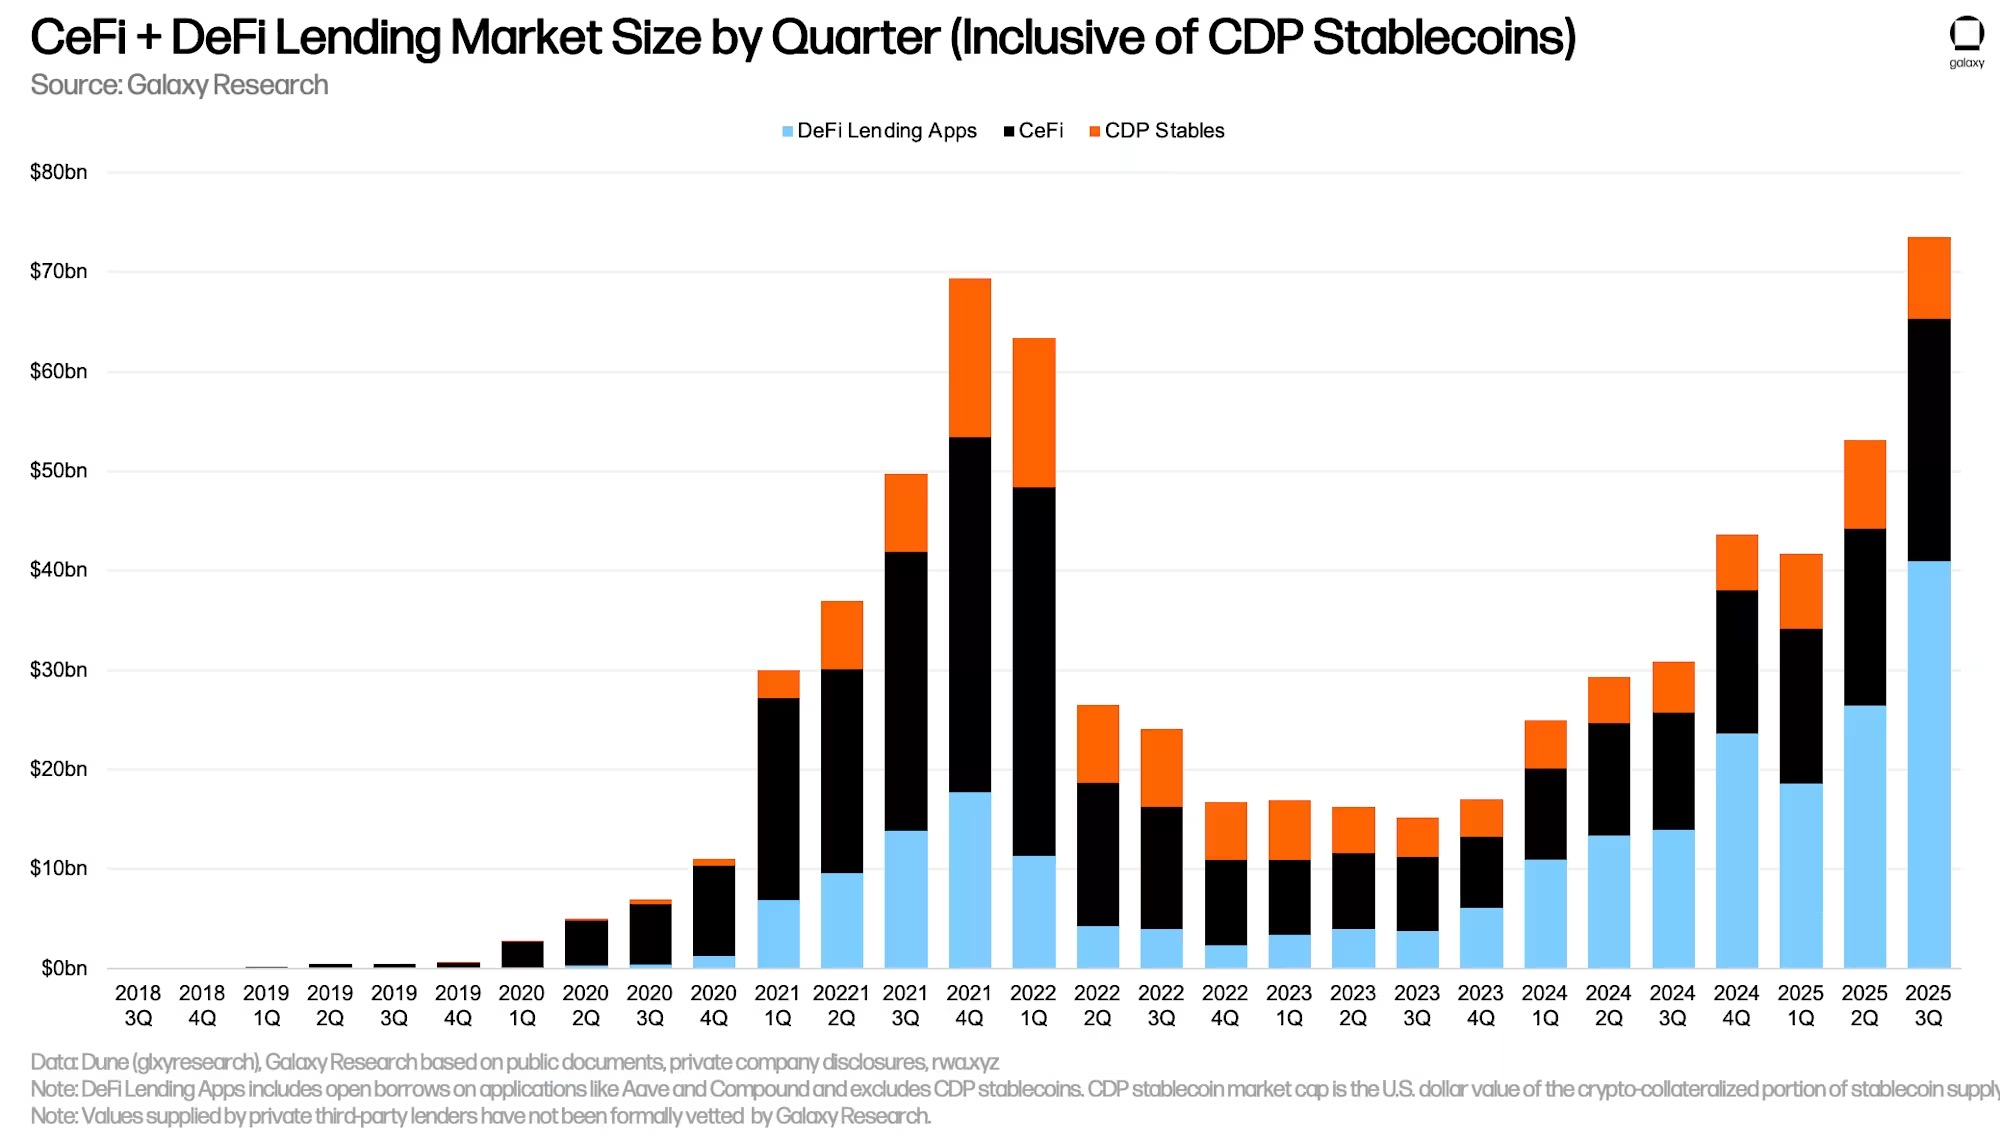
By the end of the third quarter of 2025, DeFi lending applications accounted for 55.7% of the crypto collateralized loan market (up 588 basis points from the second quarter of 2025), while CeFi platforms accounted for 33.12% (down 36 basis points from the second quarter of 2025), and the portion of crypto assets collateralized in the CDP stablecoin supply accounted for 11.18% (down 547 basis points from the second quarter of 2025). When combining DeFi lending applications and CDP stablecoins, on-chain lending venues held a dominant market share of 66.88% (up 33 basis points from the first quarter of 2025), which is 2 basis points higher than the historical high of 66.86% set at the end of the fourth quarter of 2024.
Other Perspectives on DeFi Lending
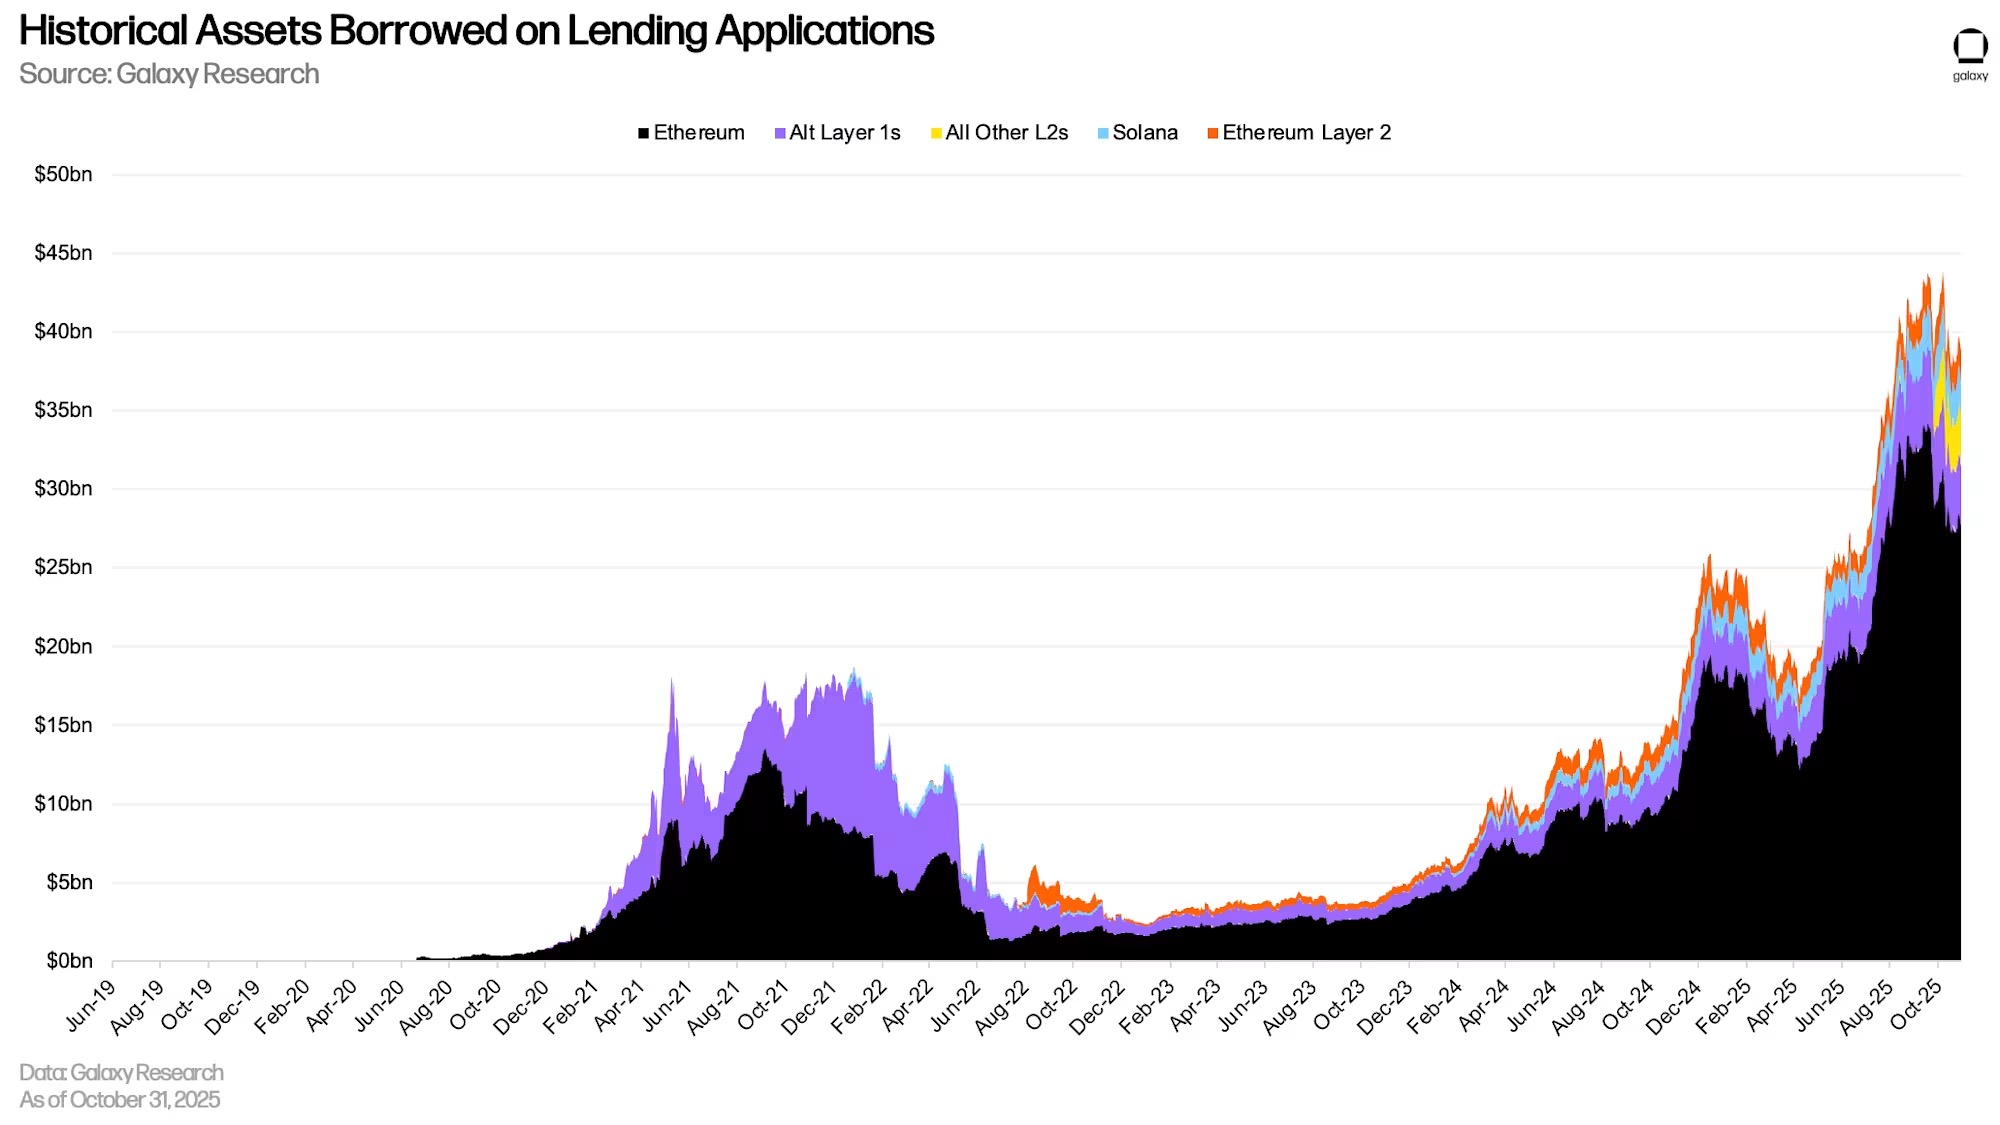
Despite the turbulent market environment, outstanding loans in DeFi lending applications have remained resilient. After reaching a historical daily high of $43.82 billion on October 7, outstanding loans only decreased by $5.06 billion (11.55%) by October 31.
Notably, Plasma has attracted significant lending activity since its launch just five weeks ago, with outstanding loans exceeding $3 billion as of October 31. Among these, Aave's lending market on Plasma holds a significant share, accounting for 68.8% of all borrowing on that chain as of October 31. Plasma has now become Aave's second-largest deployment instance, replacing Arbitrum, which had long held the second position.
Liquidations
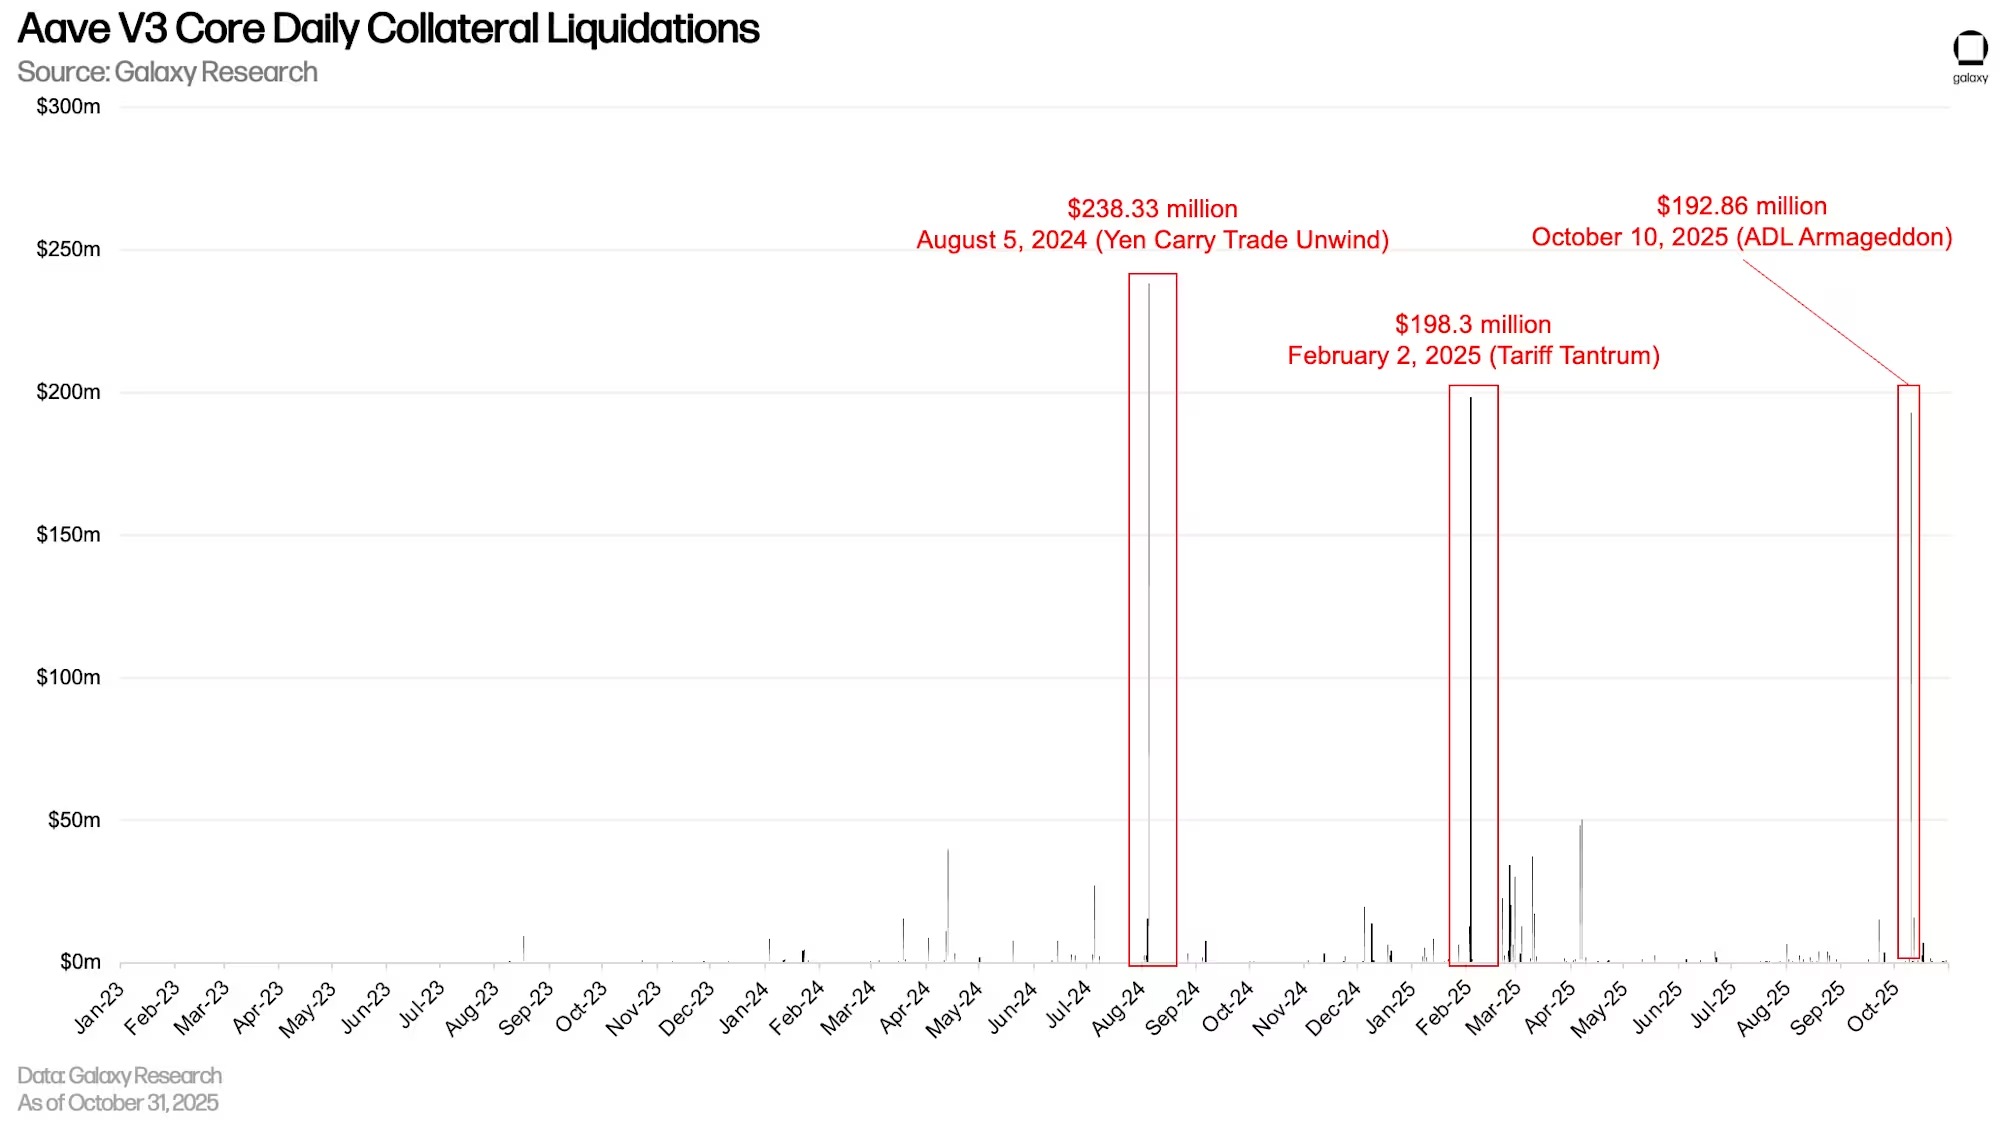
As some X accounts exaggeratedly described, the automatic deleveraging (ADL) event on October 10 resembled a "day of judgment," leading to heightened liquidation levels across various lending applications. Aave V3 Core on Ethereum experienced the third-highest single-day liquidation amount ever, reaching $192.86 million, second only to the yen arbitrage liquidation in August 2024 and the tariff incident in February 2025 that caused a crash in crypto prices. Wrapped Bitcoin tokens were the most liquidated asset type on October 10, with a liquidation value of $82.17 million.
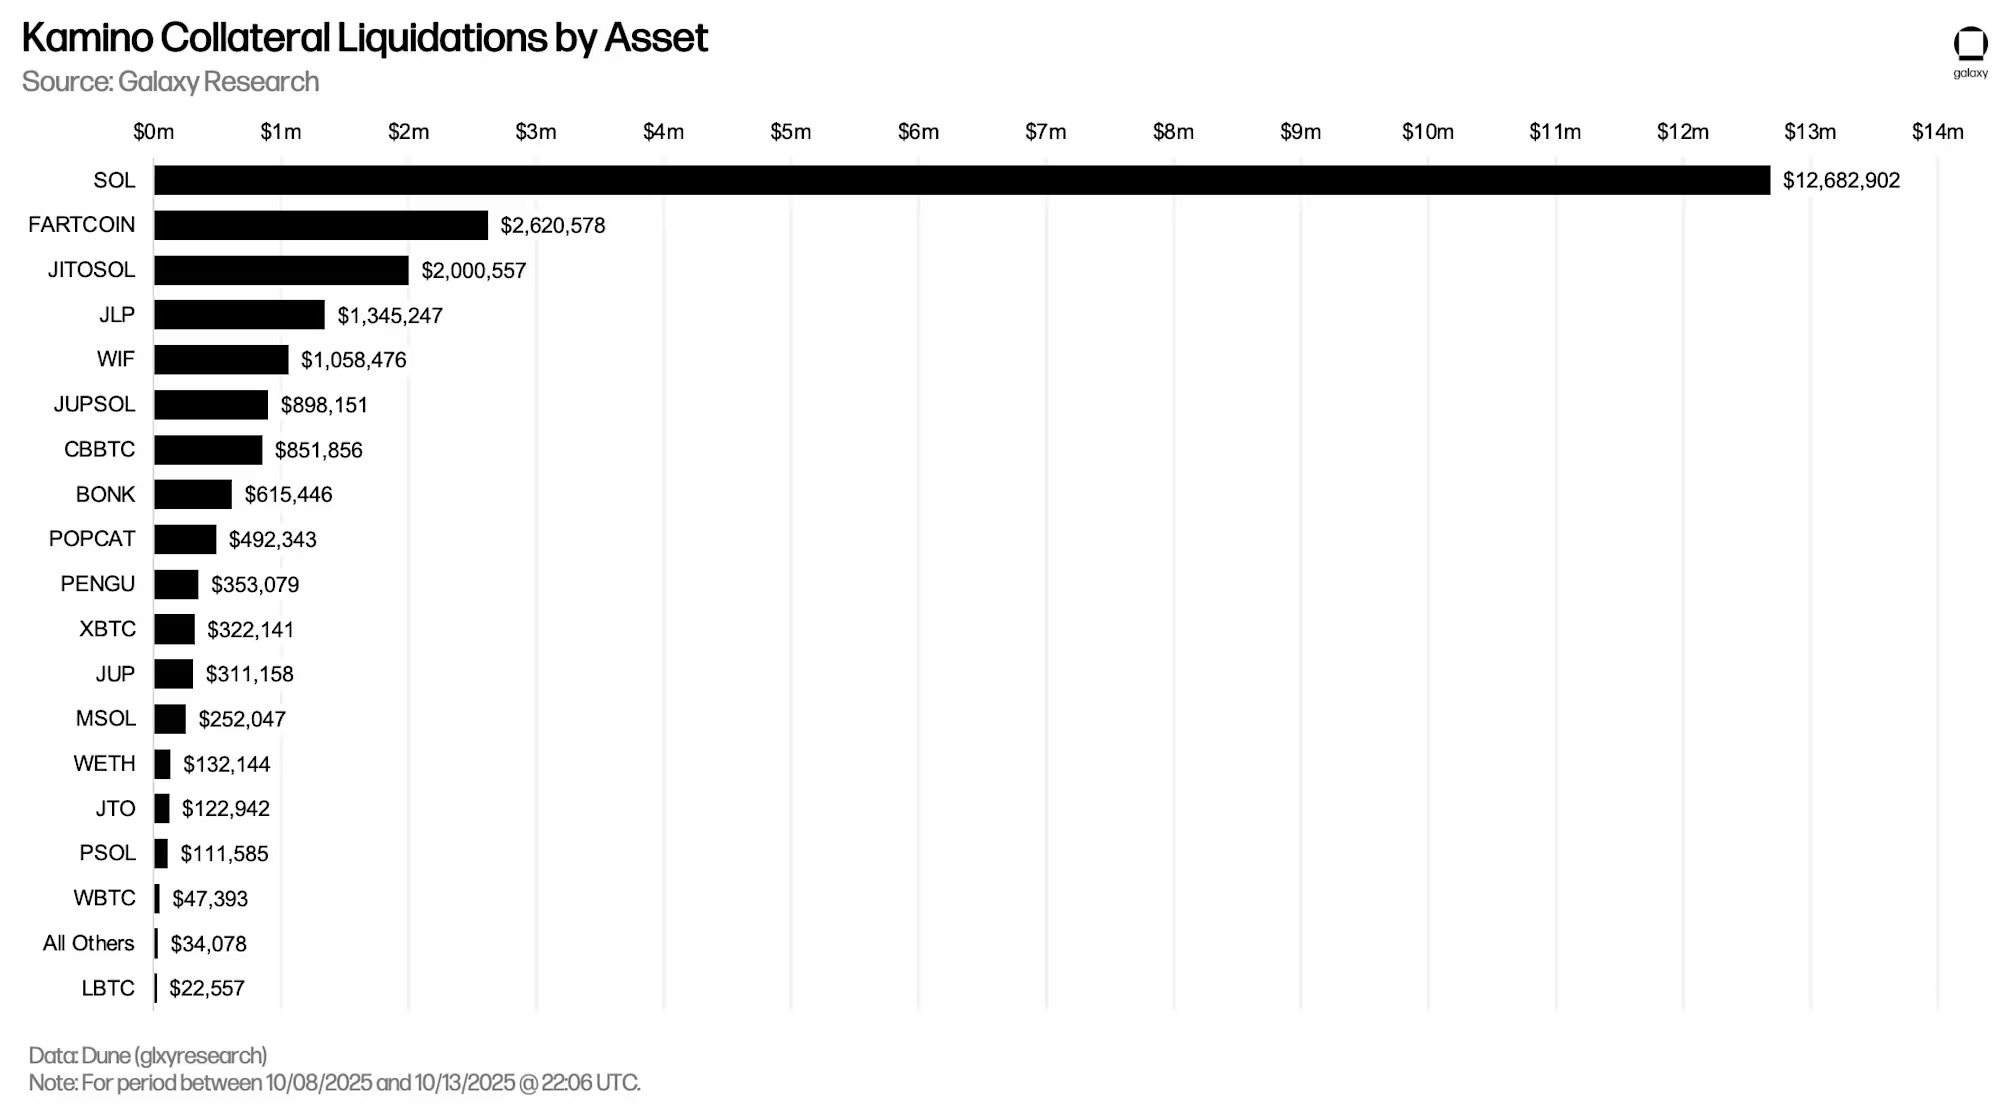
Kamino also experienced a surge in liquidation amounts from October 8 to 10. During this period, $12.7 million worth of WSOL and $2.6 million worth of FARTCOIN were liquidated.
Additionally, during the leverage liquidation on October 10, Fluid (across 5 chains) saw $17.38 million in liquidations, while Morpho (across 12 chains) experienced $27.7 million in liquidations.
On-chain vs. Off-chain Rates
The following compares the borrowing rates for stablecoins, Bitcoin, and Ethereum in the on-chain lending market versus through off-chain channels.
Stablecoins
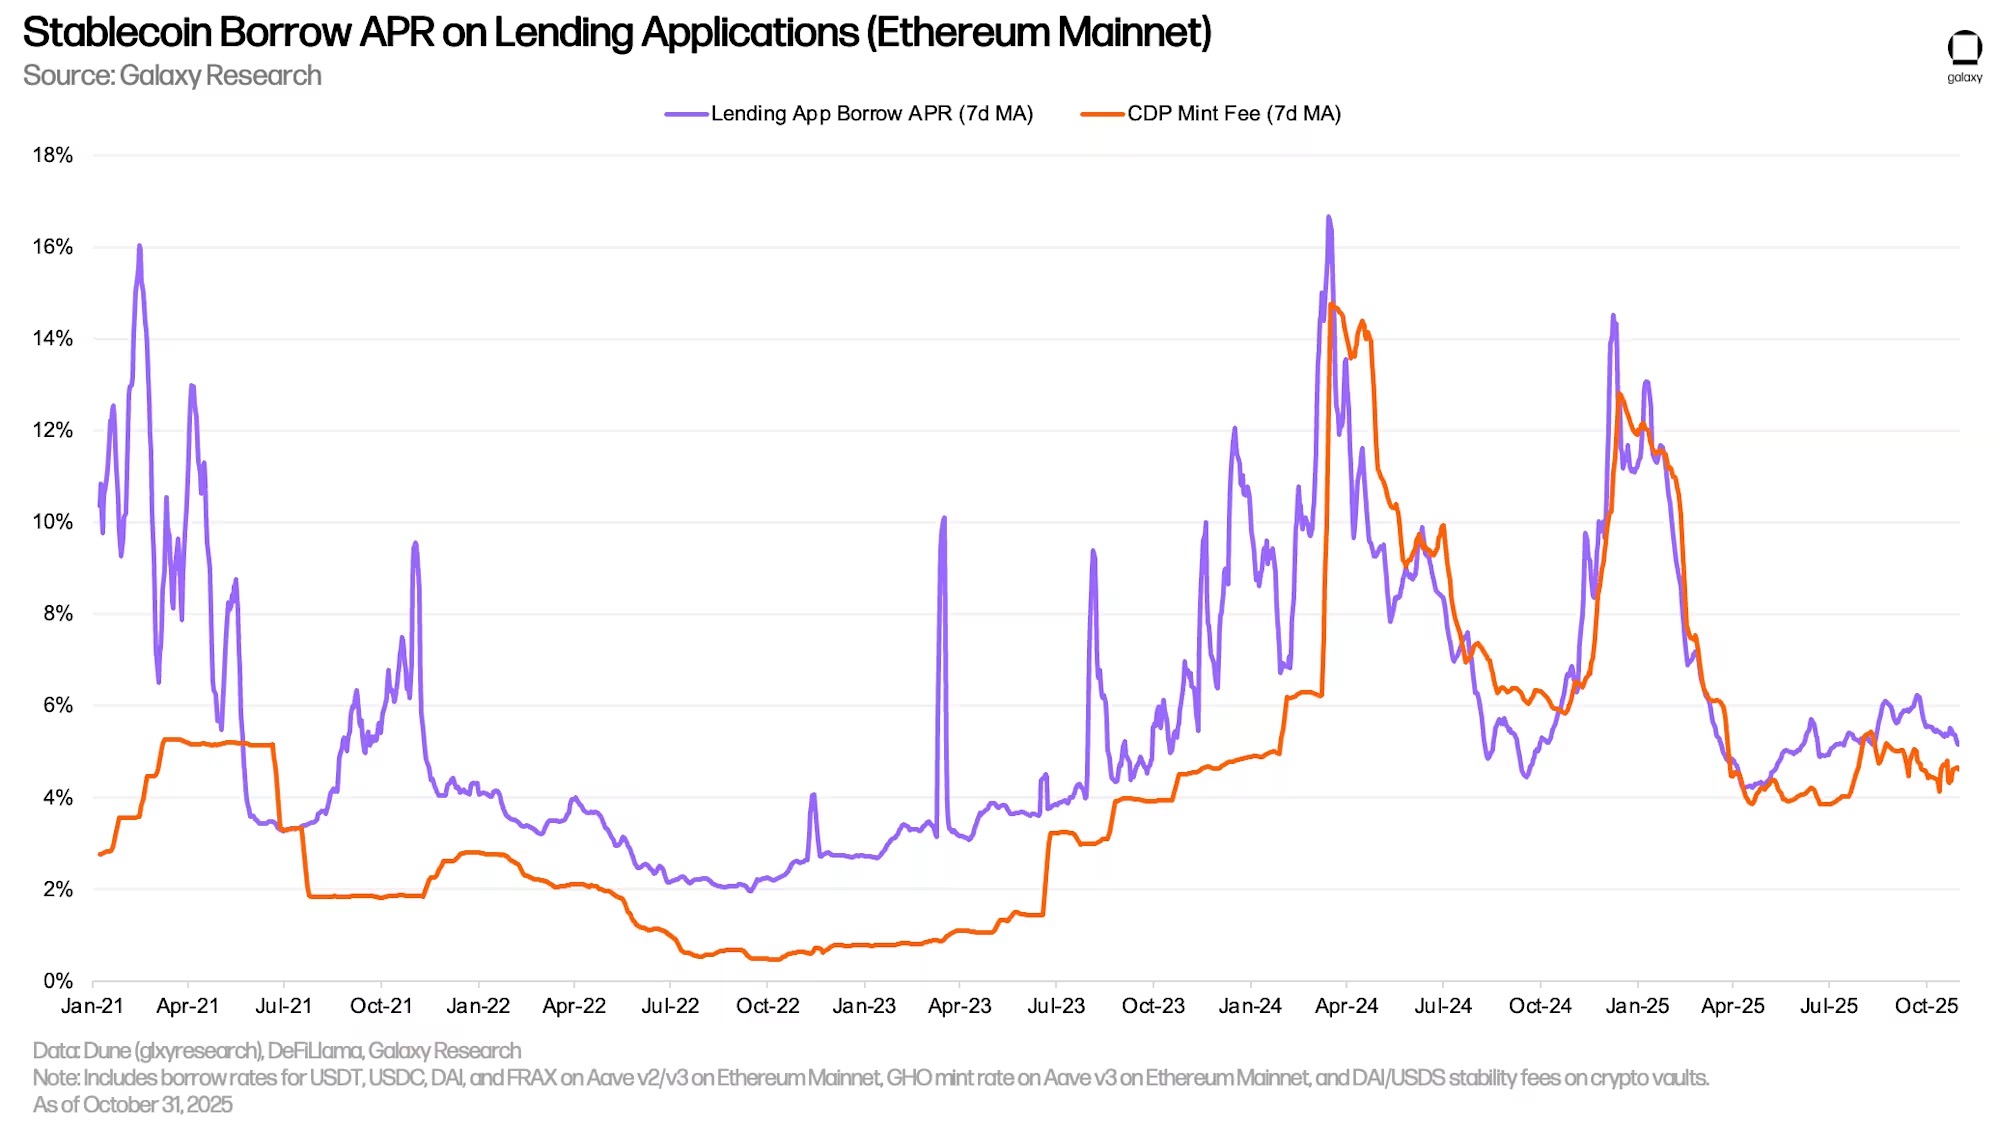
The weighted average borrowing rate for stablecoins slightly increased from 4.23% on June 30 to 4.83% on October 31. This figure is derived from the borrowing costs of various lending protocols and the minting costs of CDP stablecoins, weighted by outstanding loans.
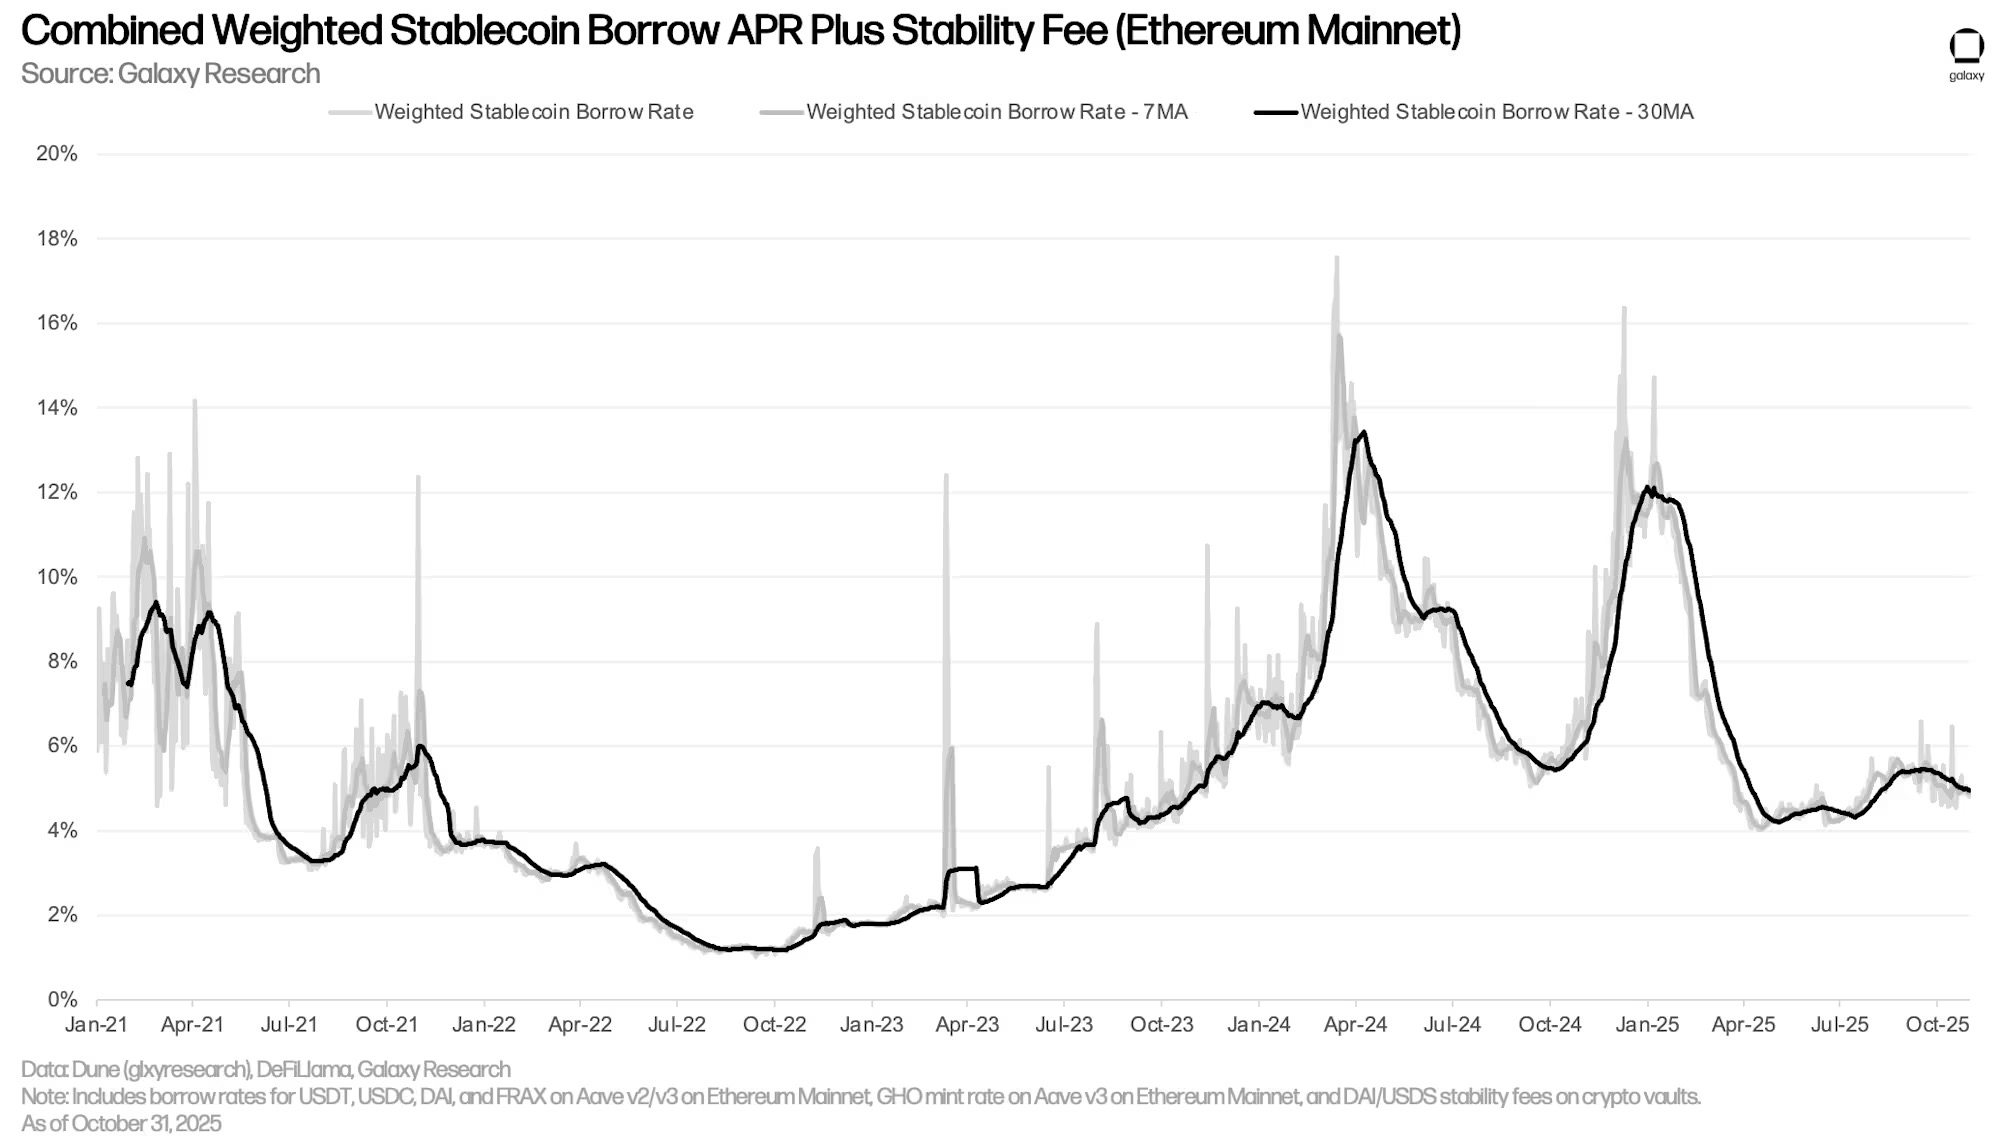
The following chart details the costs of borrowing stablecoins through lending applications, as well as the costs of minting CDP stablecoins using crypto collateral. The trends in these two rates are closely related, although the minting rates for CDP stablecoins tend to fluctuate less, as they are set manually at regular intervals and do not move in sync with the market.

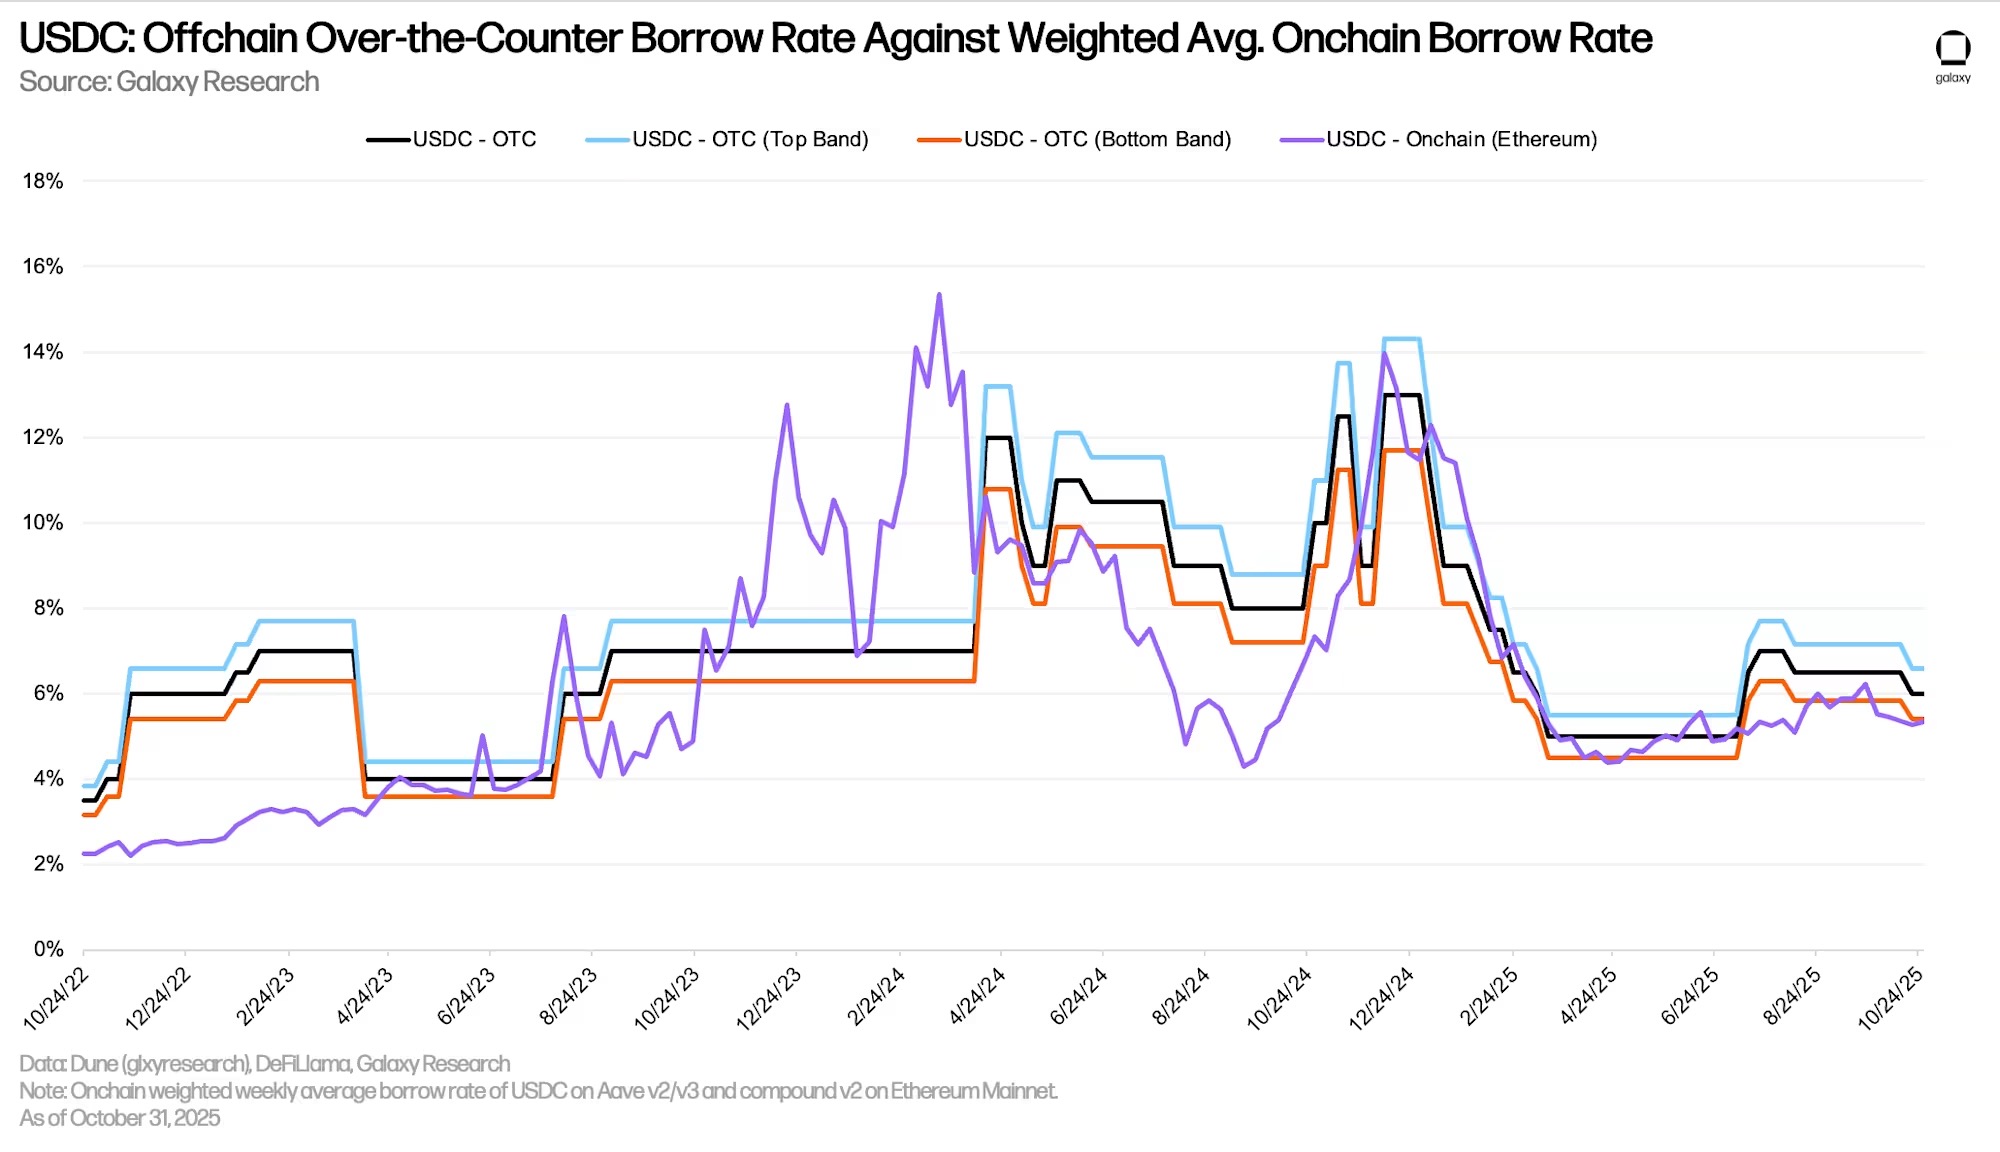
The off-chain benchmark rate for USDC increased this quarter, rising from 5% on June 30 to 6.5% on September 30. However, since then, this rate has slightly decreased to 6%. Throughout the quarter, the on-chain rate for USDC remained closer to the lower end of the off-chain rate range (lowest risk), and on a weekly average basis, it did not exceed the benchmark middle rate throughout the entire third quarter.
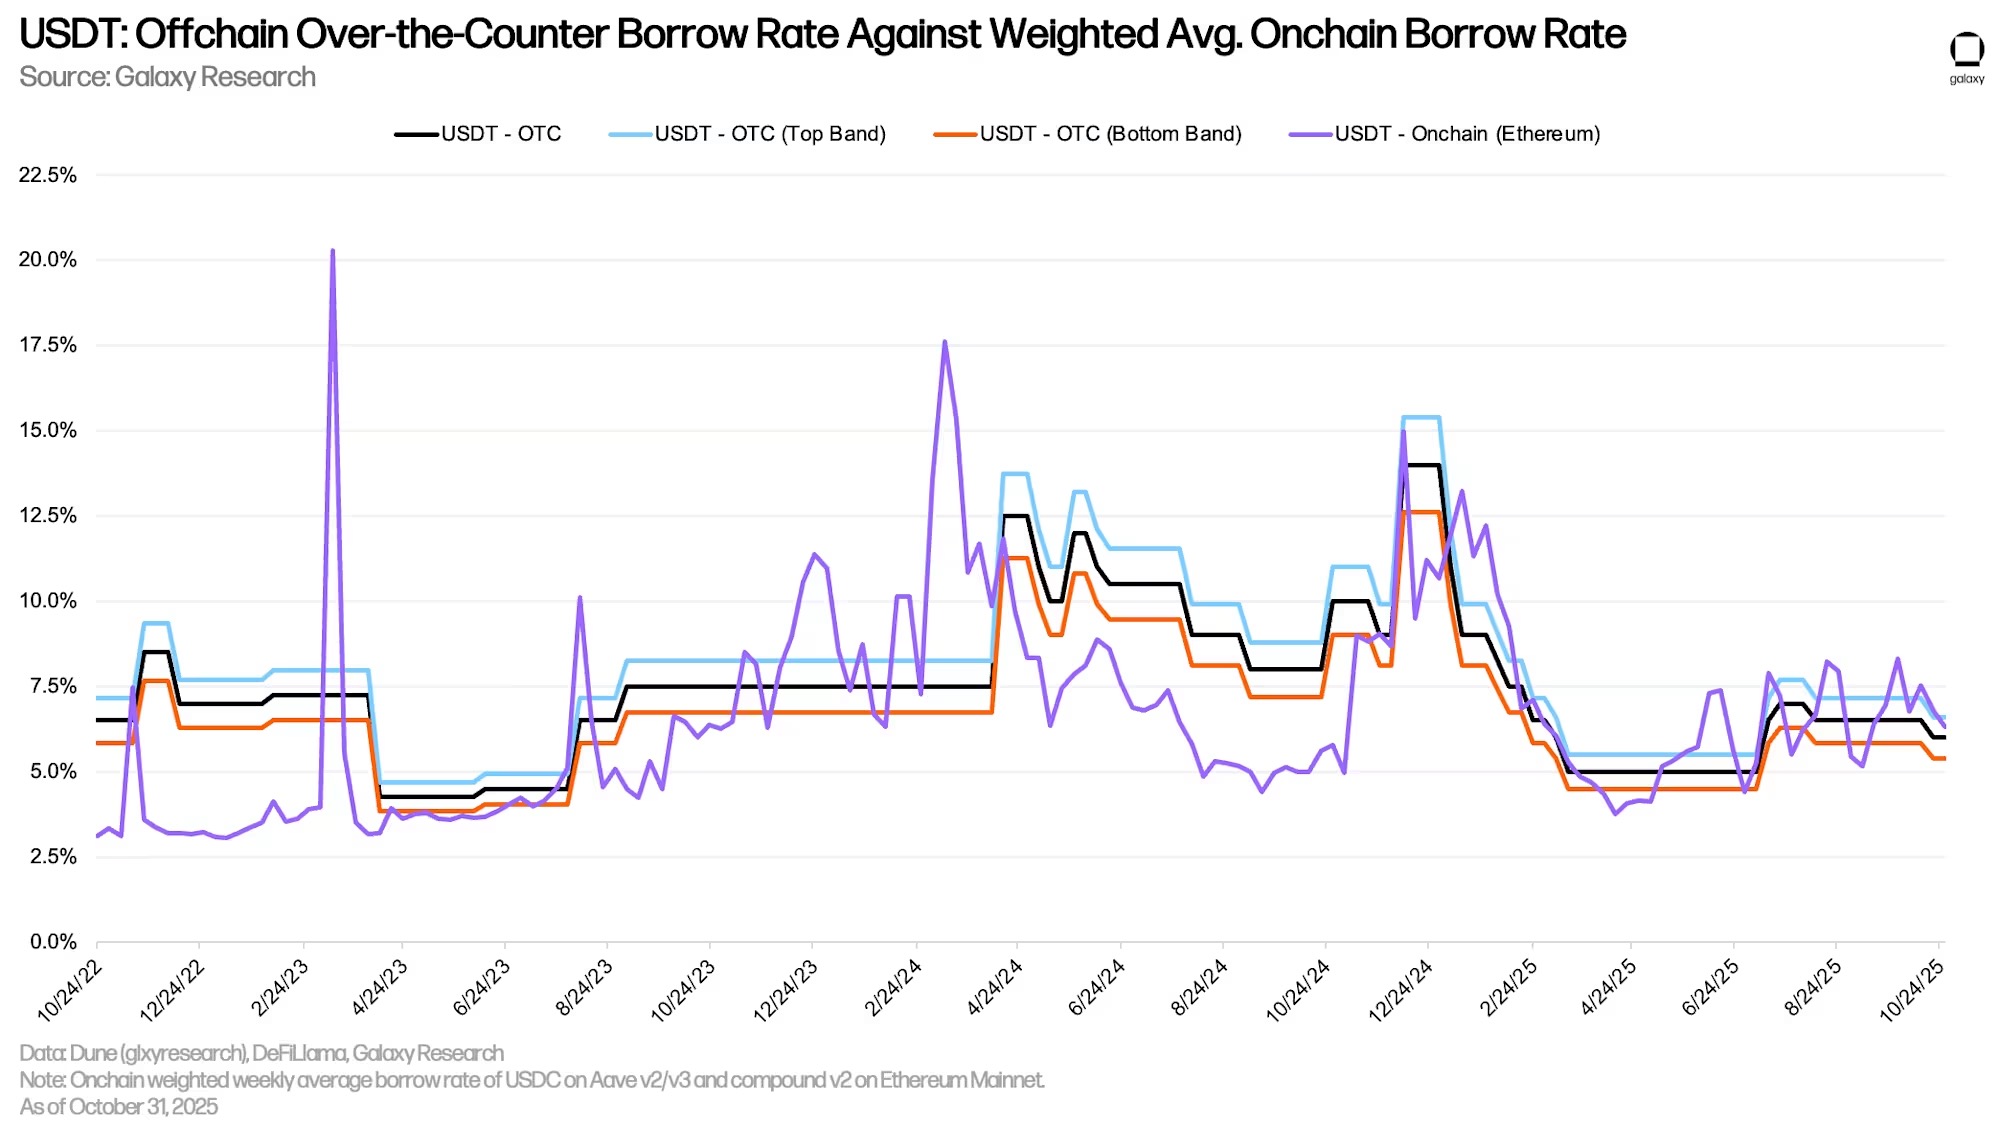
The following chart tracks the same rates as the previous chart, but for USDT borrowing. The on-chain rate for USDT has consistently aligned more closely with the off-chain middle rate than that of USDC.
Bitcoin
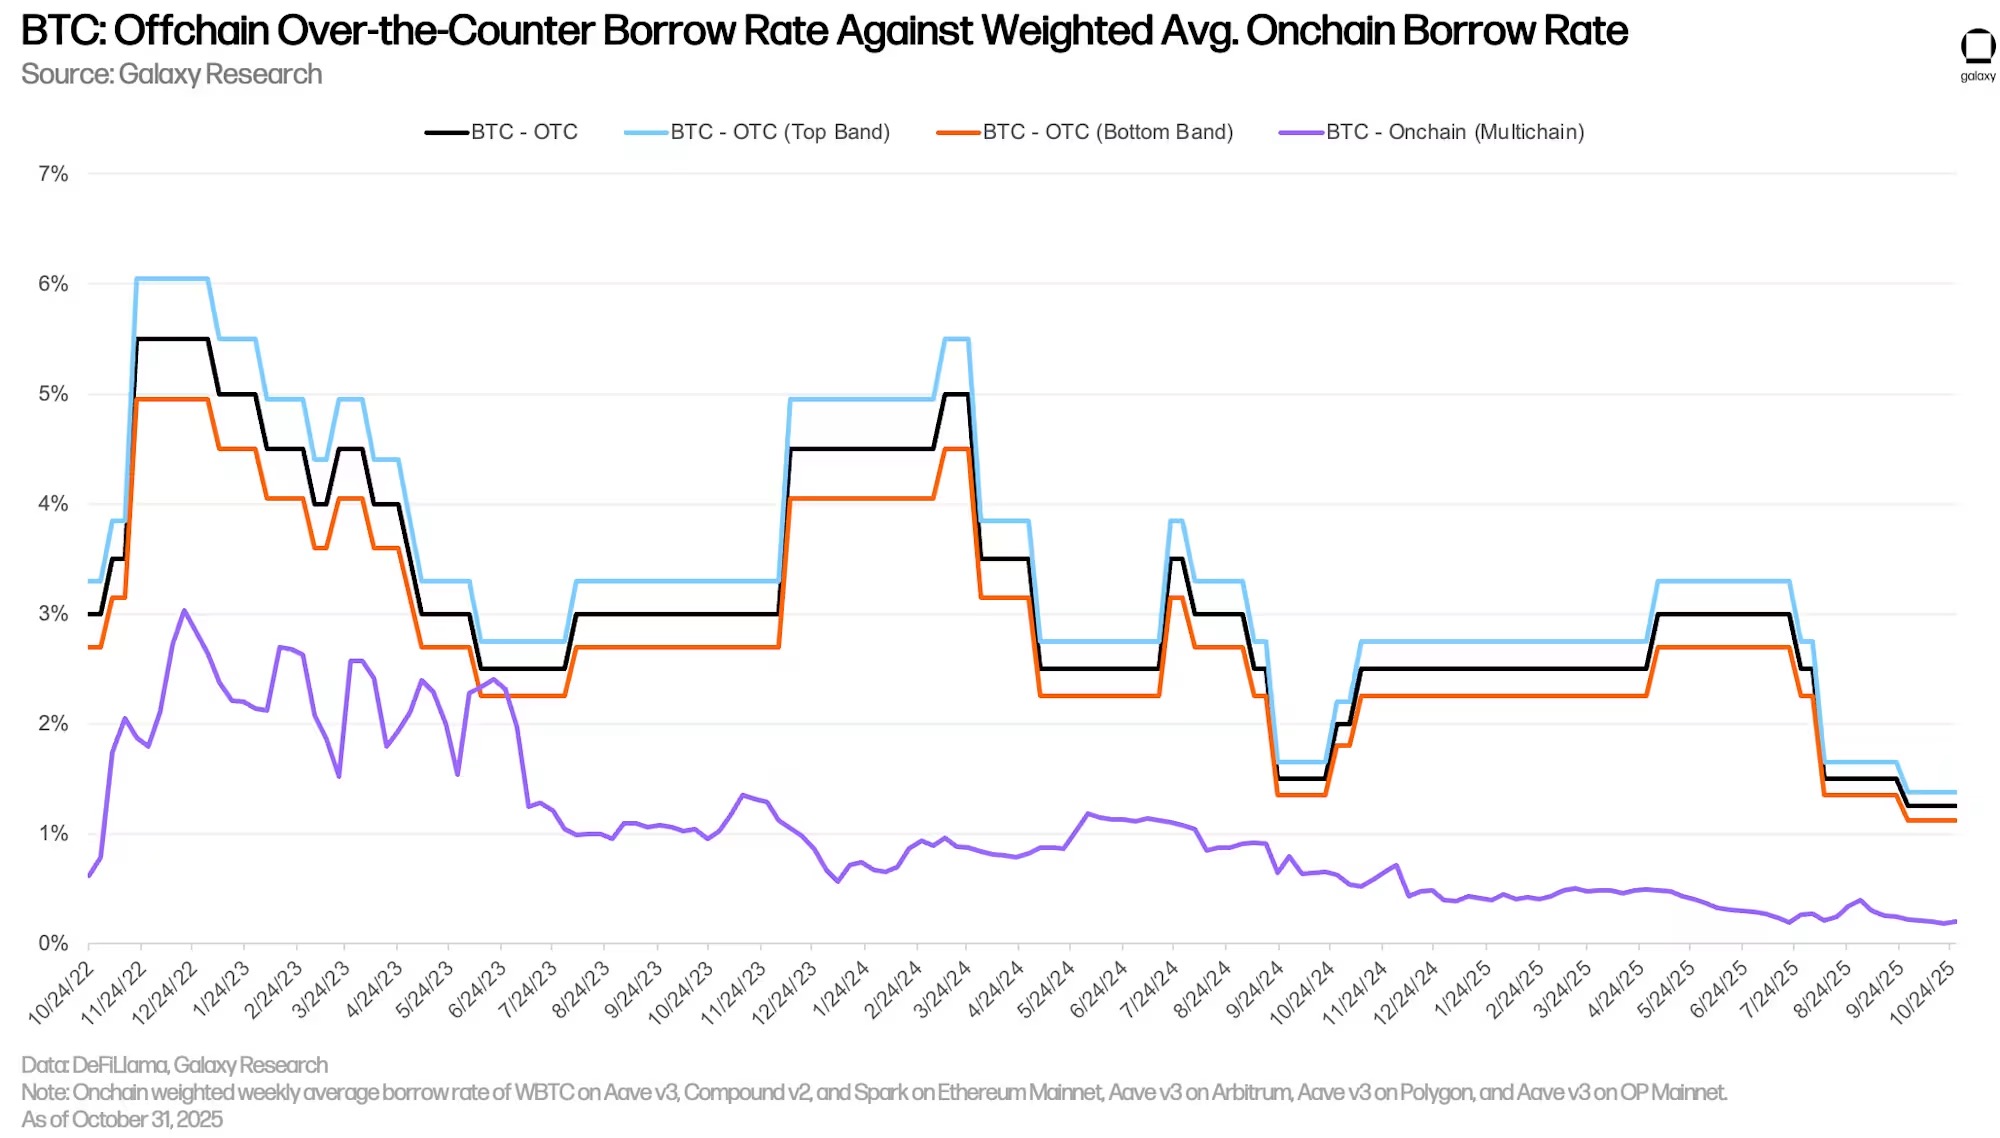
The chart below shows the weighted borrowing rates for Wrapped Bitcoin (WBTC) across multiple applications and on-chain lending platforms. The cost of borrowing WBTC on-chain is generally lower because Wrapped Bitcoin tokens are primarily used as collateral in on-chain markets, where borrowing demand is not high. Compared to stablecoins, the cost of borrowing Bitcoin on-chain remains stable, as users borrow and repay less frequently. Data shows that the on-chain borrowing rate for Bitcoin decreased from 0.28% at the end of the second quarter to 0.22% at the end of the third quarter.
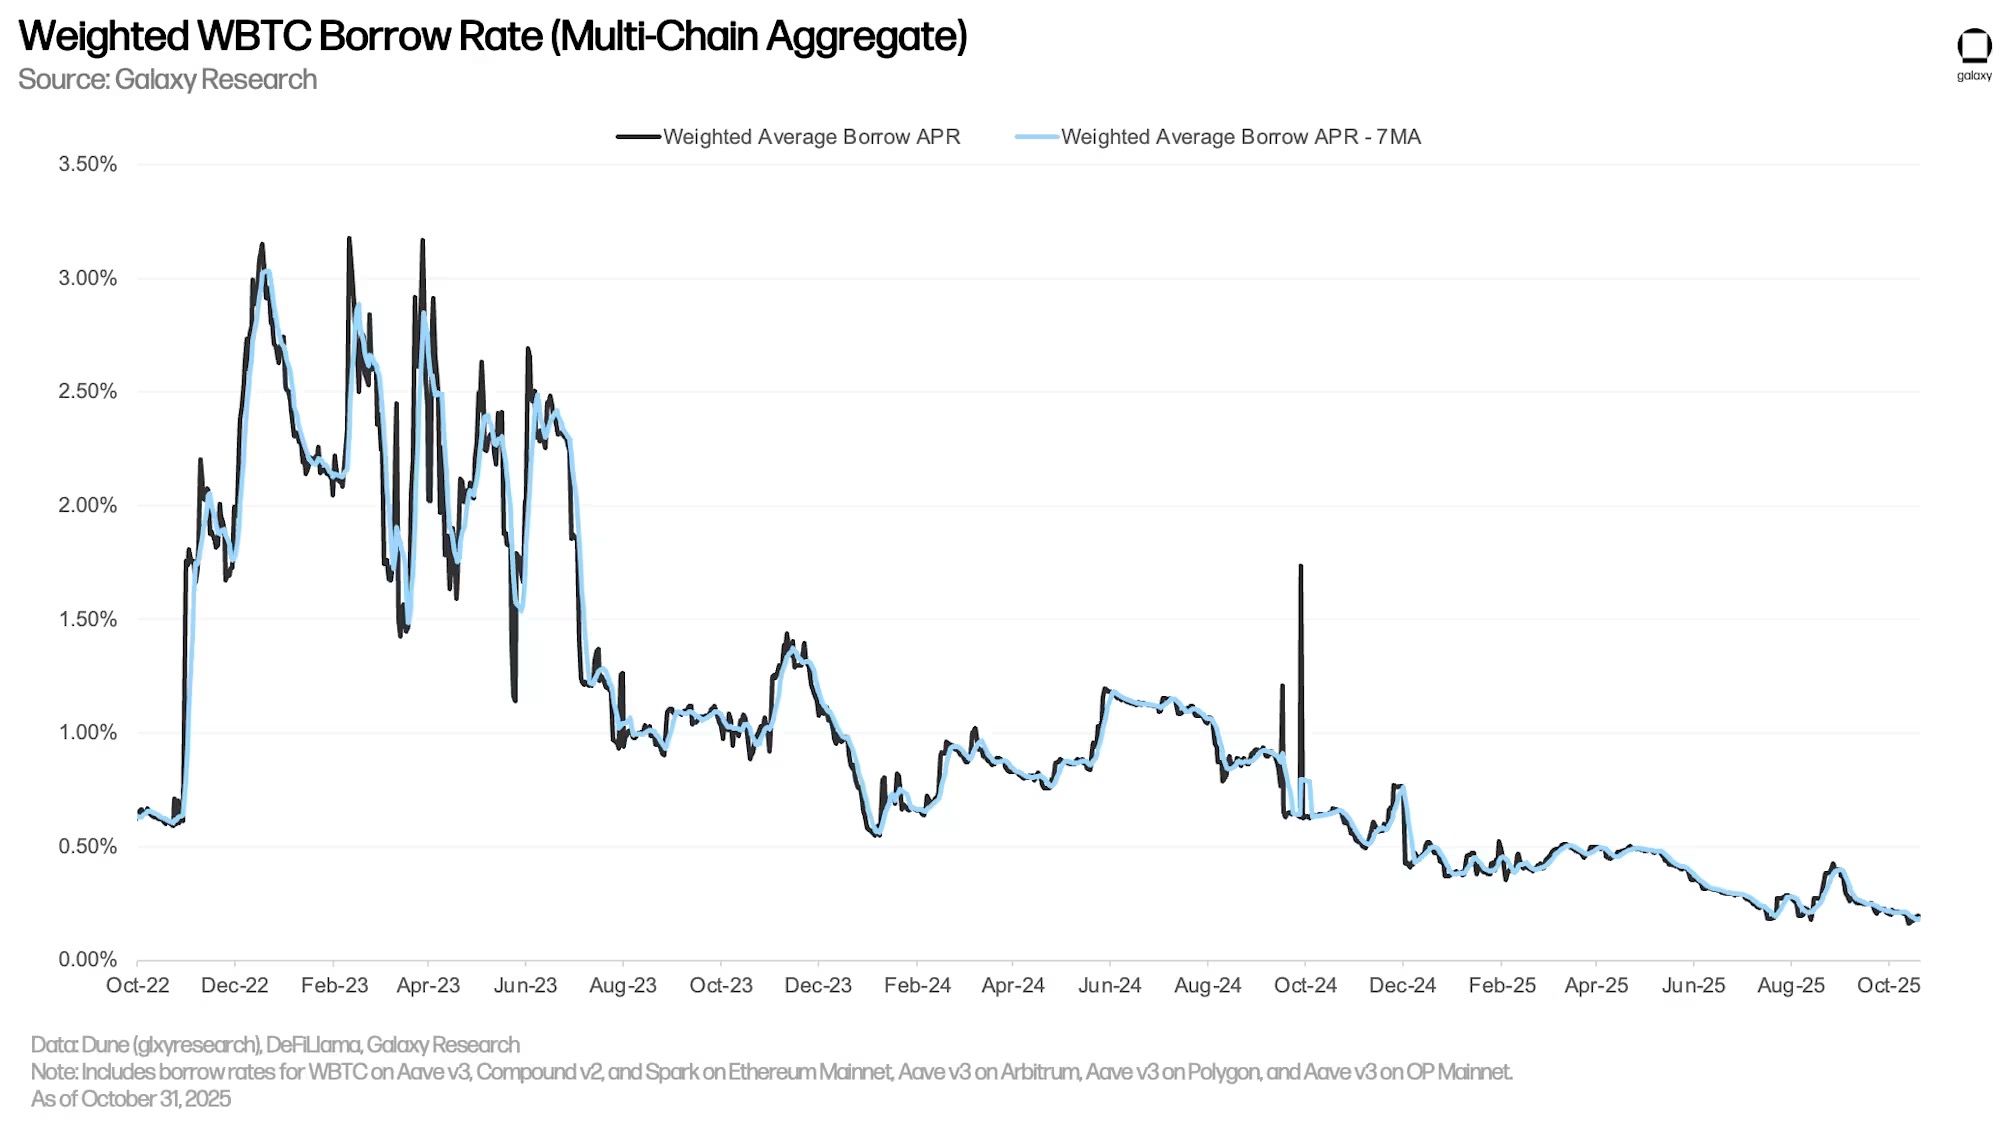
The historical difference between on-chain and off-chain (OTC) borrowing rates for Bitcoin persisted throughout the third quarter, despite a significant decline in off-chain Bitcoin borrowing rates. In the OTC market, the demand for borrowing Bitcoin is primarily driven by two factors: the demand to short Bitcoin and the use of Bitcoin as collateral for stablecoin and cash loans. The former is a source of demand that is not commonly seen in the on-chain lending market, resulting in a spread between on-chain and off-chain Bitcoin borrowing costs. This quarter, the off-chain rate for Bitcoin decreased by 175 basis points, from 3% to 1.25% as of September 30.
ETH and StETH
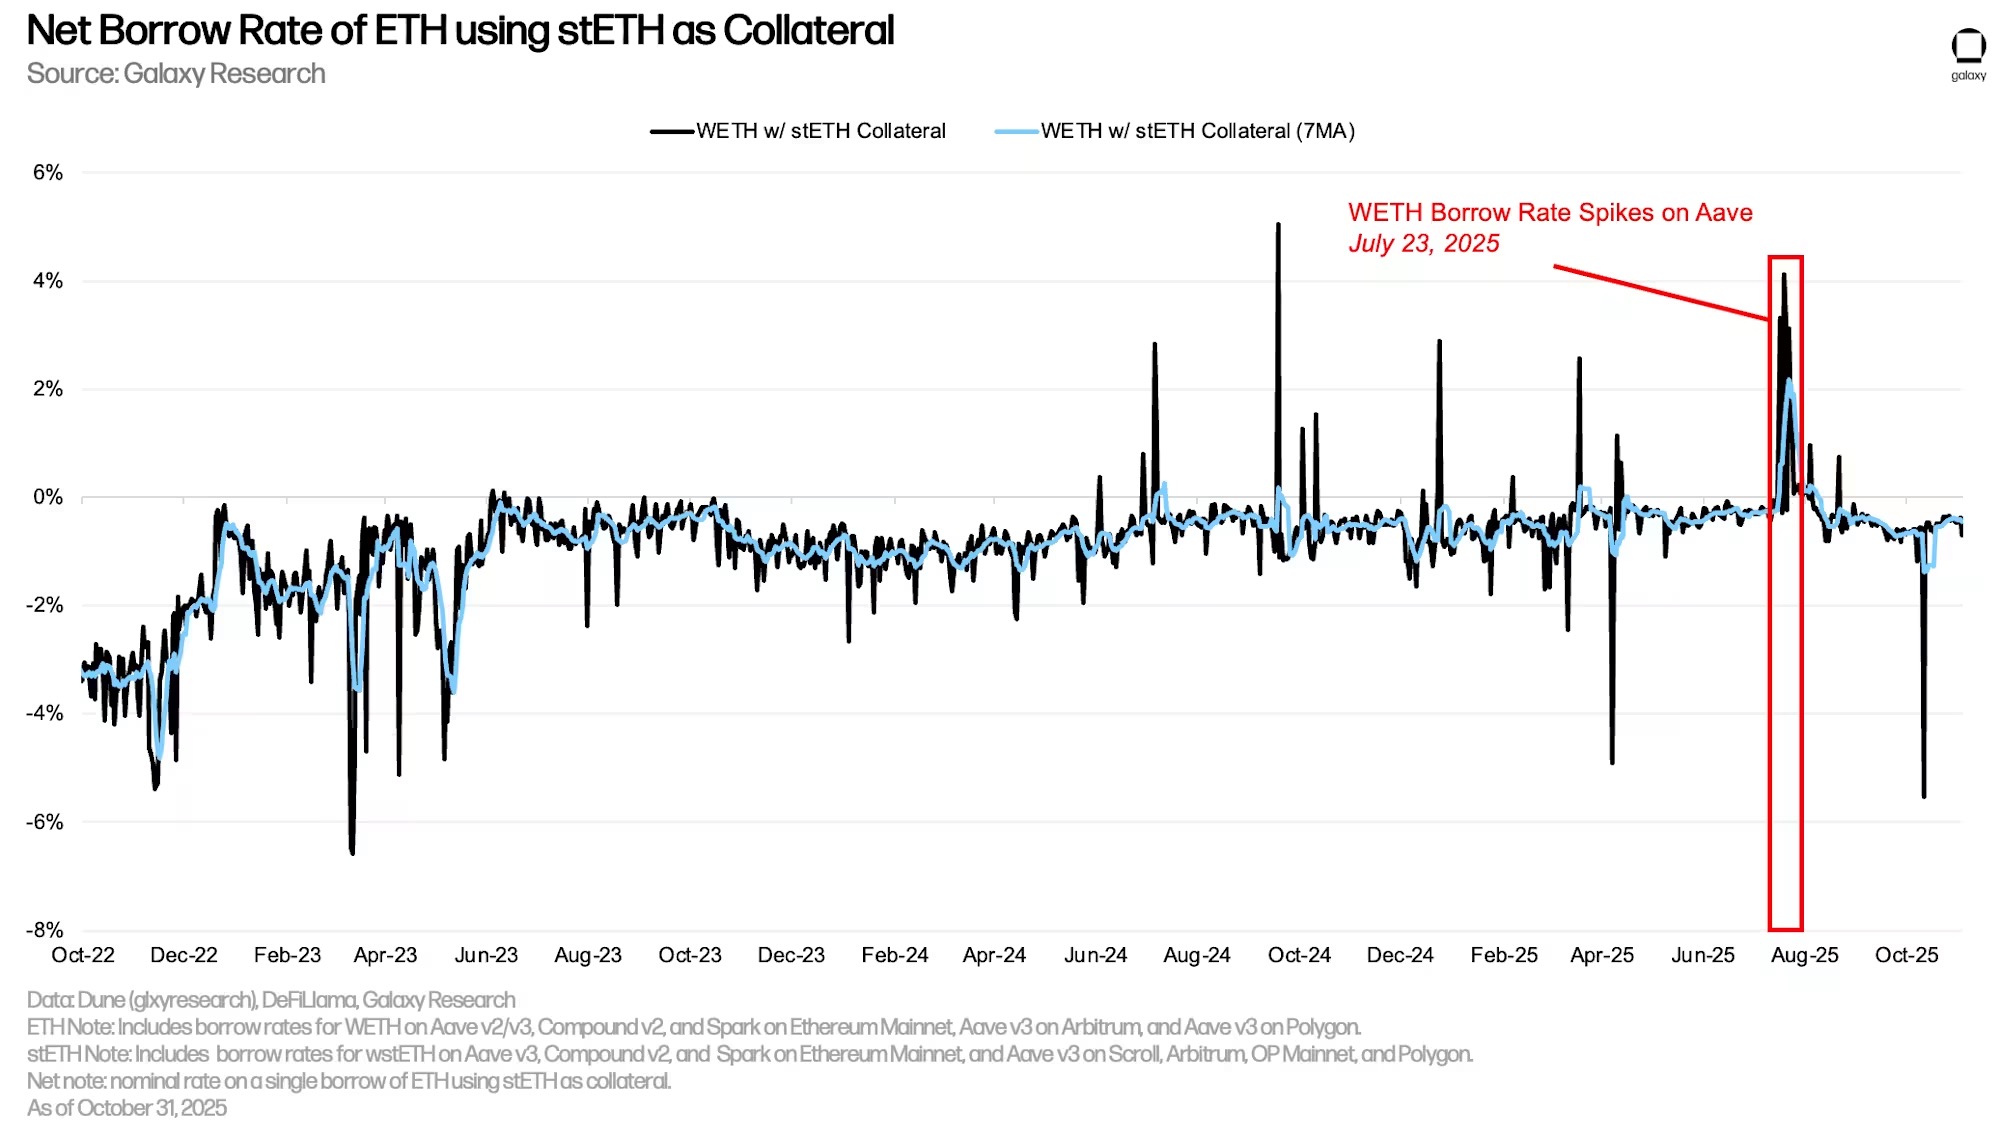
The chart below shows the weighted borrowing rates for ETH and stETH (staked Ethereum in the Lido protocol) across multiple applications and on-chain lending platforms. Historically, the cost of borrowing ETH has been higher than that of stETH, as users borrow ETH to implement looping strategies that leverage stETH as collateral to gain leveraged exposure to the staking annual yield of the Ethereum network. Therefore, the cost of borrowing ETH typically fluctuates within a range of 30-50 basis points above the staking annual yield of the Ethereum network. When the borrowing cost exceeds the staking yield, this strategy becomes uneconomical, and the borrowing annual rate rarely remains above the staking annual yield for long periods. However, due to a significant outflow of funds from Aave V3 Core on Ethereum in July, the borrowing rate for ETH spiked. The impact of this event will be detailed below.
Similar to WBTC, the cost of borrowing stETH is generally low because this asset is primarily used as collateral and rarely for other purposes.
By using yield-generating LSTs (liquid staking tokens) or LRTs (liquidity re-staking tokens) as collateral, users can obtain ETH loans at lower, and often negative, net borrowing rates. This cost-effectiveness has given rise to a looping strategy: users repeatedly use LSTs as collateral to borrow unstaked ETH, stake it, and then recycle the newly acquired LSTs to borrow more ETH, thereby amplifying their exposure to the ETH staking annual yield.
This strategy is only feasible when the borrowing cost of ETH is lower than the staking annual yield obtained through stETH. Most of the time, users can successfully execute this strategy. However, during the period from July 15 to 25, Aave V3 Core on Ethereum experienced an outflow of nearly 300,000 ETH. This led to a spike in the borrowing rate for ETH, making the looping strategy unprofitable (as shown by the net rate remaining above 0% in the chart below).
Since then, the ETH rate environment has stabilized, and the looping strategy has become profitable again. However, the scale of traders engaging in looping operations seems to have decreased, with the amount of ETH borrowed on Aave V3 Core dropping from about 2.3 million ETH in mid-July to about 2.1 million ETH on November 4.
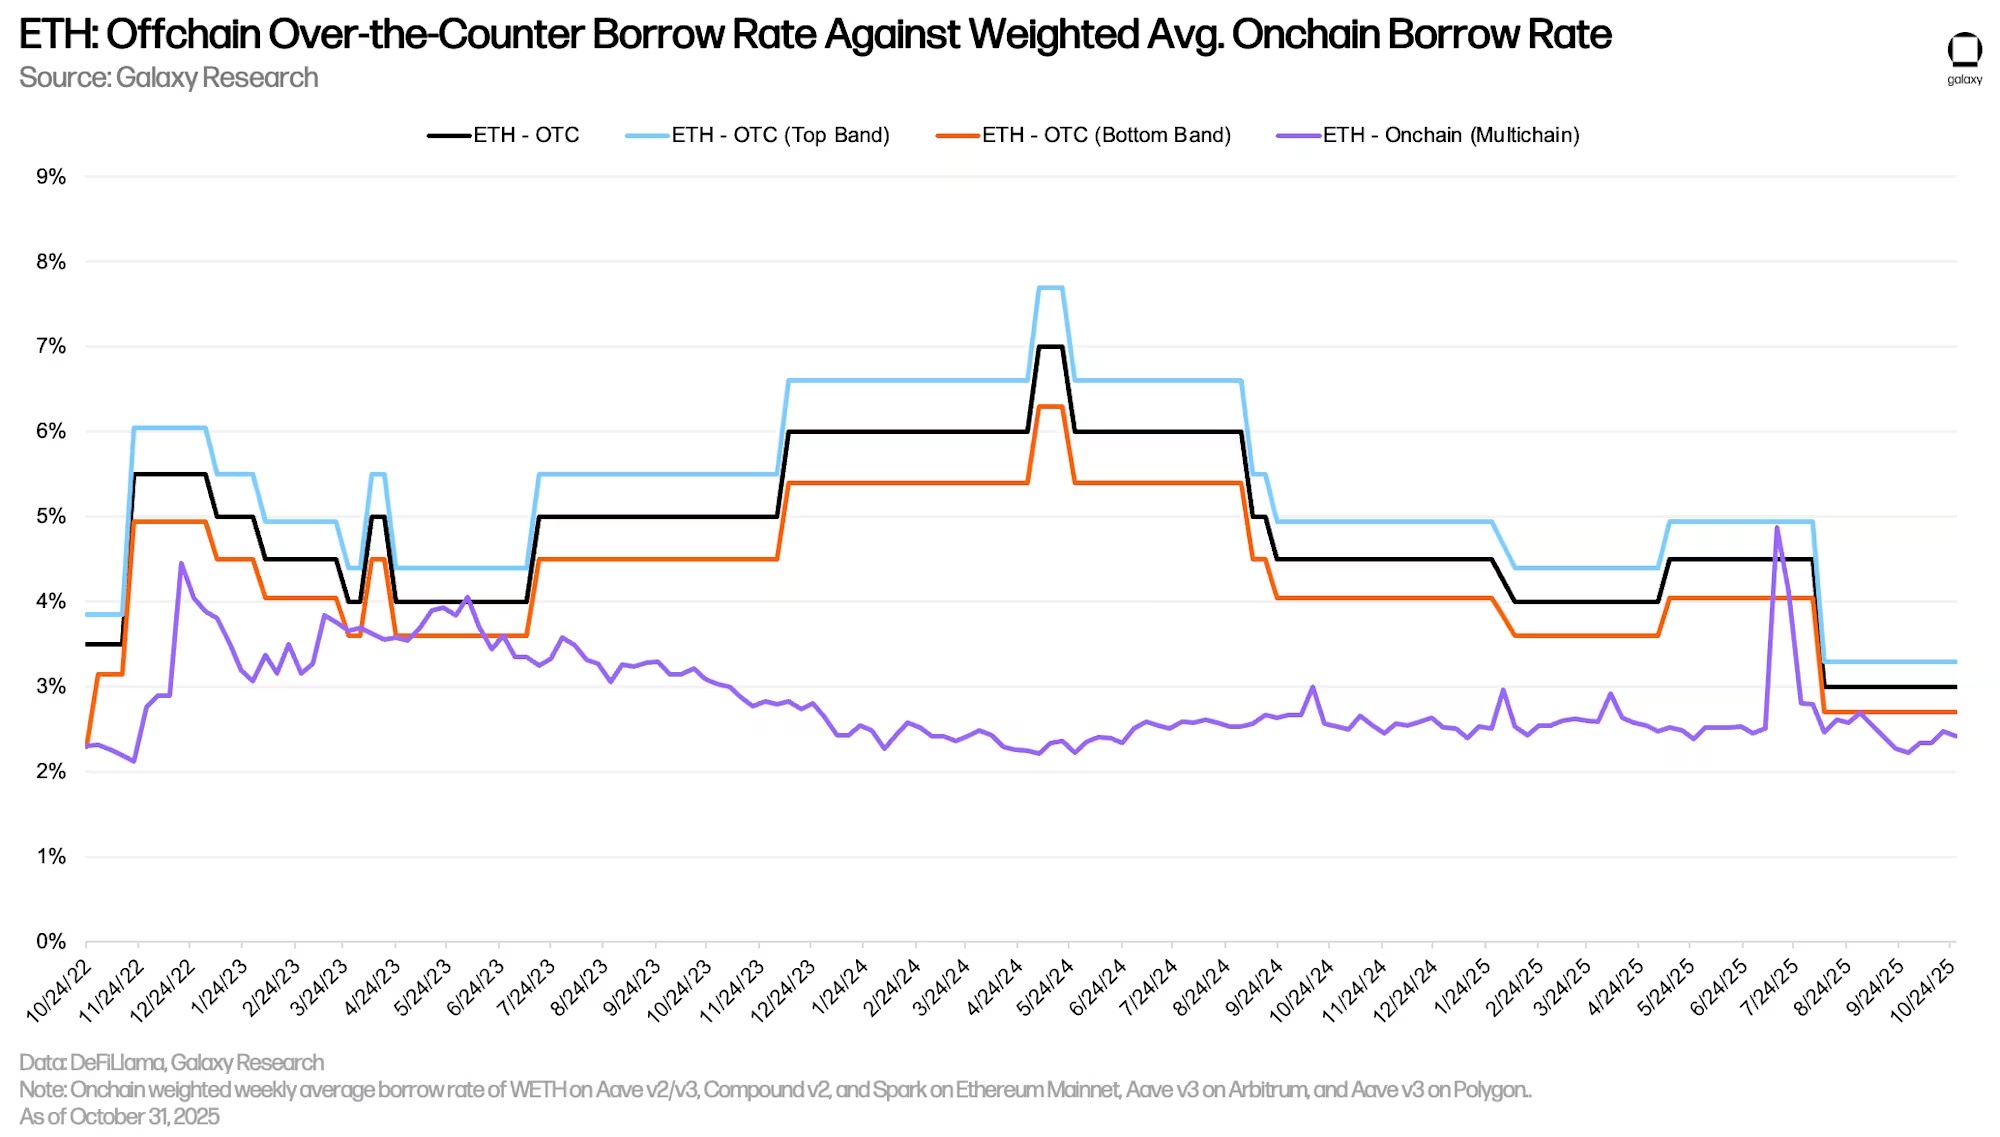
Off-chain ETH Rates
Similar to Bitcoin, the cost of borrowing ETH through on-chain lending applications is significantly lower than that through off-chain channels. This is primarily driven by two factors. First, similar to Bitcoin, short sellers generate borrowing demand through off-chain channels, which is not common on-chain; second, the staking annual yield of Ethereum constitutes the floor interest rate for off-chain borrowing, as if the rate is below the staking yield, asset providers have little incentive to deposit assets with off-chain institutions, and off-chain institutions lack the motivation to lend assets at rates below that level. Therefore, for ETH, the floor interest rate for off-chain borrowing is typically the staking annual yield, while on-chain, the staking annual yield is usually maintained as the upper limit of the interest rate by looping strategists.
Corporate Debt Strategies
Digital Asset Treasury (DAT) companies once again became a major focus in early Q3. The differentiating factor from the previous quarter was the surge in non-Bitcoin-related DAT companies. With Ethereum DAT companies like SBET and BitMine beginning to execute their treasury strategies, and the launch of Forward Industries expanding the landscape of Solana DAT, these companies gained more market attention.
Since the last report, we have made some adjustments to our definition logic for DAT. To provide the most accurate representation, we now define DAT as companies whose primary business may not necessarily be crypto-related but have strategies to incorporate crypto assets into their balance sheets. Given this adjustment and broader access to data on publicly listed companies, the company composition used in this analysis differs from previous reports.
Nonetheless, we are still tracking $12.055 billion in outstanding debt, which is used for direct purchases or to supplement the treasury strategies of DAT companies. Outstanding debt has stagnated for most of this year, with only a $422.5 million increase in Q3. Strategy still holds the most debt, amounting to $8.214 billion (excluding perpetual debt). The outstanding debt of Strategy remained unchanged quarter-over-quarter.
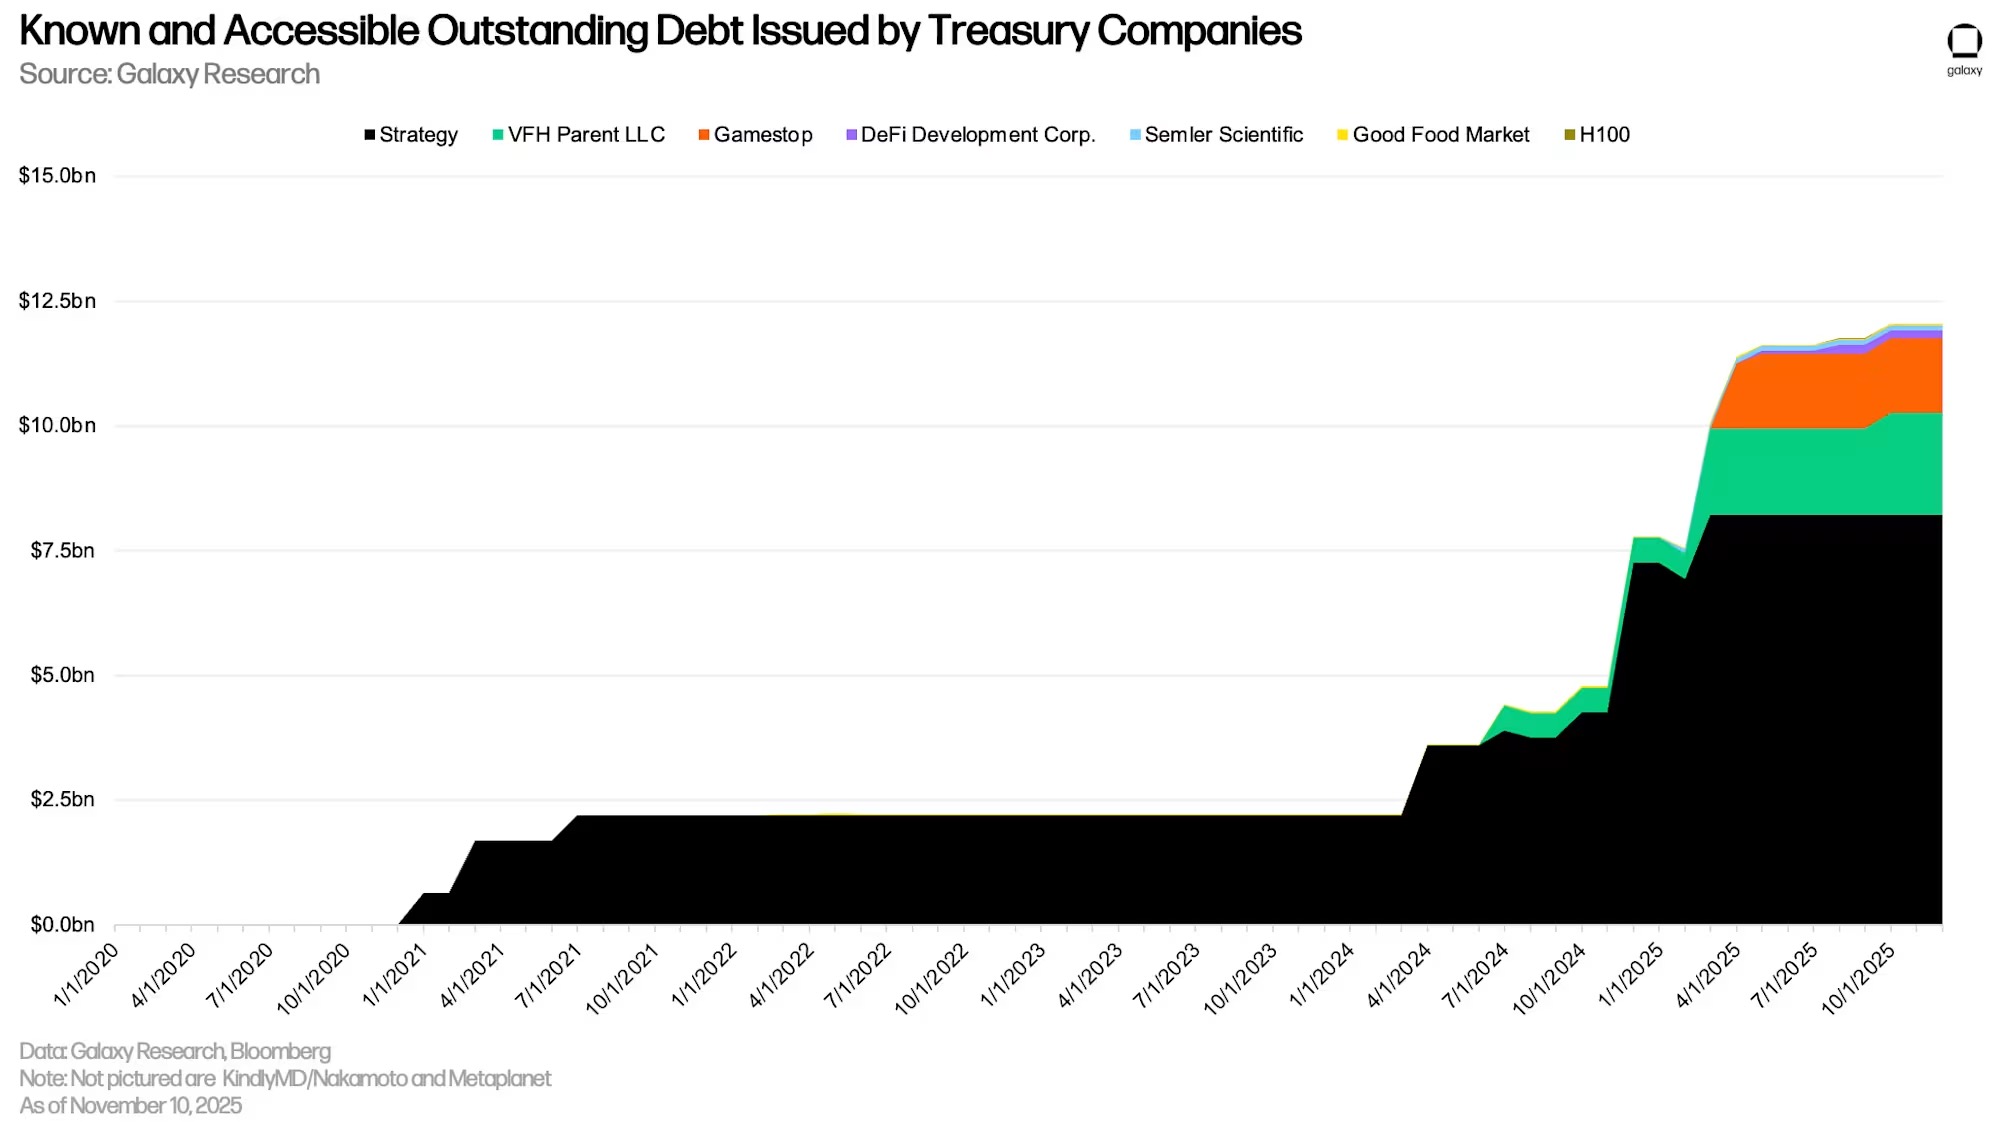
According to the updated logic, the timeline for the earliest maturity, redemption, or sale date of the debt issued by DAT has changed. Most of the DAT debt has its earliest maturity concentrated between June 2027 and October 2028.

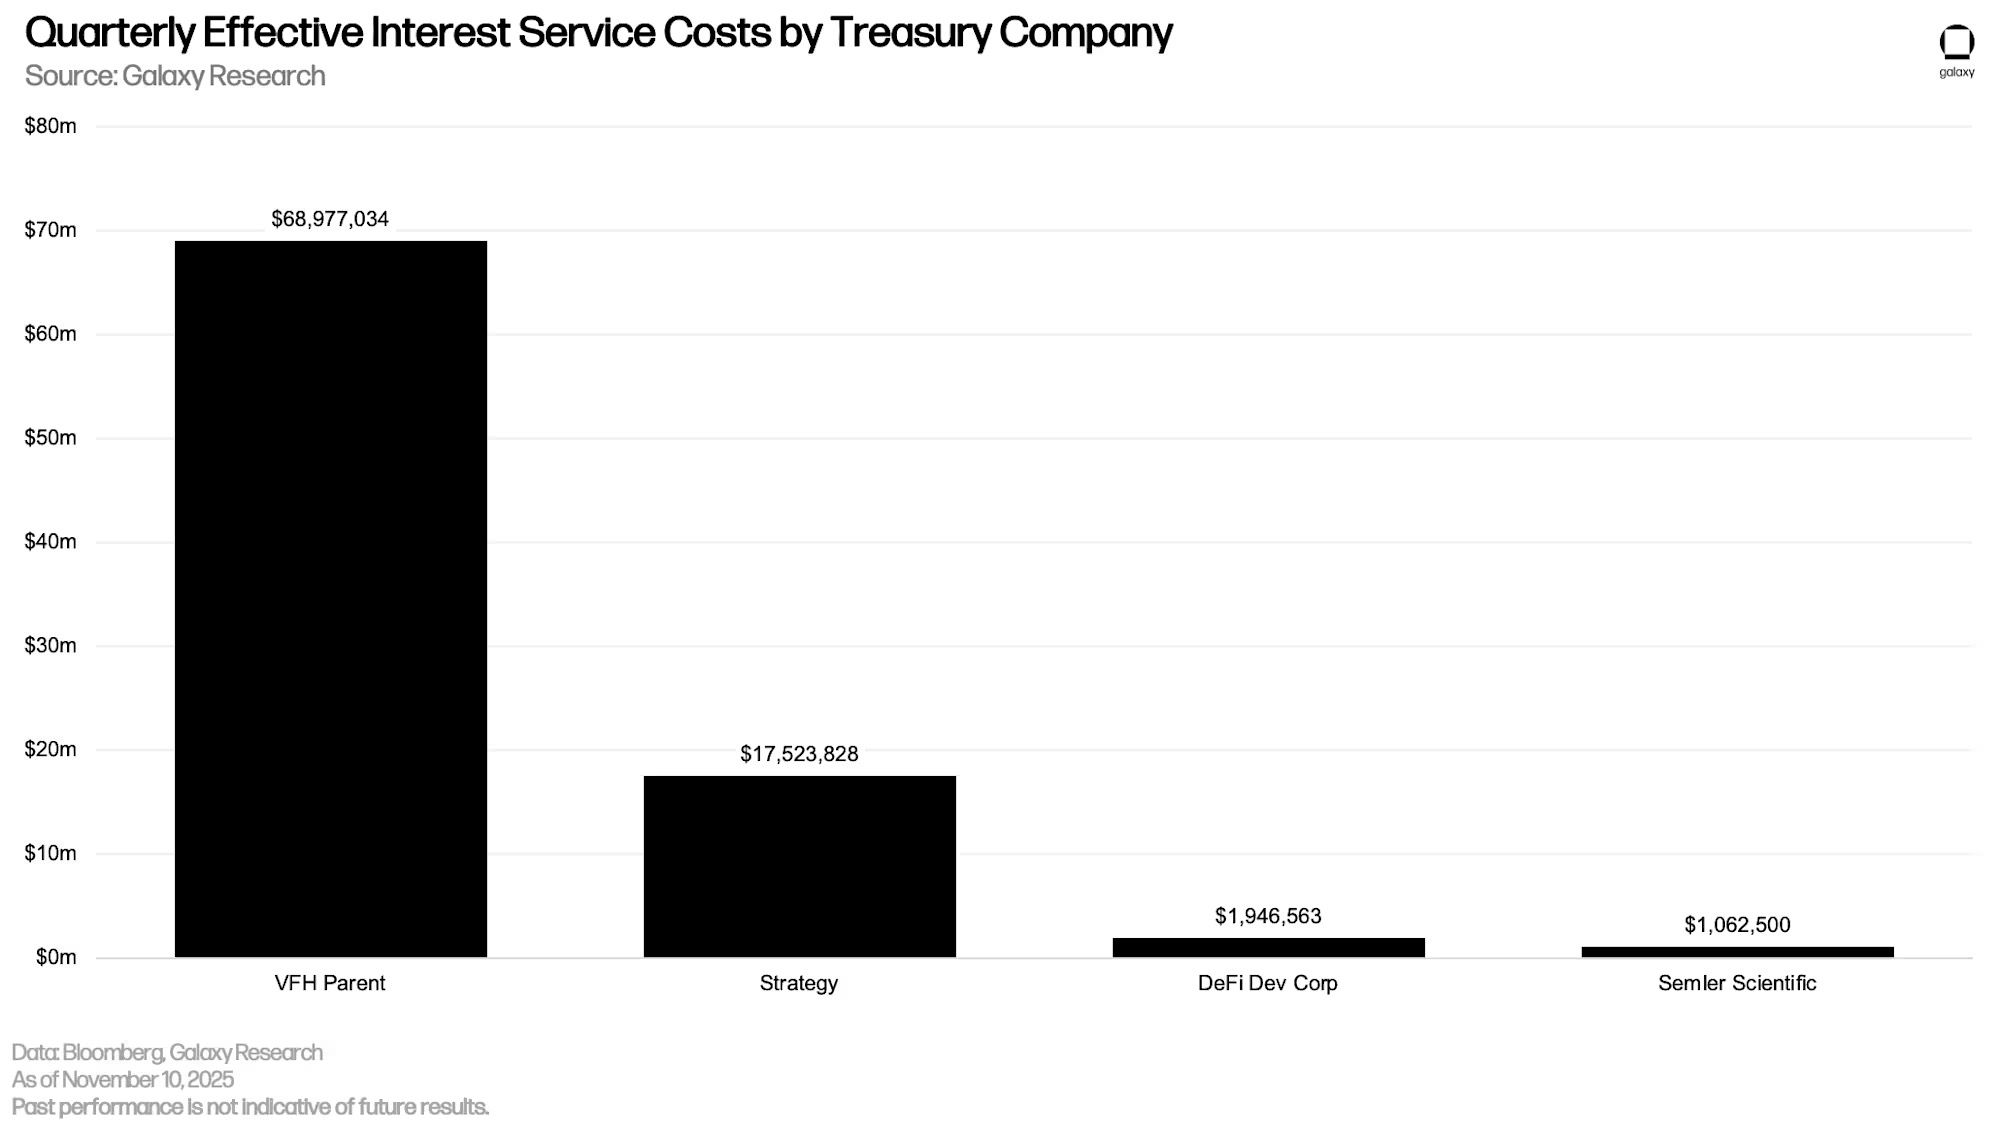
The actual interest payable for Strategy and Semler Scientific remained unchanged compared to the previous report, while the newly added VFH Parent and DeFi Development Corp. are required to pay $68.98 million and $1.95 million in interest, respectively.
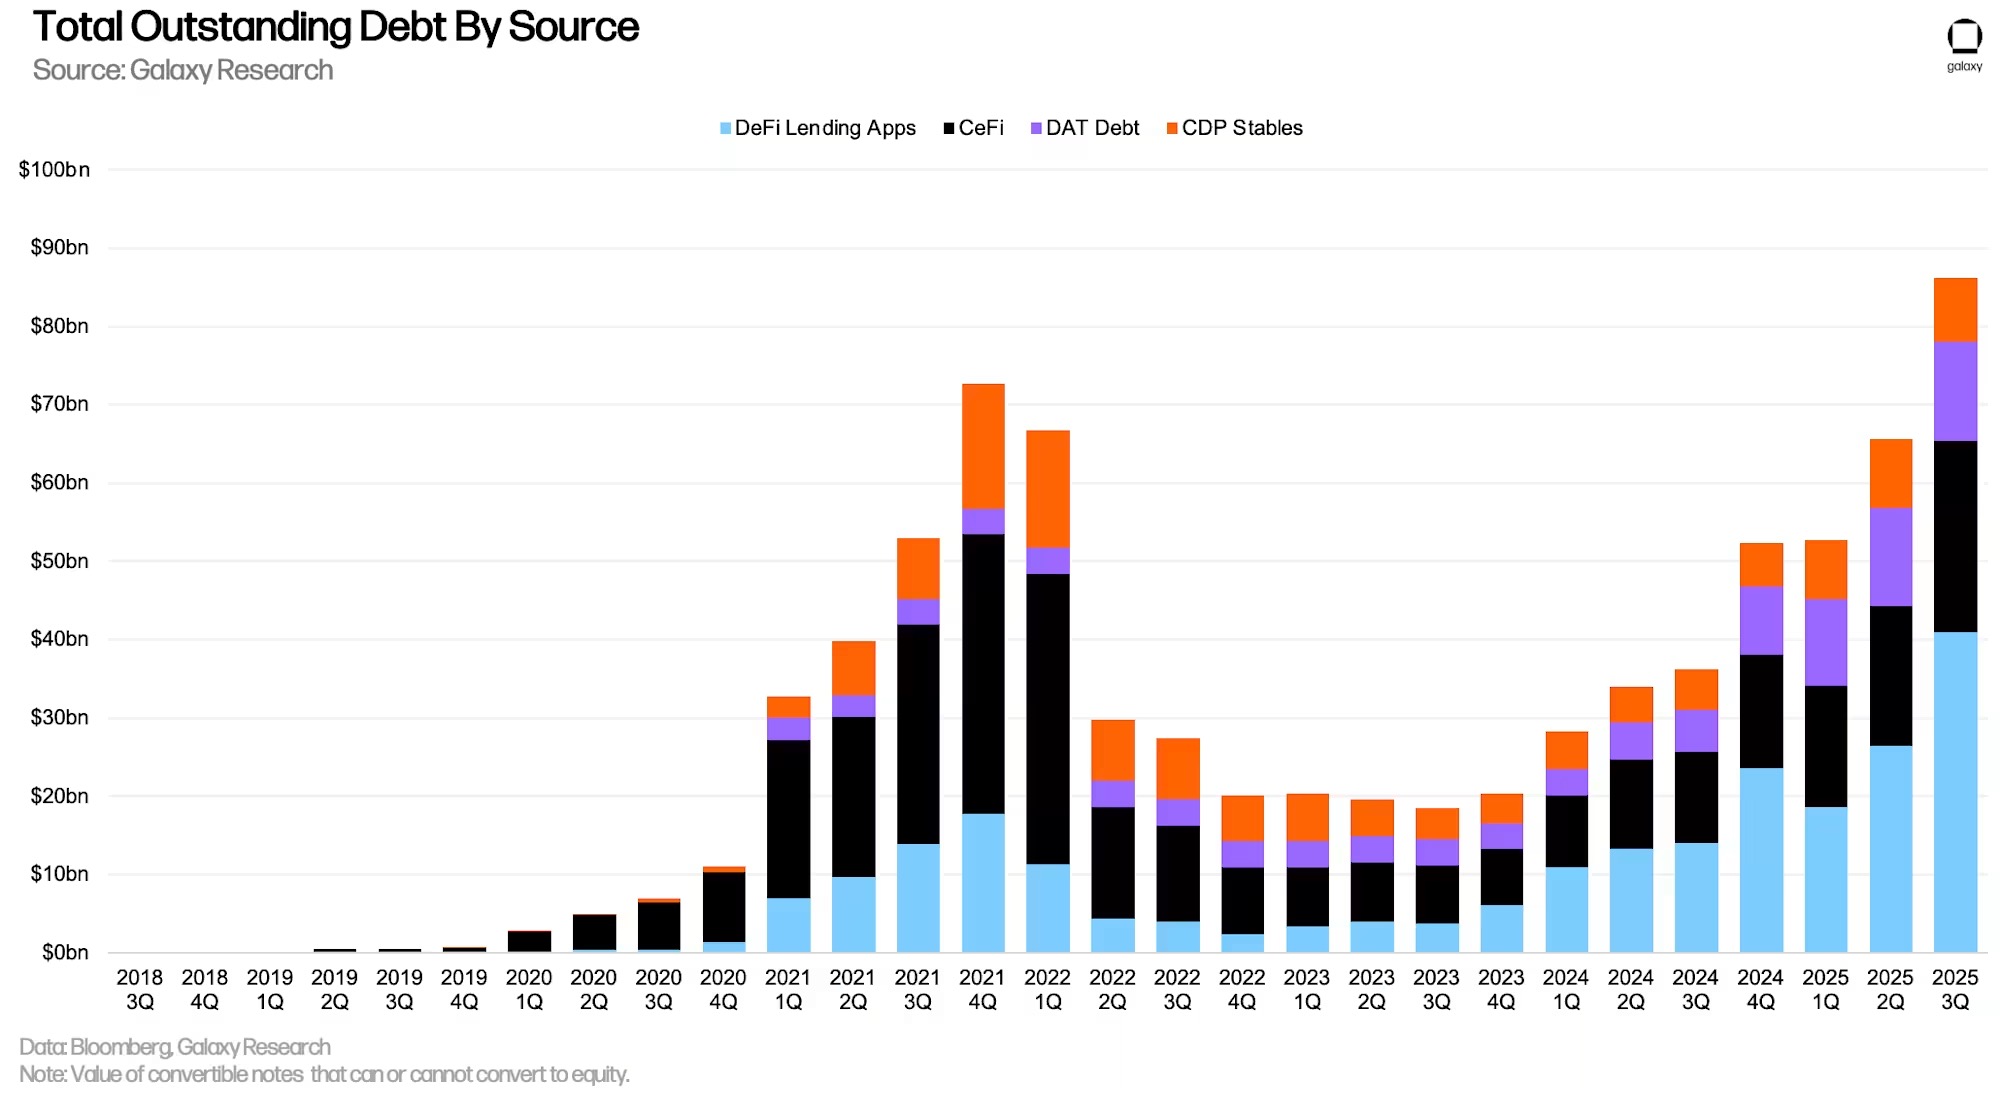
Total outstanding debt (including debt undertaken by DATs) reached a historical high of $86.26 billion in Q3, representing a quarter-over-quarter increase of 31.33%, with an absolute increase of $20.58 billion. This new historical high is $13.59 billion higher than the previous peak of $72.67 billion set in Q4 2021.
Futures Market
Open interest (OI) in futures, including perpetual futures, increased by 41.46% quarter-over-quarter, rising from $132.75 billion to $187.79 billion as of September 30, and subsequently reaching a historical high of $220.37 billion on October 6. The liquidation wave of perpetual contracts on October 10 caused open interest to drop by 30% overnight, from $207.62 billion on October 9 to $146.06 billion at the close on October 10.
Throughout the third quarter:
Open interest in Bitcoin futures increased by $9.41 billion (+14.45%), reaching $74.52 billion, and was $77.82 billion as of October 29.
Open interest in Ethereum futures increased by $22.37 billion (+76.61%), reaching $51.52 billion, and was $44.78 billion as of October 29.
Open interest in Solana futures increased by $6.05 billion (+91.94%), reaching $12.63 billion, and was $11.52 billion as of October 29.
Open interest in all other crypto assets increased by $17.21 billion, reaching $49.12 billion (+53.93%), and was $30.68 billion as of October 29.
It is important to note that the total data on futures open interest does not indicate whether traders are using 2x leverage or 100x leverage, nor does it reveal how much open interest comes from directional bets rather than hedging or delta-neutral structures. A portion of open interest is created by traders who hold the underlying asset and short perpetual contracts or futures for hedging purposes. These positions inflate open interest but do not add meaningful directional risk, making it difficult to assess the actual degree of leverage being used in the market based solely on the raw open interest data.

On October 10, the chain liquidation was the largest single-day futures liquidation event in history, with a total liquidation of over $19 billion for both long and short positions. Hyperliquid alone accounted for $10.27 billion in liquidations within 24 hours. Following that were Bybit and Binance, reporting $4.6 billion and $2.3 billion in liquidations, respectively.
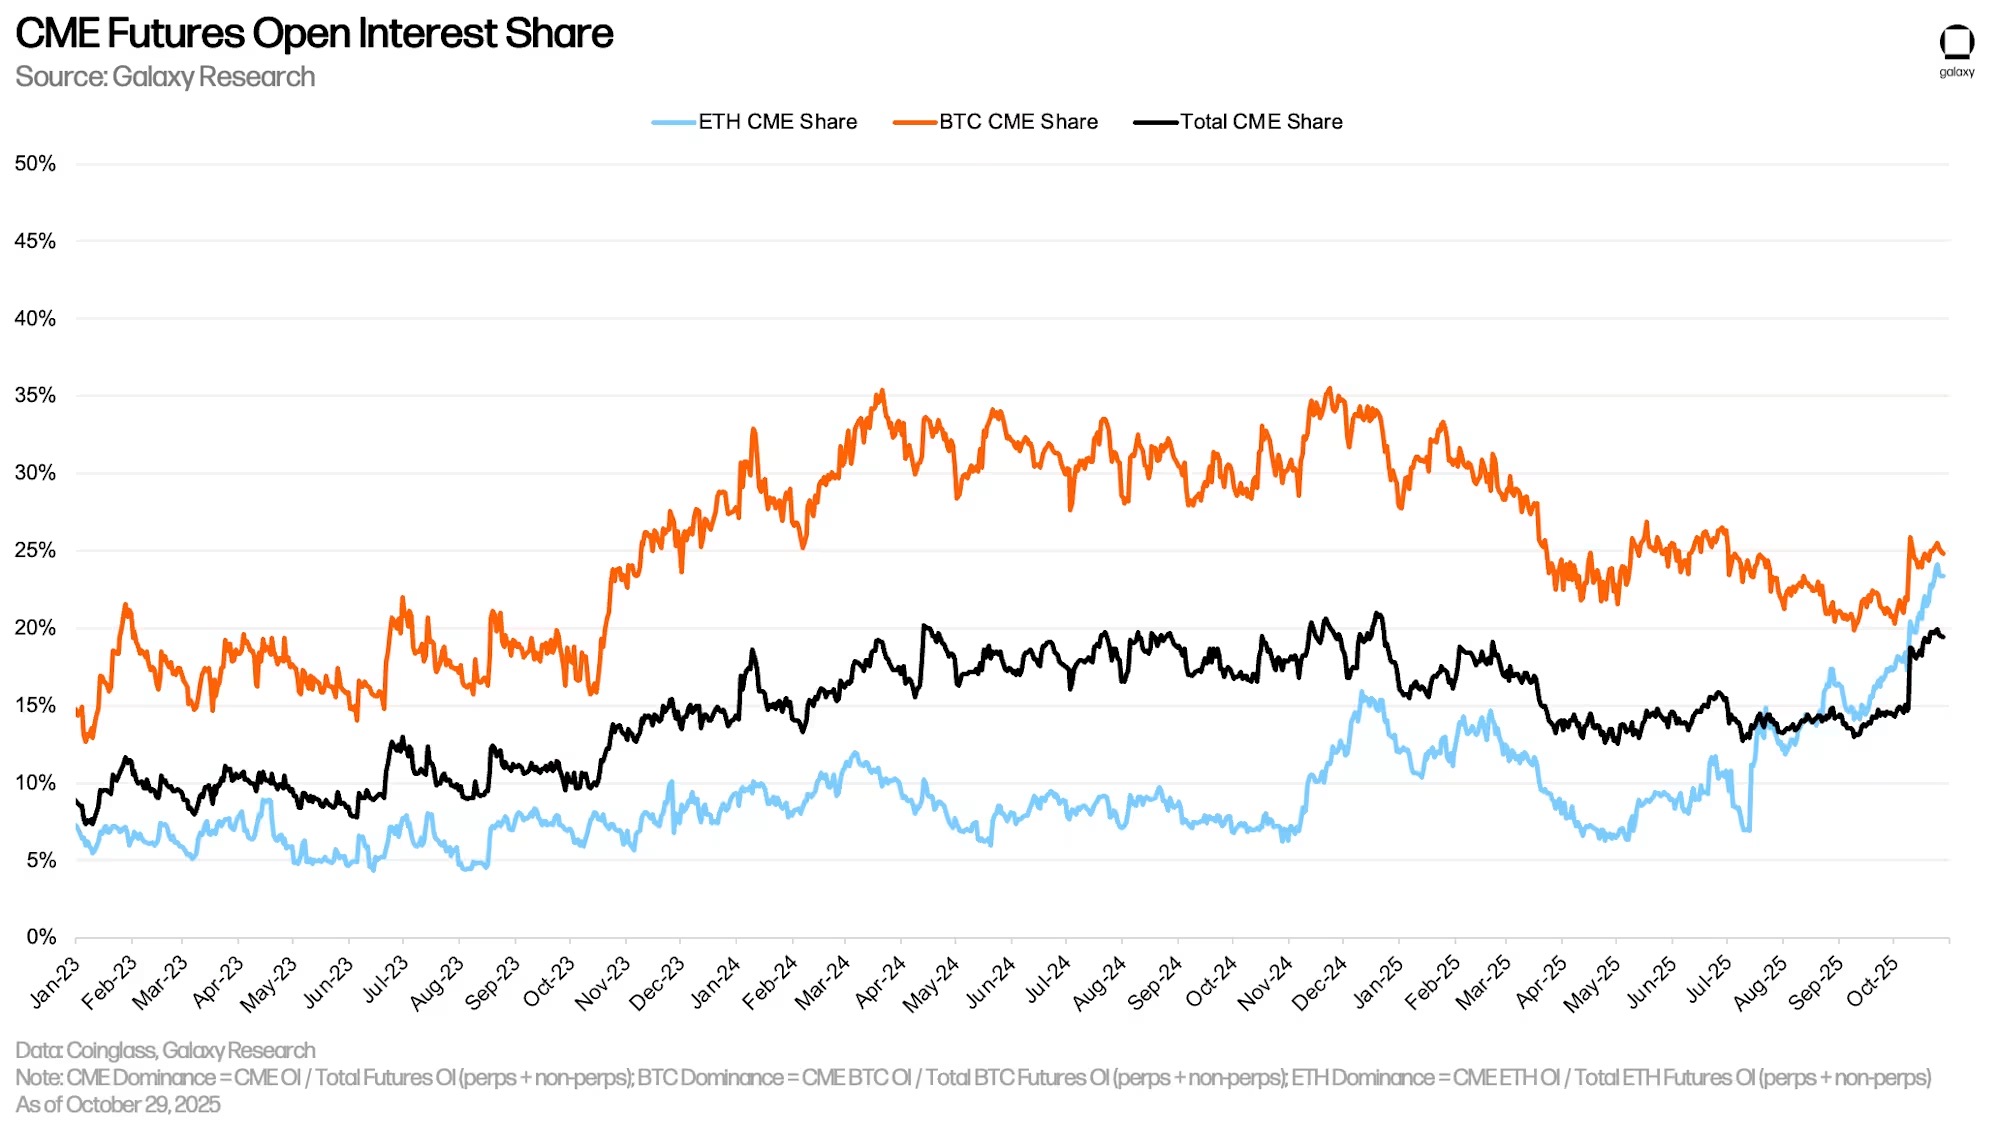
As of September 30, the CME (Chicago Mercantile Exchange) accounted for 14.4% of the total open interest in futures, including perpetual and non-perpetual contracts, a decrease of 109 basis points quarter-over-quarter. Of this, the CME's share of total open interest in Ethereum (calculated as CME Ethereum open interest divided by total market open interest) was 17.28% (an increase of 651 basis points quarter-over-quarter); while the CME's share of total open interest in Bitcoin was 20.78% (a decrease of 554 basis points). The leverage liquidation event on October 10 caused the CME's share of futures open interest to rise by 398 basis points overnight, from 14.78% to 18.76%.
Perpetual Futures
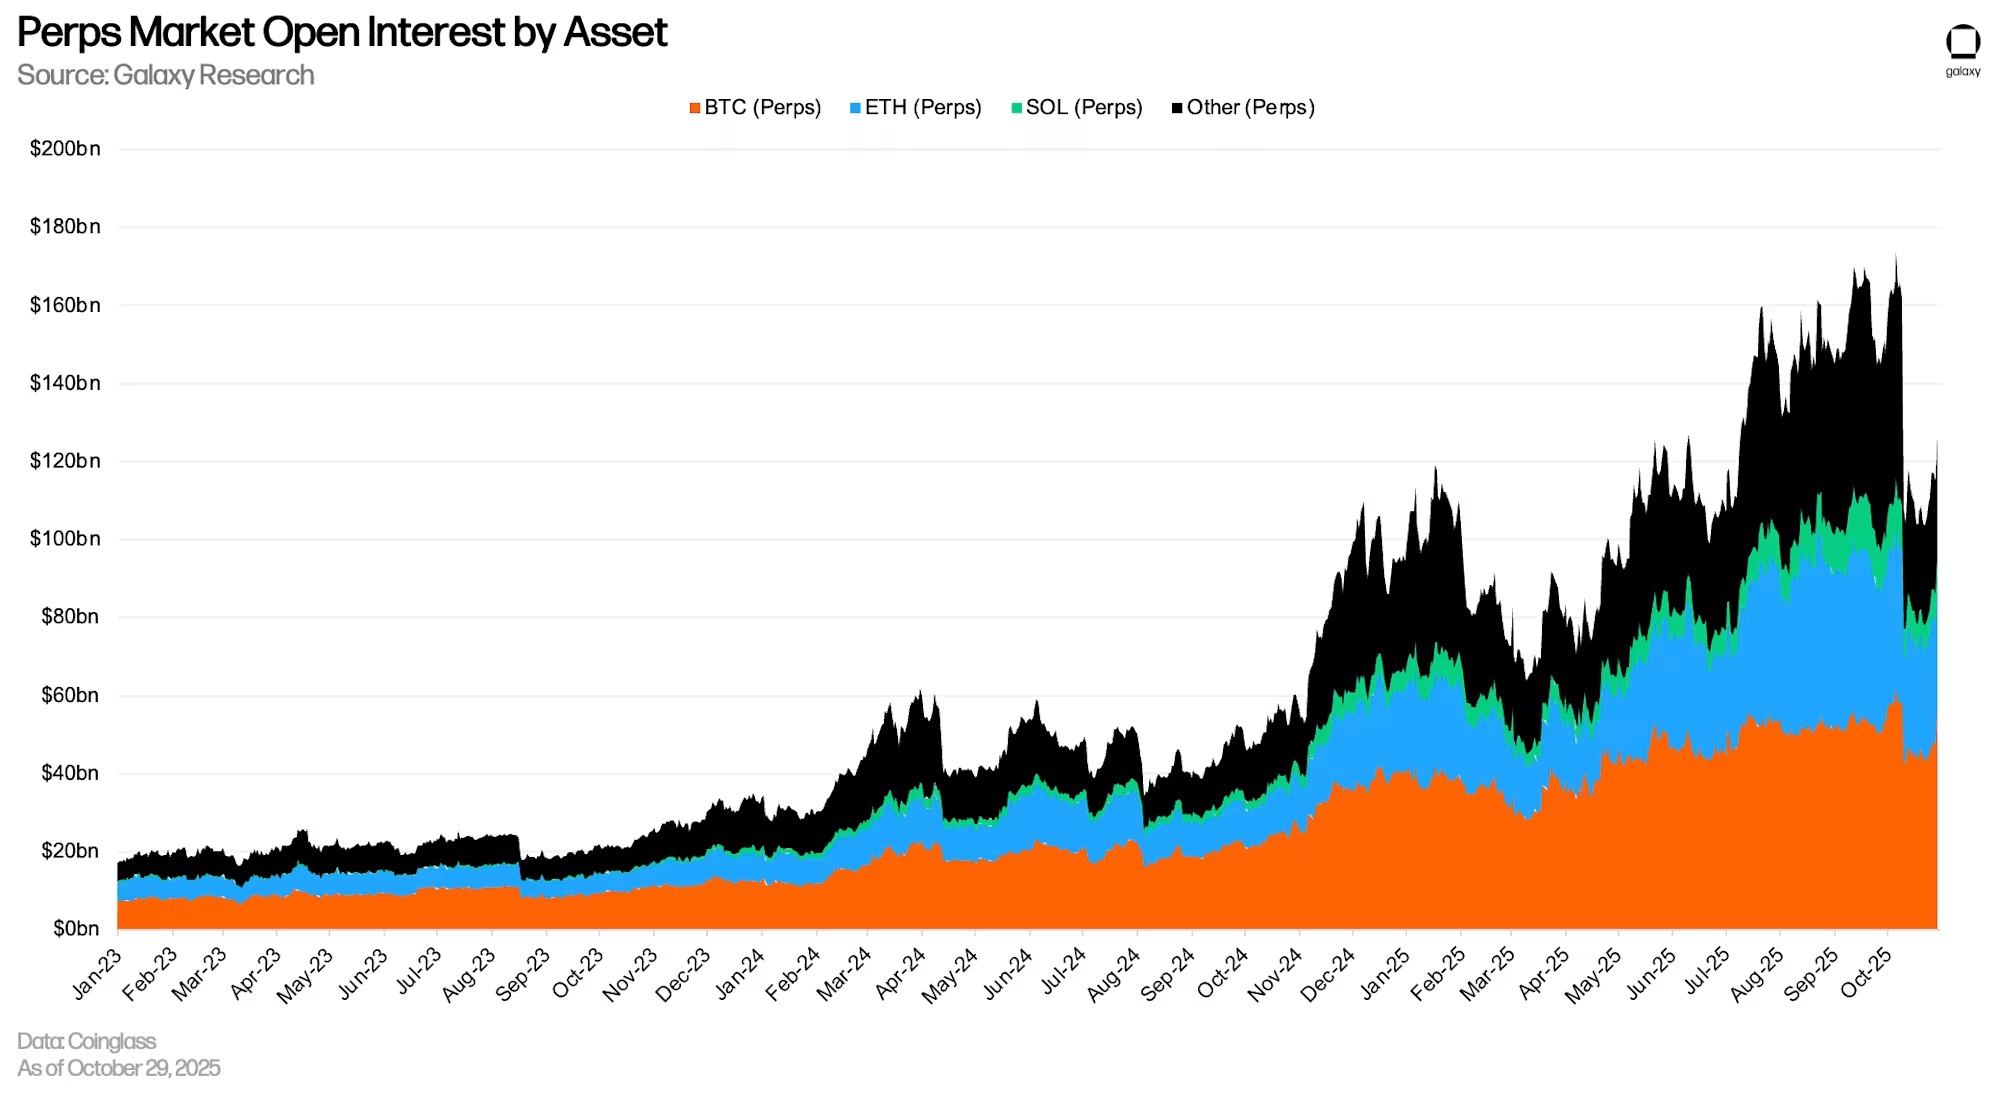
As of September 30, the open interest in perpetual futures was $147.55 billion, an increase of $38.62 billion (+36.05%) from the end of Q2. As of October 29, the open interest in perpetual futures decreased by 27.14% from the historical high of $173.41 billion reached on October 6. The market share of Bitcoin perpetual contracts was 45.15%, Ethereum was 24.24%, Solana was 7.47%, and all other assets accounted for 23.15%.
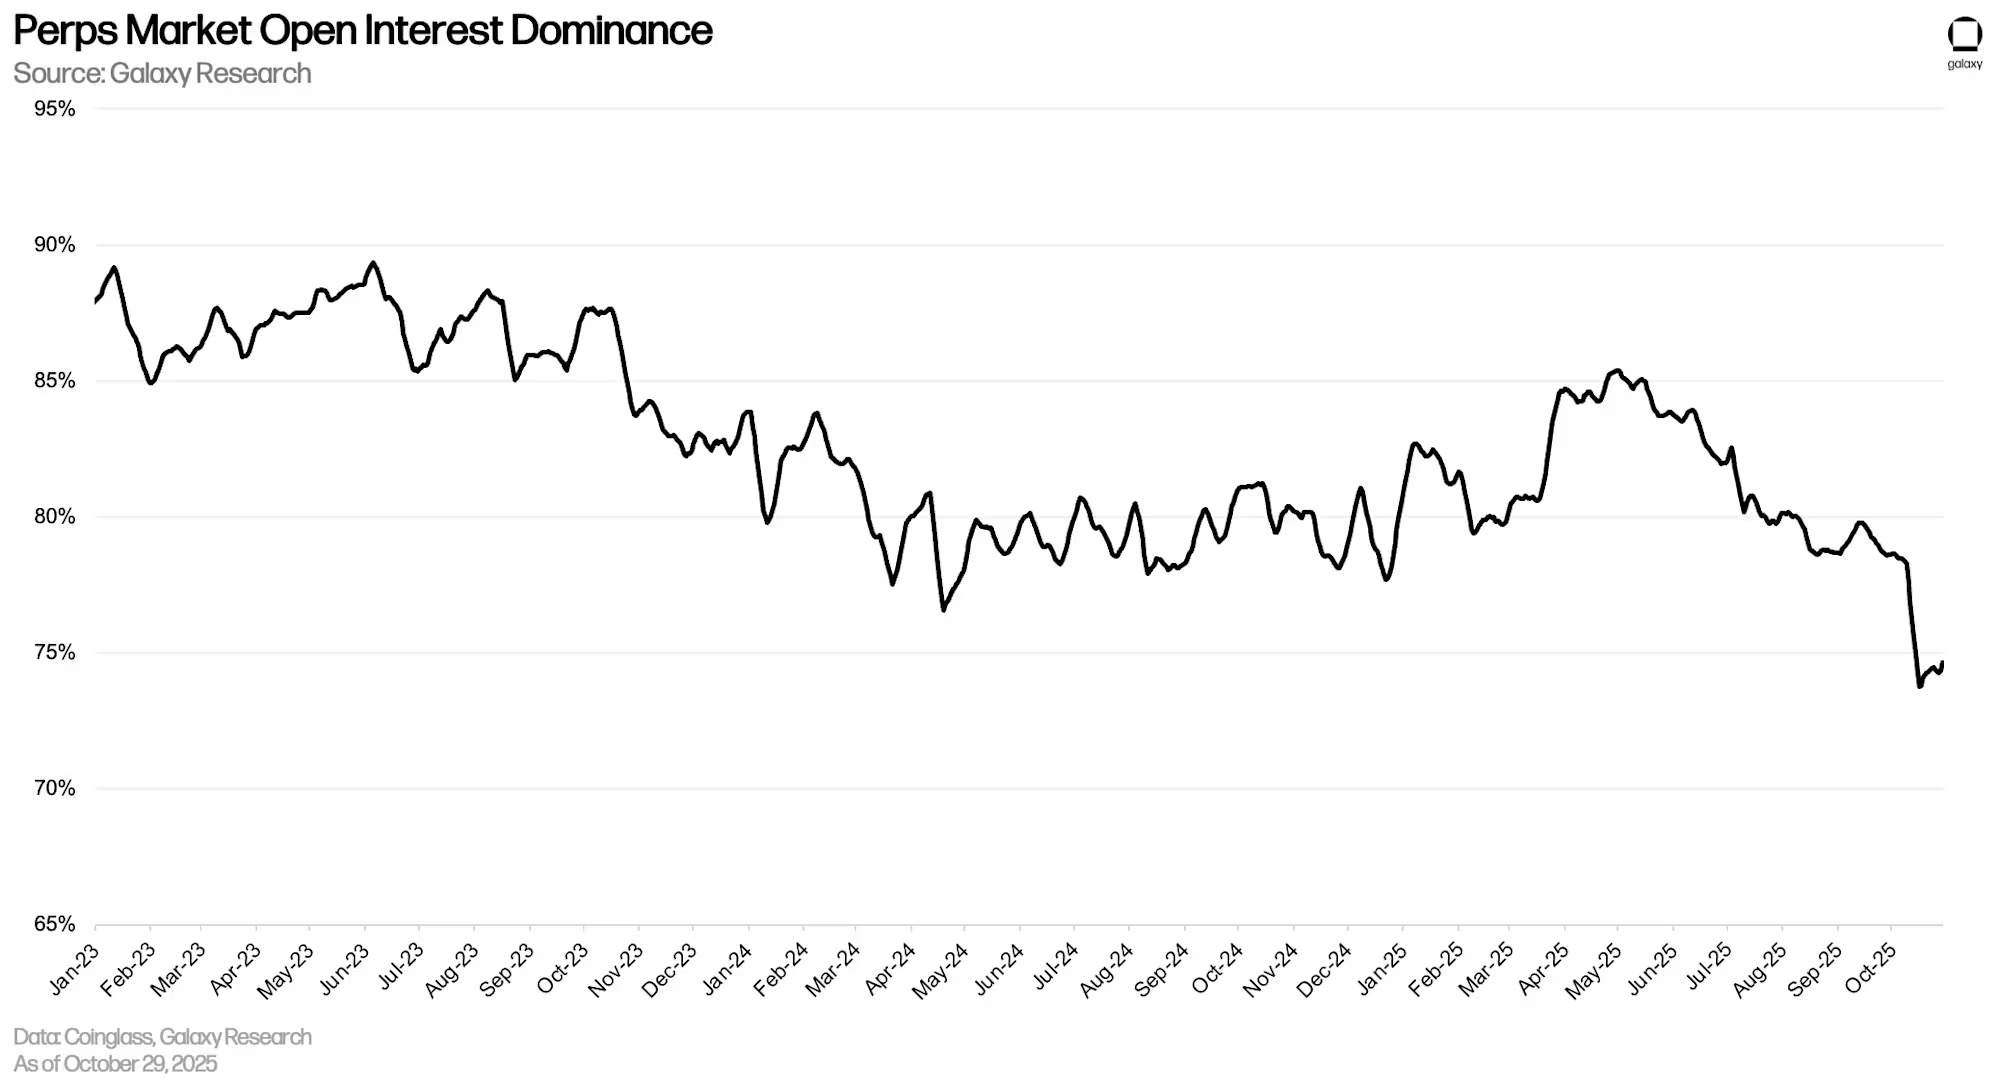
As of October 29, the share of perpetual contracts in total open interest was 76.67%, a decrease of 538 basis points from the end of Q2. The chain liquidation on October 10 caused the share of perpetual contracts to plummet by 442 basis points overnight, due to users being liquidated and automatic deleveraging, while non-perpetual futures remained stable.
Summary
Outstanding loans, futures open interest, and DAT debt all reached new highs in Q3 2025, but the composition of leverage has changed compared to past cycles. The growth is primarily driven by collateralized on-chain lending and CeFi lending, rather than unsecured credit and highly speculative strategies.
Although the chain liquidation on October 10 exposed the scale and reflexivity of derivatives leverage, it did not reveal systemic credit risk. Most forced liquidations were mechanical and not a result of insolvency. Nevertheless, the event highlighted that leverage remains deeply embedded in the market structure, even as its transmission channels have changed.
Overall, crypto leverage is expanding again, but it is based on stricter collateral standards, higher transparency, and a clearer separation between credit and speculation. The system is not without risks, but its foundational structure is more solid than in 2021.
免责声明:本文章仅代表作者个人观点,不代表本平台的立场和观点。本文章仅供信息分享,不构成对任何人的任何投资建议。用户与作者之间的任何争议,与本平台无关。如网页中刊载的文章或图片涉及侵权,请提供相关的权利证明和身份证明发送邮件到support@aicoin.com,本平台相关工作人员将会进行核查。


