Master Discusses Hot Topics:
Last night, the US market was still a mess, and the sentiment remains poor. It's not that people don't want to rally; it's that they don't even have the strength to pretend anymore. The panic selling is finally slowing down; aside from those idiots at BlackRock still stubbornly holding on in the four-digit range, other institutions have all shrunk to three digits.
This isn't about becoming smarter; it's that there's really not much left to sell. Unfortunately, not being able to sell doesn't mean prices will rise. The US stock market still dropped over a point, with the Nasdaq closing down 0.5% just to catch its breath. The dollar is rising, and US Treasury yields are falling, with money all running to safe-haven assets.
Currently, the macro market refuses to believe in a rate cut in December; liquidity is still weak. Trump can't hold back anymore and is criticizing Powell, claiming he has already chosen alternative candidates. As long as he dares to throw names out there, the market might at least get a little excited.
At least daring to bet that a change in personnel equals a rate cut is more effective than Powell making ten empty promises. Unfortunately, this is just a temporary fix; if the liquidity death spiral isn't resolved, we'll eventually have to kneel again.
Then there's tomorrow's Nvidia earnings report and the non-farm payrolls the day after. Nvidia took the lead in getting hit last night, dropping 3% at the open, and only managed a symbolic recovery at the close, clearly indicating a downward adjustment of expectations. If tomorrow's earnings report disappoints, tech stocks will continue to bleed, making it hard for Bitcoin to catch its breath.
Back to the market, after Bitcoin broke 90K, it shattered many people's psychological defenses. Even those who bought in 2018 and 2020 with low costs are trembling and selling, and those buying above 95K are in a worse position.
This script was also seen in April, where it dropped to 75K before rebounding, relying on a temporary ceasefire in trade. Now? The Federal Reserve is holding back on rate cuts, tech stocks are unstable, and what does Bitcoin have to reverse?
On the daily chart, the third segment of the decline is far from over; to end it, it must first rise above 97K, and if it drops below 89K, the next target is in the 80K range, with the weekly chart showing bullish order blocks waiting.
Yesterday, 89K did see a decent stop-loss, with a significant buying volume at the close, looking like a sweep for accumulation, which was the most convincing sign recently. However, the pressure from 93.5K to 94K has already been felt several times, and without sustained buying, if it can't rise today, be prepared to kneel.
While there's a probability of a short-term return to 99K-100K, don't naively think it's a reversal. If it doesn't rise above 107.5K to form a higher high, the bearish structure remains intact! A rebound to 100K is already the ceiling; don't mindlessly shout that the bull is back. That's not strength; it's just bears who are full and need to digest, understand?
The densely packed liquidation zone is cleaned out, and returning to 100K will trap all the buyers. Later, the bears will kick again, and the stronger the rebound, the harder the subsequent drop; that's the normal trend.
Additionally, regarding Ethereum, can we stop the chatter about 2943 being the lower band of the weekly Bollinger Bands? The lower band can still be broken! 2960-2926 is just a buffer; true support is at 2800! Want to run to 2000? Let's talk after breaking 2800 or 2700.
The first wave touching here will definitely catch its breath because Bitcoin is also at the first phase bottom after breaking 100K. I called it last week when it broke 98.2K, opening up space below by ten thousand points; 88K is the pre-drawn phase bottom, and now it's all come true.
Master Looks at Trends:
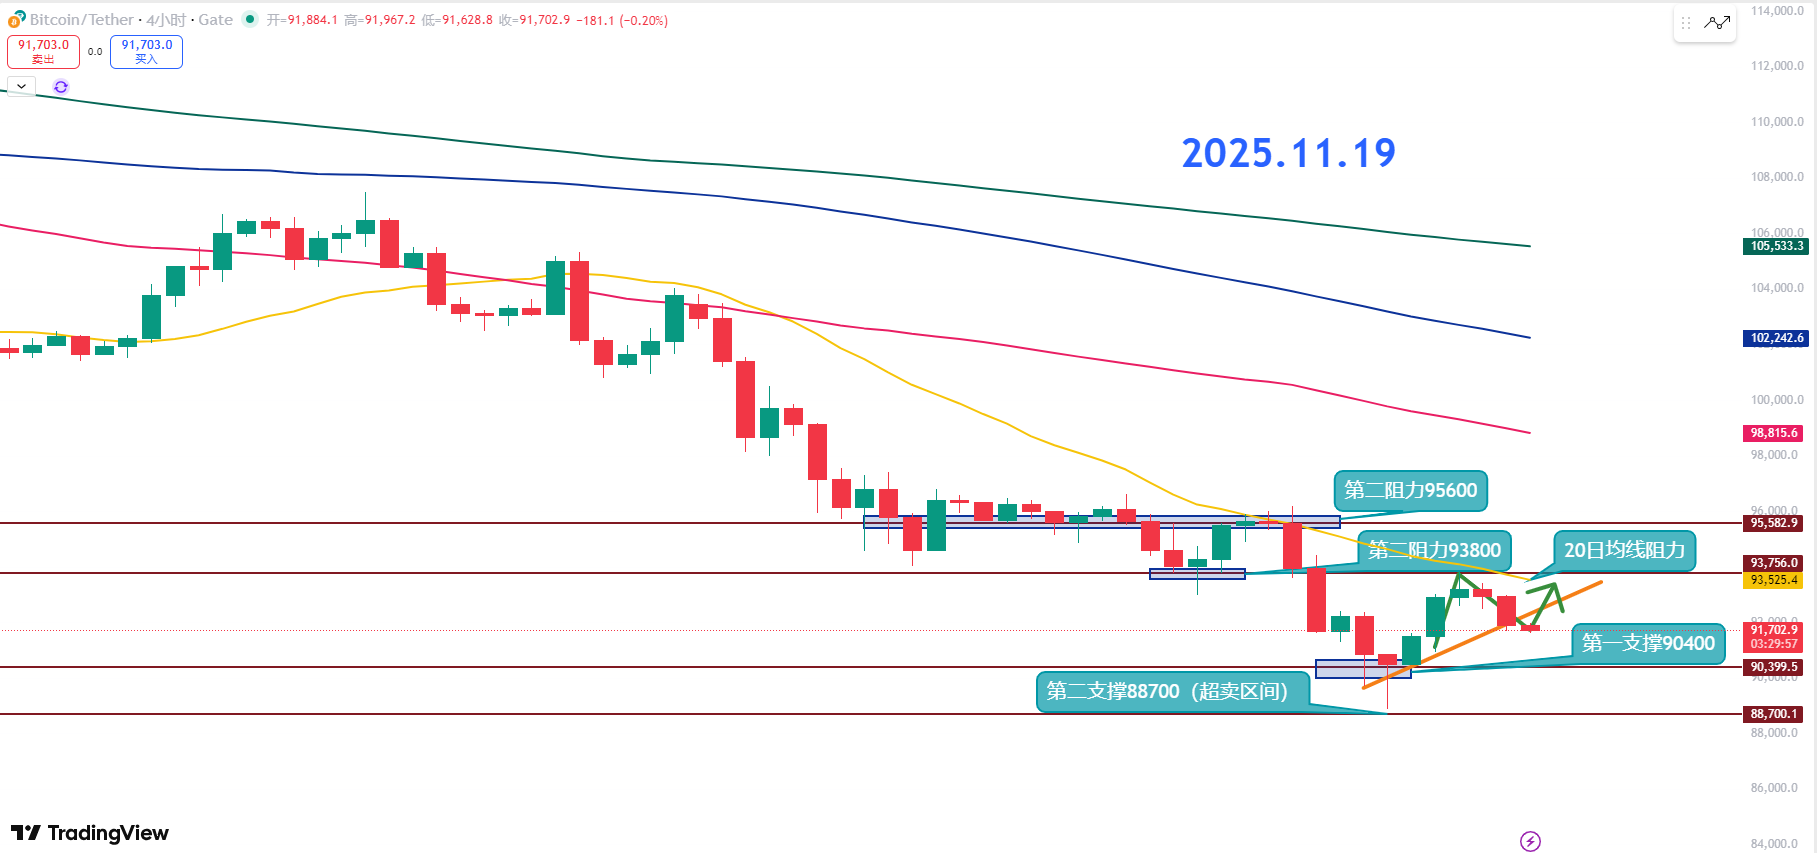
Resistance Level Reference:
Second Resistance Level: 95600
First Resistance Level: 93800
Support Level Reference:
First Support Level: 90400
Second Support Level: 88700
Currently, I consider 90.4K as the current short-term bottom; as long as it doesn't break here, the structure isn't completely broken. Today's key is that the lows must gradually rise; if new lows are made, we will continue to look down.
The 20-day moving average and 93.8K above are the short-term iron ceiling; breaking through won't be easy. If the support at 91K is lost, the short-term bearish momentum will intensify. The RSI is only 37, and there is still a lot of downward space; don't easily expect a rebound from oversold conditions; first, hold the low points.
The first support at 90.4K is now crucial; if it breaks, we will look fully bearish. The second support at 88.7K, once reached, will change the trend from short-term to medium-term bearish.
The first resistance at 93.8K overlaps with the 20-day moving average pressure; only a breakthrough will lead to a decent rebound. The second resistance at 95.6K is the coffin board of the last step; hitting it will likely result in a rejection.
To talk about a reversal on a smaller scale, it must first break through 93.8K, then stabilize above the 20-day moving average, and then challenge 95.6K; otherwise, all rebounds are just traps for the bulls.
11.19 Master’s Wave Strategy:
Long Entry Reference: Not currently referenced
Short Entry Reference: Short in the 93800-94300 range, Target: 92200-90400
If you truly want to learn something from a blogger, you need to keep following them, rather than making rash conclusions after just a few market observations. This market is filled with performers; today they screenshot long positions, tomorrow they summarize short positions, making it seem like they "catch every top and bottom," but in reality, it's all hindsight. A truly worthy blogger will have trading logic that is consistent, coherent, and withstands scrutiny, rather than jumping in only when the market moves. Don't be blinded by flashy data and out-of-context screenshots; long-term observation and deep understanding are needed to discern who is a thinker and who is a dreamer!
This article is exclusively planned and published by Master Chen (public account: Coin God Master Chen). If you want to learn more about real-time investment strategies, liquidation, spot trading, short, medium, and long-term contract trading techniques, and knowledge about candlesticks, you can join Master Chen for learning and communication. A free experience group for fans has been opened, along with community live broadcasts and other quality experience projects!

Friendly reminder: This article is only written by Master Chen on the official public account (as shown above); other advertisements at the end of the article and in the comments section are unrelated to the author! Please be cautious in distinguishing between true and false, and thank you for reading.
免责声明:本文章仅代表作者个人观点,不代表本平台的立场和观点。本文章仅供信息分享,不构成对任何人的任何投资建议。用户与作者之间的任何争议,与本平台无关。如网页中刊载的文章或图片涉及侵权,请提供相关的权利证明和身份证明发送邮件到support@aicoin.com,本平台相关工作人员将会进行核查。


