Charts
DataOn-chain
VIP
Market Cap
API
Rankings
CoinOSNew
CoinClaw🦞
Language
  • 简体中文
  • 繁体中文
  • English
Leader in global market data applications, committed to providing valuable information more efficiently.

Features

  • Real-time Data
  • Special Features
  • AI Grid

Services

  • News
  • Open Data(API)
  • Institutional Services

Downloads

  • Desktop
  • Android
  • iOS

Contact Us

  • Chat Room
  • Business Email
  • Official Email
  • Official Verification

Join Community

  • Telegram
  • Twitter
  • Discord

© Copyright 2013-2026. All rights reserved.

简体繁體English
|Legacy

On November 25, 2017, the US stock market weekly chart fell back again, BTC continues to drop to new lows, and it hasn't bottomed out yet but is getting close.

CN
交易公子扶苏
Follow
4 months ago
AI summarizes in 5 seconds.

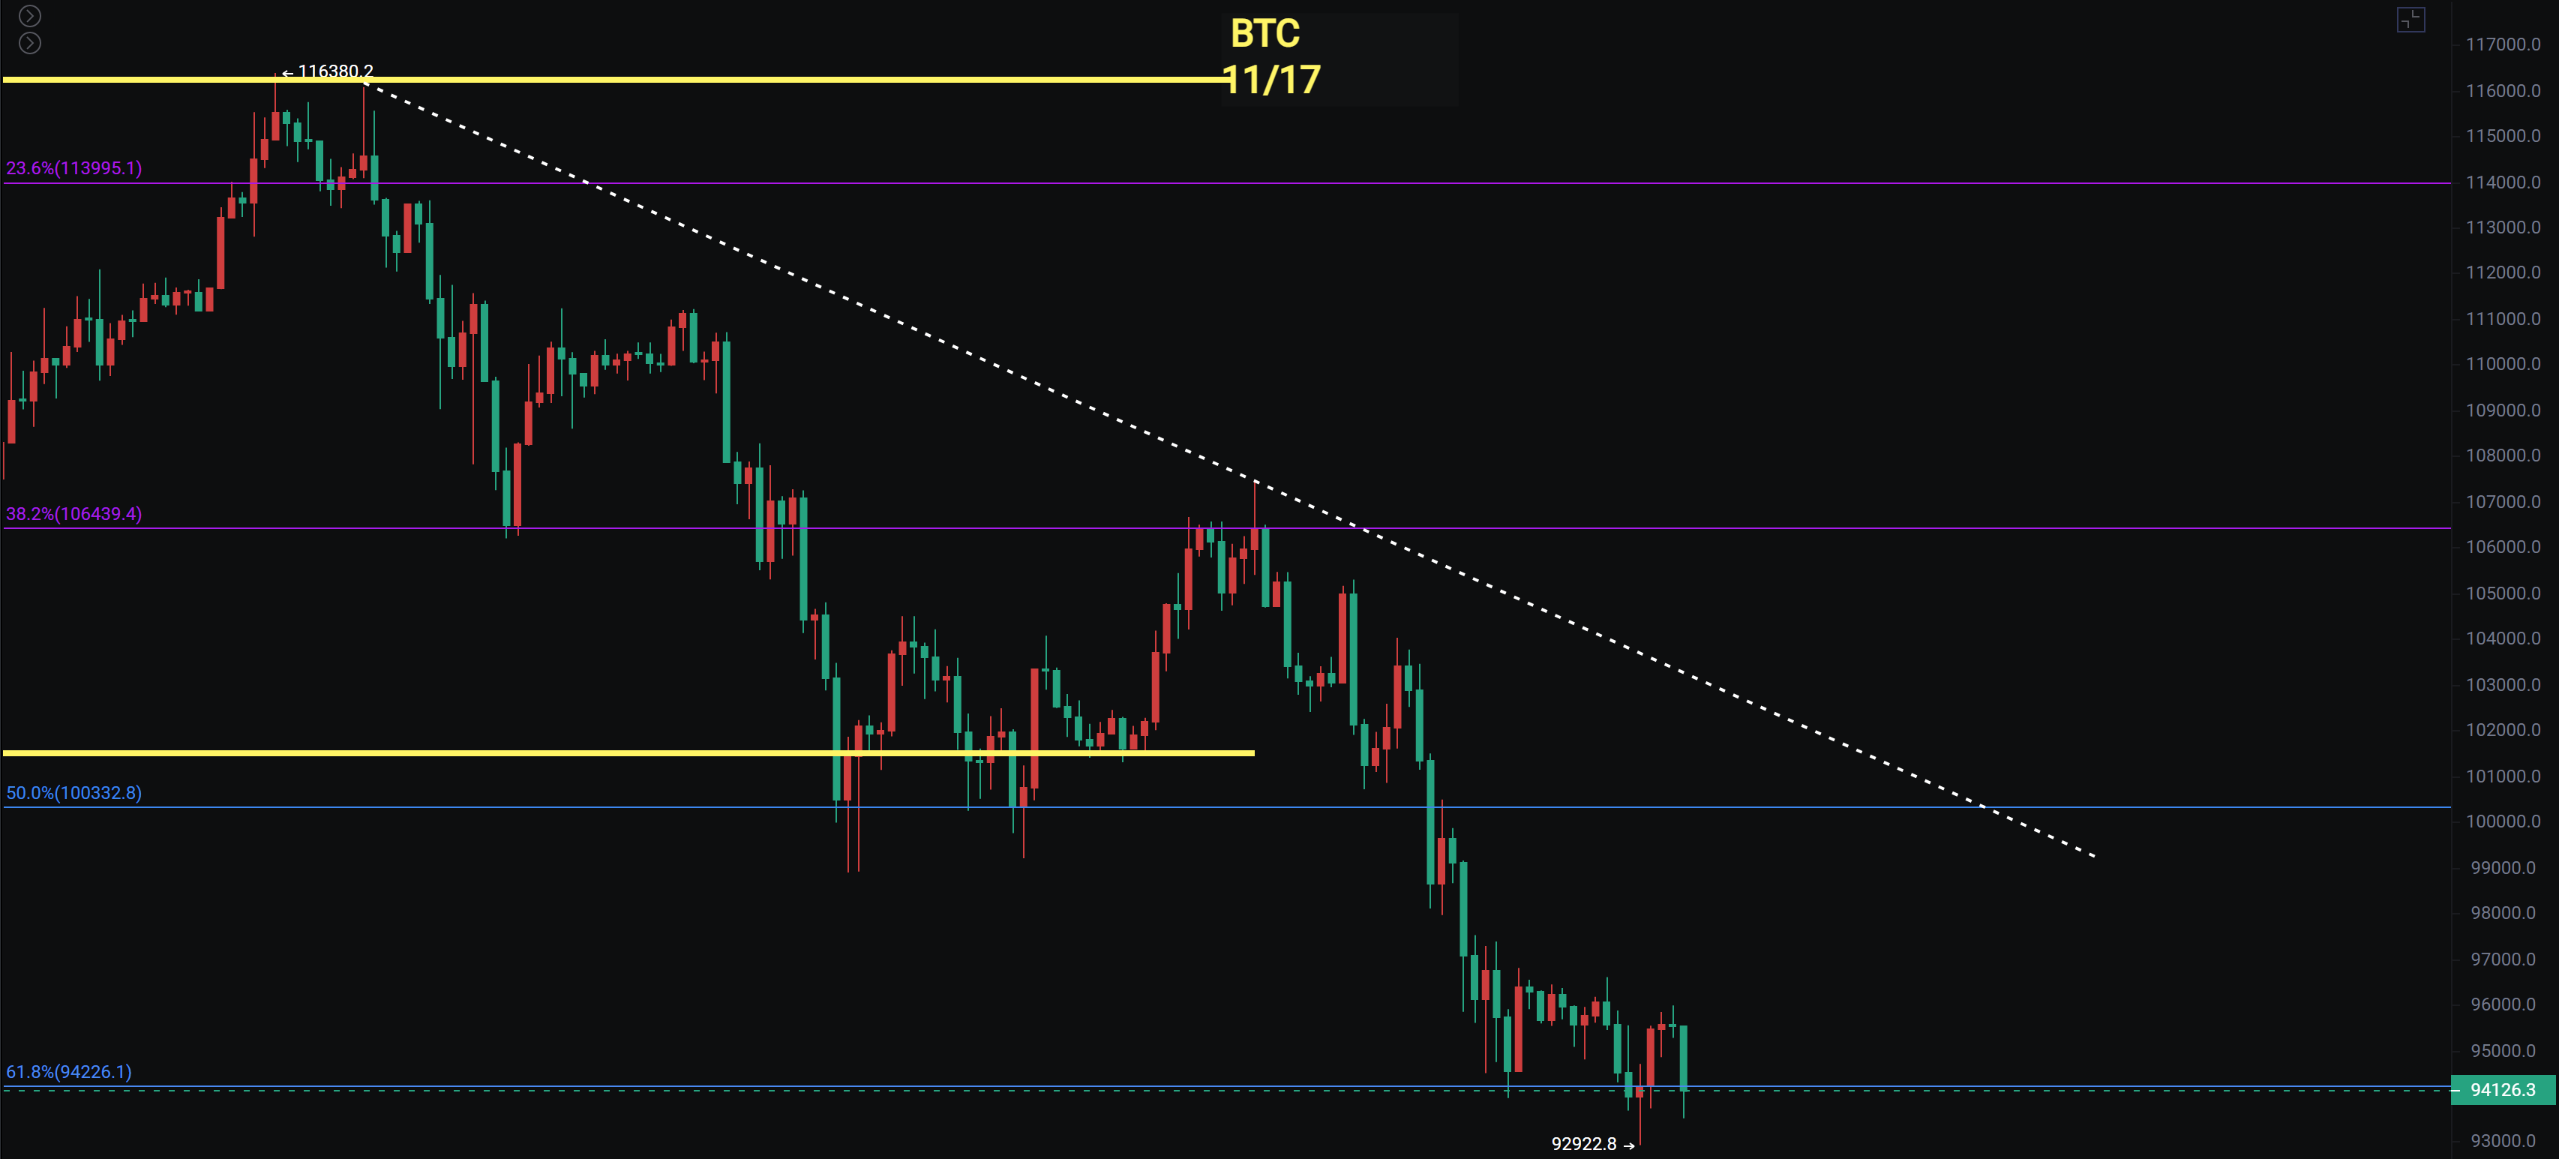
The weekly Bitcoin chart shows a large bearish candle, and it has broken below the bottom of the pin bar. So far, there has been no clear bottom signal, with a low of 92922. The support level around 91600 to 92000 is crucial, as it is the platform support that broke down to 74500 at the beginning of the year. From the highest point, it has already dropped by 26.3% and is near the Fibonacci level of 0.618.

The US stock market also shows a false breakout on the weekly chart, so we are observing the strength of the support. This week's trend will be quite critical…

After a rebound, gold is under pressure and continues to correct. This may be similar to the previous period of consolidation for 4 months before choosing to break out. During this time, the relationship between China and Japan has been tense, and the situation between the US and Venezuela has escalated, so we need to closely monitor the impact of these situations.

Bitcoin

There is no bottom signal on the weekly chart, and there is slight support on the daily chart, but the MACD on the monthly chart has already crossed down through the zero axis. Any subsequent rebound should consider reducing positions. The daily chart has slight support, but the small platform strength is still insufficient. A significant bottom may only appear when there is a volume spike in the pin bar.

The 4-hour chart doesn't have much to say; it has been in a few days of consolidation and is still in a process of searching for a bottom. Let's be patient!

Support: 91600 to 92000

Resistance: 101516 to 107500
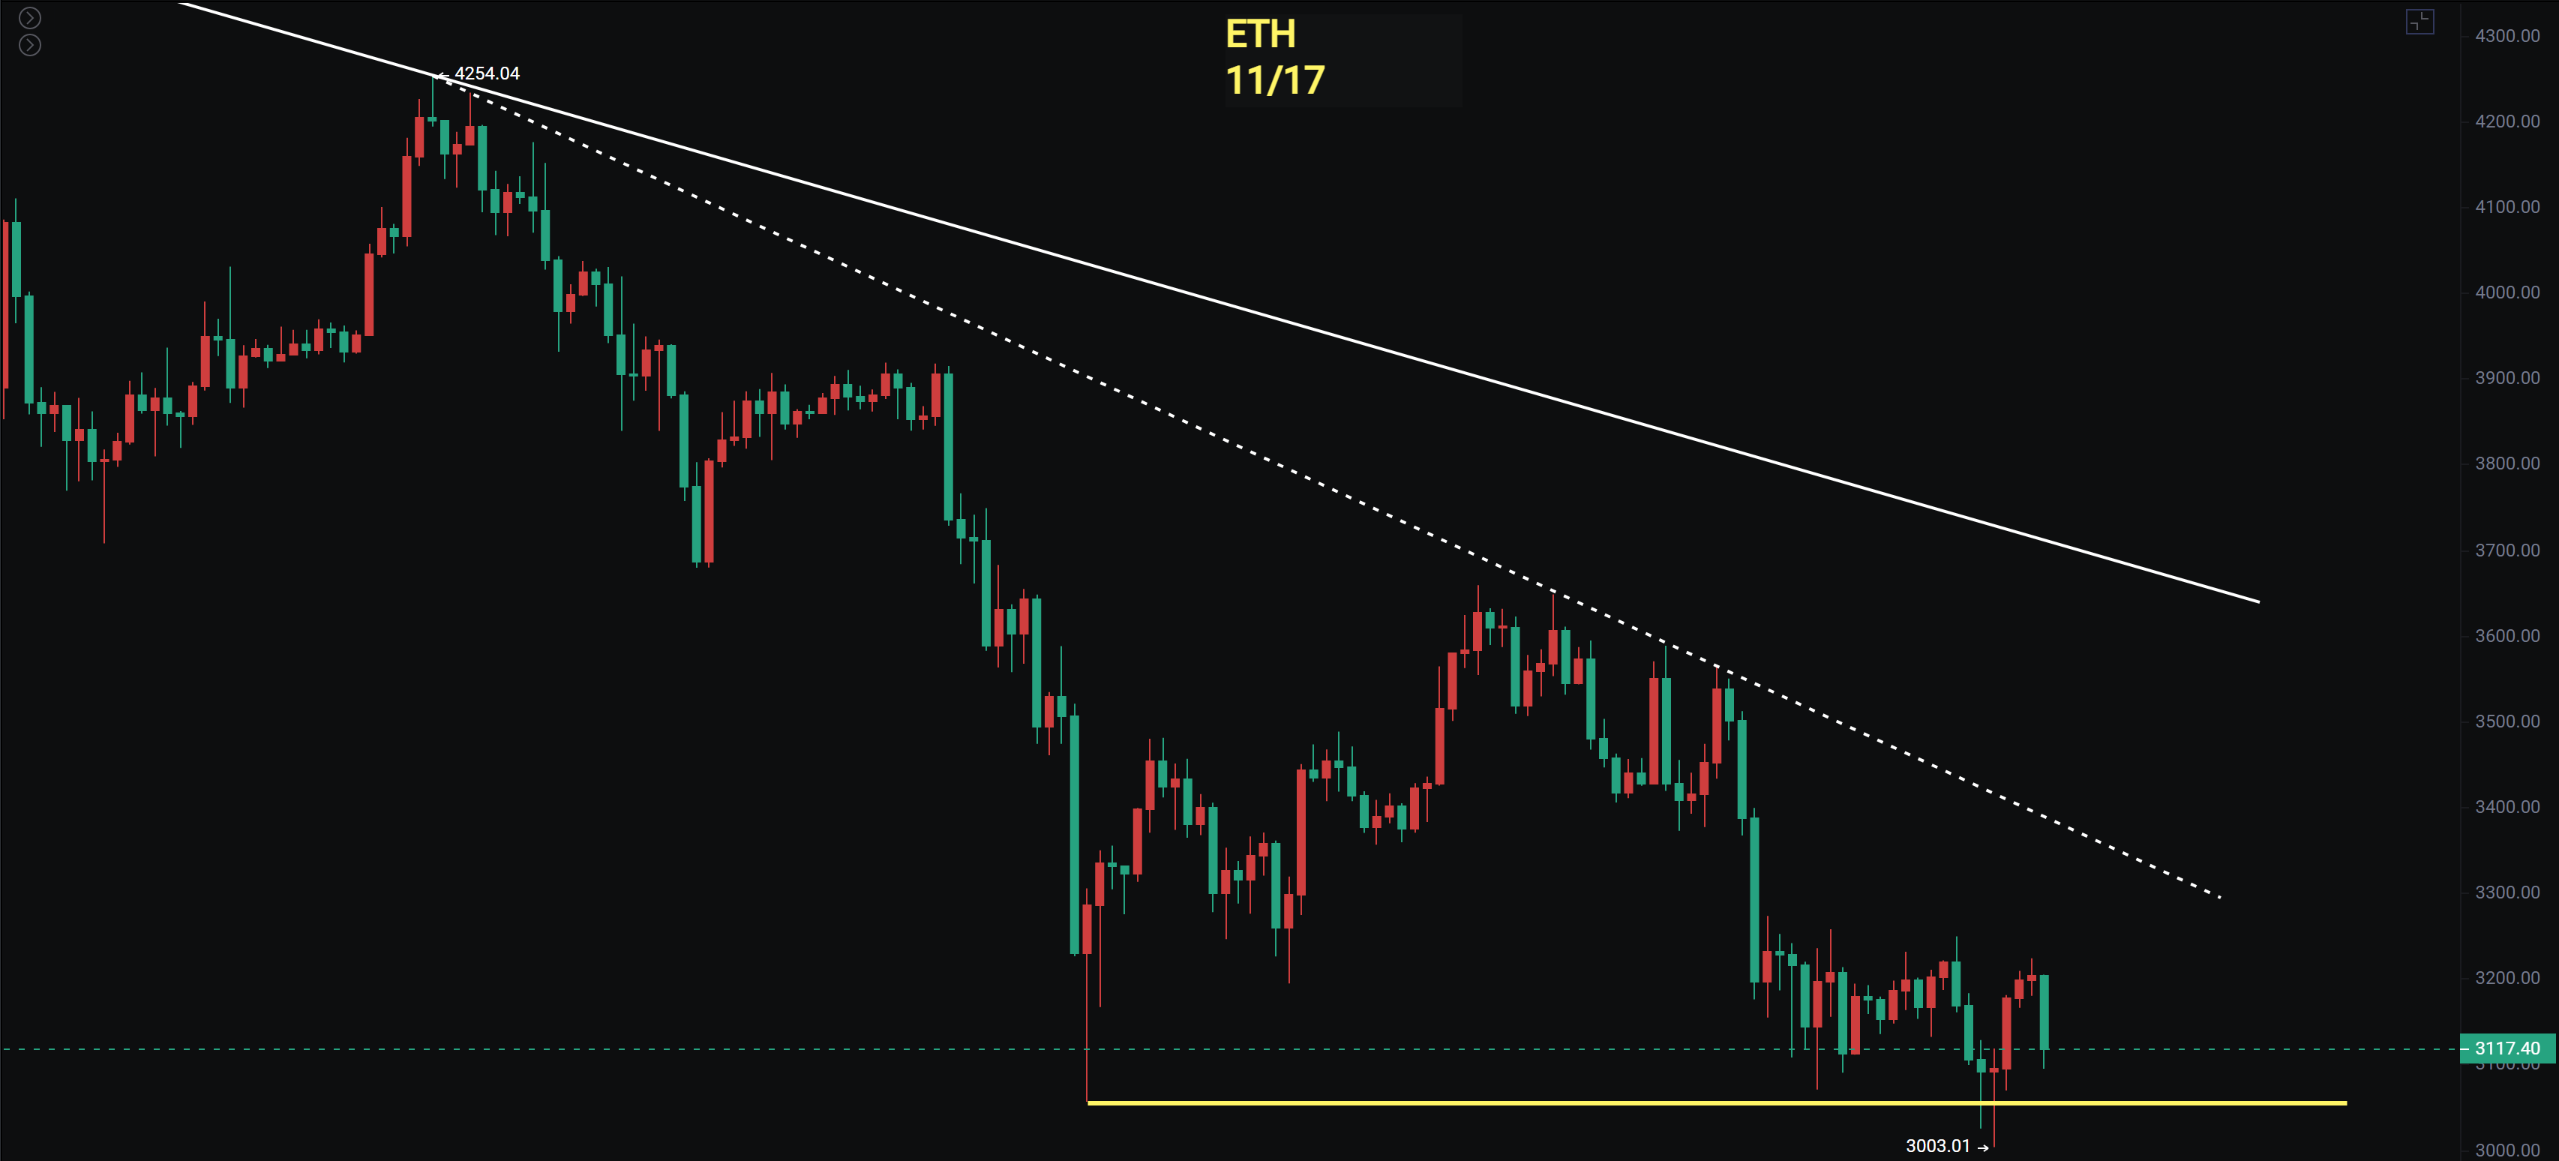
Ethereum

The lowest pin bar reached 3004. Although it has recovered from the previous low, the overall weekly chart still looks weak. We have been bearish since the MACD on the weekly chart crossed below the zero axis. It has already dropped 39% from the highest point.

Although there is still no clear bottom signal, we are gradually positioning for a rebound.

Support: 2800 to 2900

Resistance: 3435 to 3660

If you like my views, please like, comment, and share. Let's navigate through the bull and bear markets together!!!

This article is time-sensitive and for reference only; it is updated in real-time.

Focusing on K-line technical research, sharing global investment opportunities. Public account: BTC Trading Prince Fusu

免责声明:本文章仅代表作者个人观点,不代表本平台的立场和观点。本文章仅供信息分享,不构成对任何人的任何投资建议。用户与作者之间的任何争议,与本平台无关。如网页中刊载的文章或图片涉及侵权,请提供相关的权利证明和身份证明发送邮件到support@aicoin.com,本平台相关工作人员将会进行核查。

返20%!OKX龙虾AI,安全+快速+自动化
广告
|
|
APP
Windows
Mac
Share To

X

Telegram

Facebook

Reddit

CopyLink

|
|
APP
Windows
Mac
Share To

X

Telegram

Facebook

Reddit

CopyLink

Selected Articles by 交易公子扶苏

13 days ago
On March 26, 2017, both Bitcoin and Ethereum broke through, be cautious not to fall back down, the risk for gold in the US has increased.
17 days ago
March 26, 2013 BTC weekly chart shows a bottom divergence, about to face an upward breakout. How to seize the opportunity next?
1 month ago
On February 26, 2009, BTC dropped sharply to 60,000, while the US stock market fluctuated at a high level for 4 months, with retail investors gritting their teeth to survive first.
View More

Table of Contents

|
|
APP
Windows
Mac
Share To

X

Telegram

Facebook

Reddit

CopyLink

Related Articles

avatar
avatarCakeBaBa
20 minutes ago
The probability of interest rate hikes "cooling off" boosts BTC rebound! The battle to close the quarter at the 68000 mark—will it trigger a bull trap or a reversal?
avatar
avatar顾景辞
50 minutes ago
Gu Jingci: Bitcoin/Ethereum on March 31 successfully took a long position first and then a short position yesterday. In the morning session, after a rise, we should continue to look for a pullback.
avatar
avatar青岚加密课堂
1 hour ago
Federal Reserve Expectations Heat Up! Where Will BTC Go? 3/31
avatar
avatar币圈伟泽
5 hours ago
Mr. Coin: Analysis and prediction of the latest trend of Ethereum (ETH) on March 31. Includes operational strategies.
avatar
avatar币圈伟泽
5 hours ago
Mr. Coin: 3.31 Bitcoin BTC today's latest trend analysis and forecast. Includes trading strategies.
APP
Windows
Mac

X

Telegram

Facebook

Reddit

CopyLink