Cryptocurrency Market Analysis: Solana (SOL) Latest Trends
Article Published on 2025.11.17—00:30
The current price of Solana is 138. The analysis indicates a clear downtrend for Solana (SOL), with technical indicators showing an increase in bearish momentum. The MA/EMA indicators have formed a death cross, and the price remains below both short-term and long-term moving averages, indicating strong downward pressure. However, it has been noted that the price is approaching a strong support level at 135.7, which is a previous low and holds significant technical importance.
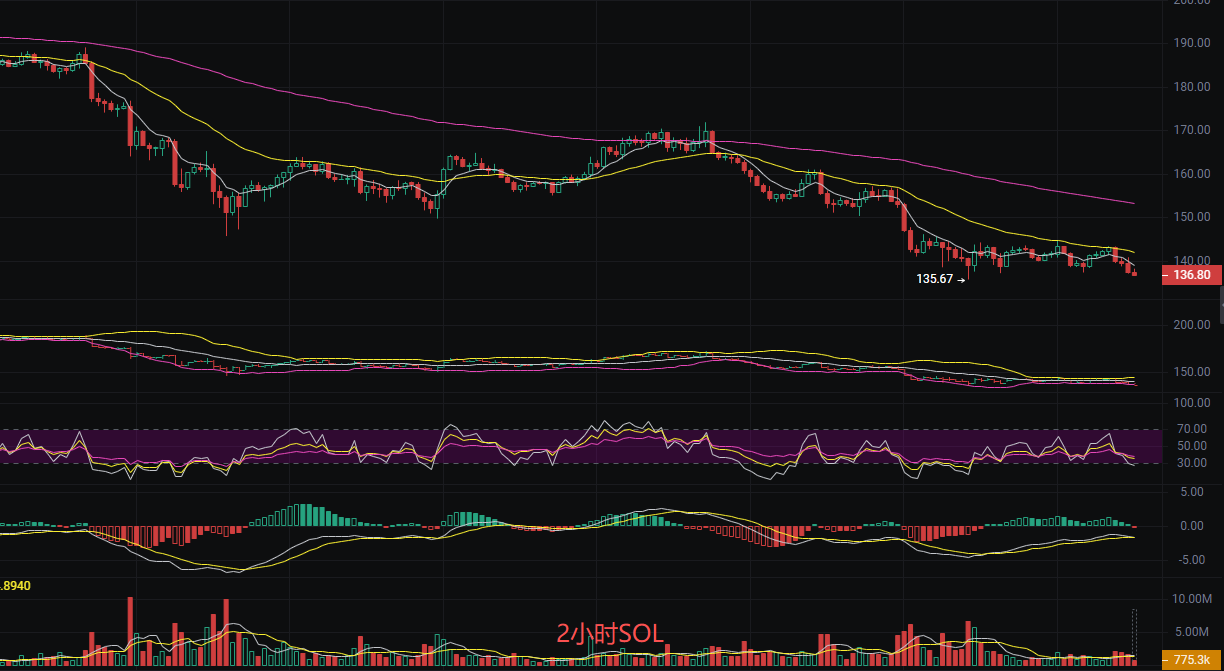
The analysis reveals a continuous decline on the daily chart, forming multiple bearish candles. In the 2-hour timeframe, the price has retraced from a high of 143 to the current level of 137, indicating short-term low-level fluctuations. The MACD on the 2-hour chart shows a weakening of bearish strength but has not yet turned bullish. The EMA on the 2-hour chart indicates a bearish short-term trend. The recommendation is to maintain a short position at high levels and continue holding.
Today's Latest Reference Points
Long Entry: 135, Add: 132, Stop: 130, Target: 140
Short Entry: 140, Add: 143, Stop: 145, Target: 135

The above analysis is based on market data and trend analysis and does not constitute investment advice. It is provided for reference. It is hoped that it can assist others with dreams to find their place in this volatile market and embark on their own successful journey.

The content of this article is time-sensitive and for reference only; risks are to be borne by the reader.
免责声明:本文章仅代表作者个人观点,不代表本平台的立场和观点。本文章仅供信息分享,不构成对任何人的任何投资建议。用户与作者之间的任何争议,与本平台无关。如网页中刊载的文章或图片涉及侵权,请提供相关的权利证明和身份证明发送邮件到support@aicoin.com,本平台相关工作人员将会进行核查。


