Cryptocurrency News
November 14 Highlights:
1. 21Shares launches two cryptocurrency index funds covering various tokens including Bitcoin and Dogecoin.
2. The SEI ETF staked by Canary has been listed on the DTCC website under the code SEIZ.
3. The FDIC is considering issuing guidance on tokenized deposit insurance.
4. Fireblocks is negotiating with investors to raise funds for repurchasing employee shares.
5. Solana treasury company Upexi has launched a stock repurchase program of up to $50 million.
Trading Insights
The market is full of pitfalls, so stay vigilant. Here are some trading insights that I believe will help you!
- Don’t chase the hype or follow the crowd; only buy when there’s a “discount.” ① Buying logic: When prices drop or stagnate with no one buying, it’s a good time to select and buy with confidence. ② Selling logic: Once you see everyone rushing in, and prices are skyrocketing, quickly sell what you have.
- Don’t be greedy during a surge; run quickly, and don’t panic during a sharp drop; first check the volume. ① Responding to surges: If prices have been “soaring” for several days, it may seem profitable, but risks are hidden and a drop could happen anytime; it’s safest to take profits. ② Responding to sharp drops: If there’s a sudden drop, don’t panic; first check the “trading volume”—if few are actually selling (low volume), it’s likely just a scare; don’t rush to cut losses.
- A rise without “people” is a trap; escape from a drop with a crowd selling. ① Beware of “no-volume rises”: Prices may look like they’re rising, but if few are actually buying (low volume), it’s just the main players “drawing a pie” to lure you in; don’t fall for it. ② Definitely avoid “high-volume drops”: If prices are falling and many are frantically selling (high volume), that’s real panic; quickly withdraw, don’t wait until you’re deeper in the hole.
- Don’t fidget during sideways trading; act only after a breakout. ① Sideways phase: The market lacks direction, and prices fluctuate within a range; entering during this phase is like “guessing a coin flip,” making it easy to buy high and sell low; better to observe more and act less. ② Breakout phase: Wait for prices to truly break through the “upper and lower boundaries” of the sideways range; once the trend is clear, follow it to enter, which greatly increases your win rate.
- Mindset is more important than skills; greed is the biggest enemy. ① Don’t be greedy when making money: As long as you’ve made a profit and reached your expectations, take it and don’t think about “just a little more,” or you might end up losing it all. ② Don’t hold on when losing: If prices drop beyond your acceptable range, set a “stop-loss line” in advance; cut losses when necessary, don’t stubbornly wait for a “turnaround,” as holding on will only increase your losses.
LIFE IS LIKE
A JOURNEY ▲
Below are the real trading signals from the Daba community this week. Congratulations to those who followed along. If your trades aren’t going well, you can come and test the waters.
The data is real, and each trade has a screenshot from when it was sent out.
**Search for the public account: *Daba Discusses Coins*
BTC
Analysis
Today, Bitcoin's price has directly fallen below the lowest price since June 25, creating the lowest price for the second half of 2025. The main reasons for the decline include investor pessimism regarding the Federal Reserve's interest rate cut in December and liquidity shortages caused by the U.S. government shutdown. Tech stocks were the first to be sold off, with Nvidia dropping over 4.5% before the close. Although there is no direct negative news, investors are still worried about inflation and the labor market.
The weekly M-top has formed and broken the neckline, with three consecutive bearish candles and increased volume, forming a “bearish three crows.” The subsequent trend looks bleak, breaking below the middle band of the Bollinger Bands and causing it to bend downwards.
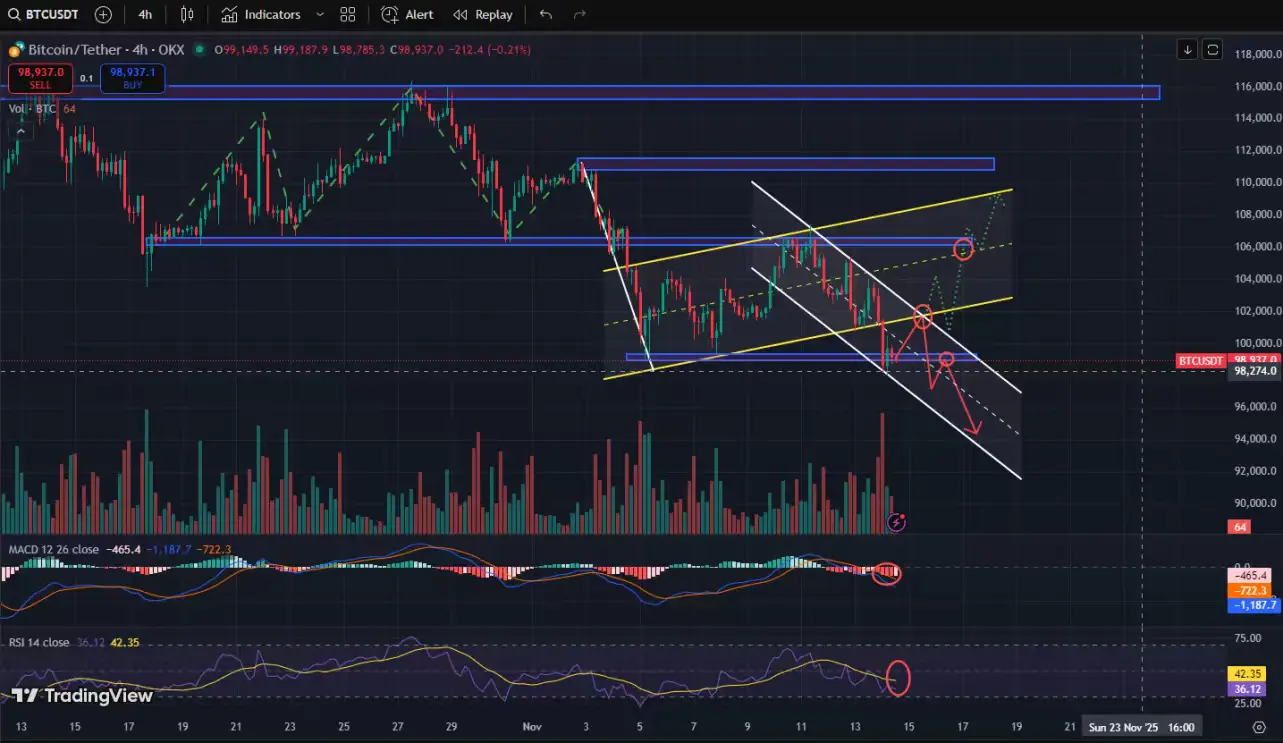
On the daily level, a large bearish candle has formed with increased volume, breaking below the lower boundary of the ascending channel. It temporarily found support at the previous low of 98,000, with resistance for a rebound around 101,500 (retesting the lower boundary of the channel). If the resistance holds, it will form a descending wedge, with a downward target of about 95,000. For short-term trading, pay attention to the 4-hour chart for opportunities.
In the short term, on the 4-hour level, it has broken below the ascending channel and is currently forming a descending channel with a bearish flag. The rebound should focus on the intersection of the lower boundary of the ascending channel and the upper boundary of the descending channel around 101,700. This position is a key point for short-term trends; if it fails to hold, it will continue to decline, targeting around 95,000 (convergence of daily and weekly levels). If it breaks above the upper boundary of the descending channel at 101,700, it may challenge the middle band of the channel around 105,000.
ETH
Analysis
There are no real negative news, and the market lacks any major issues. In fact, the government shutdown has ended, and the U.S.-China trade dispute has concluded, with tariffs possibly being canceled or modified. If there is any negative aspect, it might be the uncertainty of inflation data and the uncertainty of the December interest rate cut. Nvidia's third-quarter earnings report will be released on November 19, which may help improve investor confidence in AI.
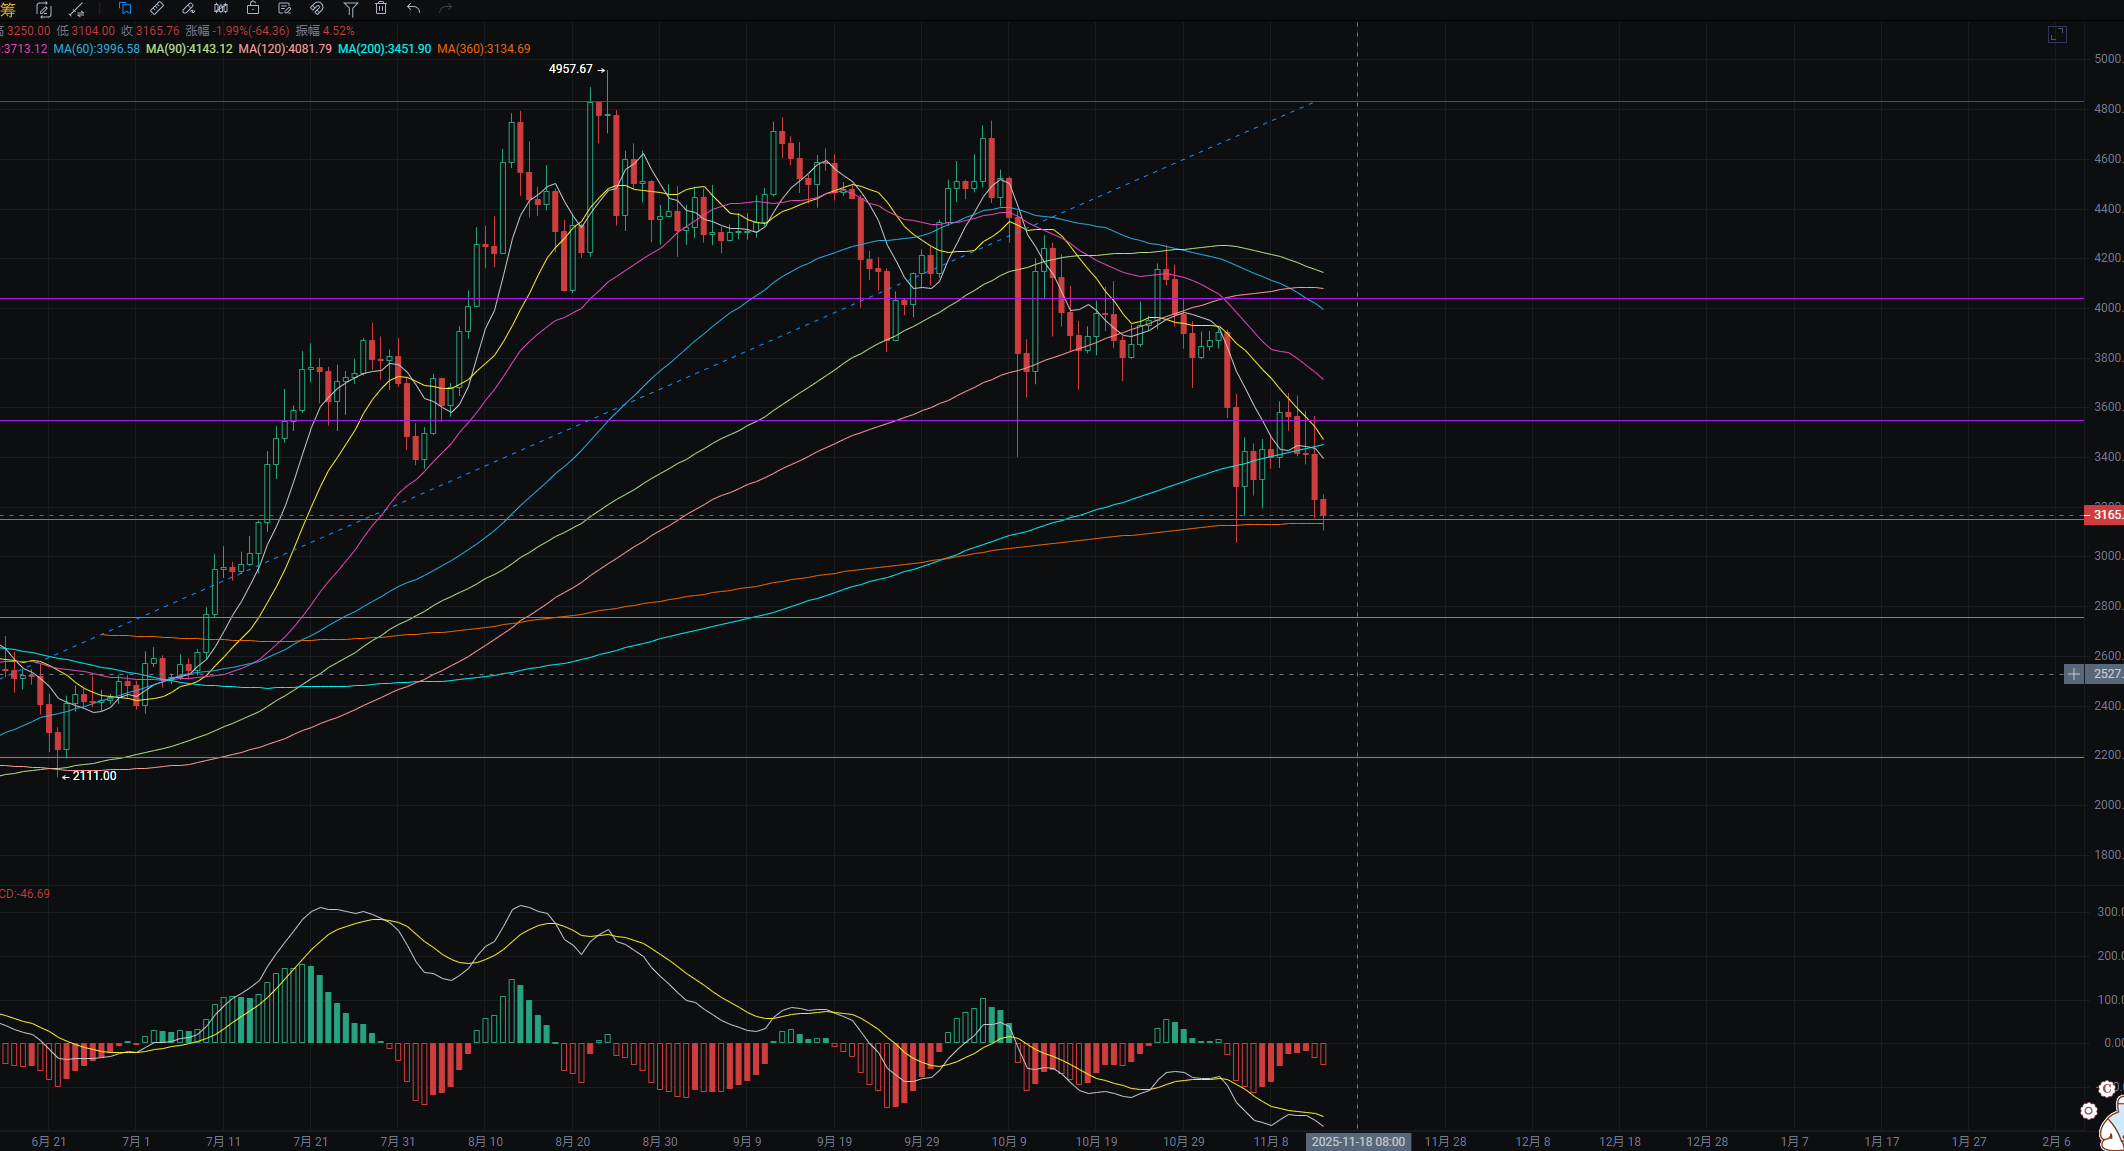
ETH has formed three consecutive bearish candles with increased volume, breaking below the upward trend line. The MACD, RSI, and KDJ are all in a bearish arrangement, with key support on the weekly chart around 2,900 (Bollinger Bands lower boundary + platform support). On the daily level, it is operating within a descending channel; if the middle band holds, it could rebound to around 3,500 resistance (FVG). If it breaks below the middle band, watch for the target position of the descending flag around 3,000 to 2,850 for support; the 4-hour chart has entered a descending flag after breaking below the lower boundary of the channel.
Disclaimer: The above content is personal opinion and for reference only! It does not constitute specific operational advice and does not bear legal responsibility. Market conditions change rapidly, and the article may have some lag; if you have any questions, feel free to consult.
免责声明:本文章仅代表作者个人观点,不代表本平台的立场和观点。本文章仅供信息分享,不构成对任何人的任何投资建议。用户与作者之间的任何争议,与本平台无关。如网页中刊载的文章或图片涉及侵权,请提供相关的权利证明和身份证明发送邮件到support@aicoin.com,本平台相关工作人员将会进行核查。


