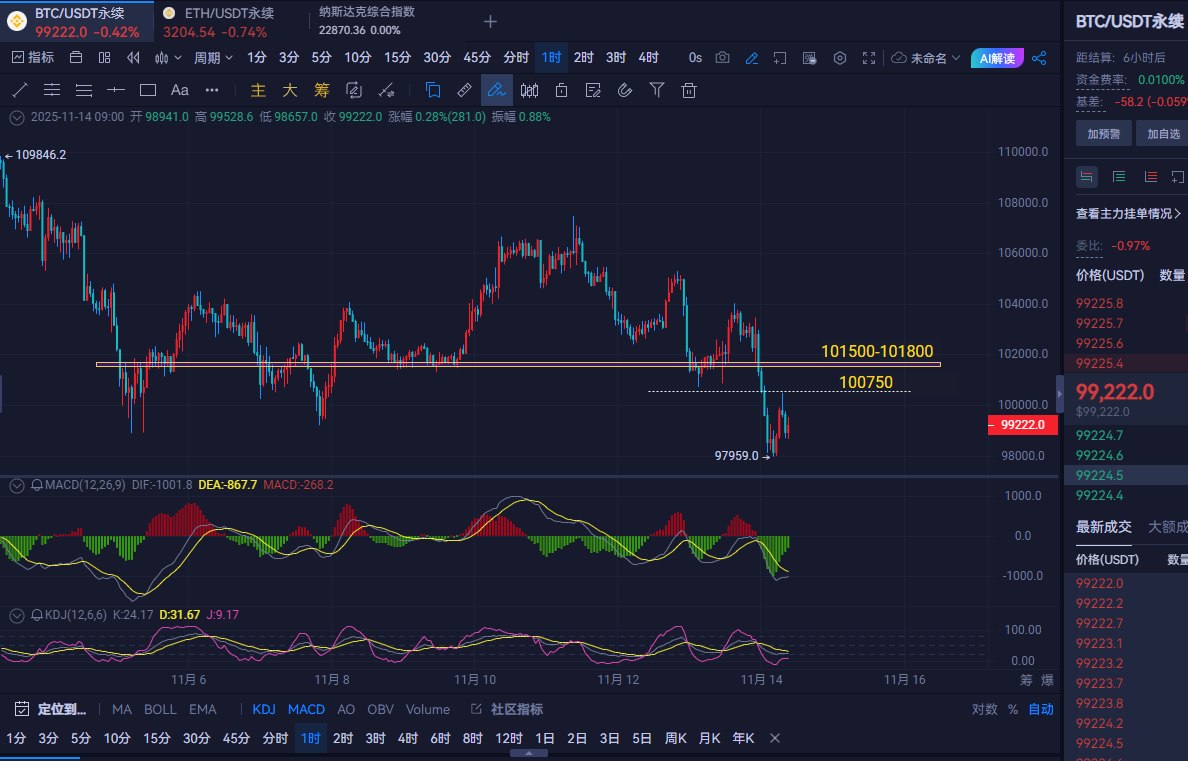
Bitcoin Analysis: The current market cycle shows a clear bearish trend, but on the intraday short-term 4-hour level, after three consecutive bearish candles touched the lower band, the momentum has weakened, which is a normal correction after a significant drop; the market will not move in a one-sided manner, and the correction requires time to digest. On the 1-hour chart, after breaking a new low, Bitcoin has formed a short-term double top, with a rebound during the day, so first pay attention to the resistance level around 100750.
Ethereum's current 1-hour candlestick chart shows short-term support around 3200, but overall it is still in a weak adjustment phase. The technical indicator MACD is negative and diverging downwards, indicating strong bearish momentum, but the histogram is shortening, showing signs of weakening. The current price is below EMA30 and EMA120, indicating that both mid-term and long-term trends are bearish. For intraday short-term resistance, pay attention to the range of 3270-3360.

Trading Suggestions: For Bitcoin, consider shorting around 100750-101100, with a stop loss at 101800, targeting around 99300-99000, and if broken, look for 98700-98300; if it doesn't break, consider going long.
For Ethereum, consider shorting around 3300-3330, with a stop loss at 3380, targeting around 3230-3200, and if broken, look for 3100-3070; if it doesn't break, consider going long.
This strategy is for reference only; please invest cautiously and secure profits. (扣40273836)
免责声明:本文章仅代表作者个人观点,不代表本平台的立场和观点。本文章仅供信息分享,不构成对任何人的任何投资建议。用户与作者之间的任何争议,与本平台无关。如网页中刊载的文章或图片涉及侵权,请提供相关的权利证明和身份证明发送邮件到support@aicoin.com,本平台相关工作人员将会进行核查。