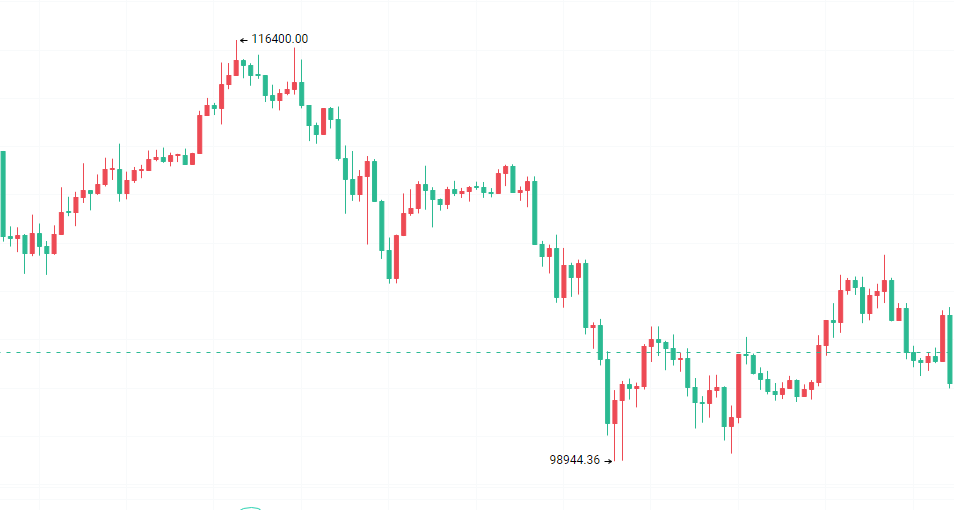
Currently, the daily chart shows a two consecutive bearish trend, with the market gradually approaching the lower Bollinger Band, and the Bollinger Band remains in a downward opening state, indicating that it has entered a downward channel. The frequent upper shadows above the bearish candles indicate strong selling pressure from above.
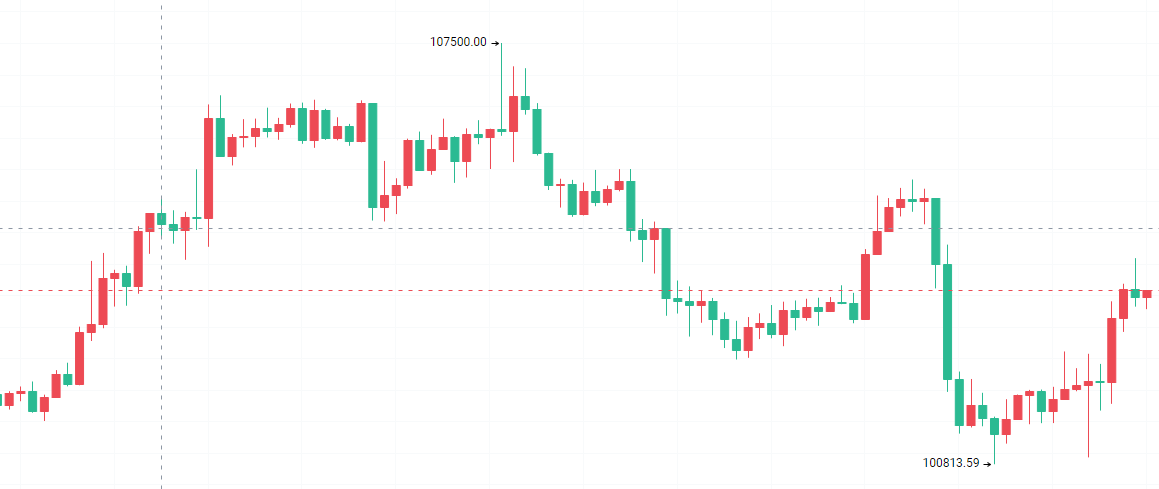
Looking at the four-hour chart: Although the market rebounded after breaking below the lower Bollinger Band, the strength of the rebound is very weak, and the volume for recovery is severely insufficient, so the overall trend will not show a significant reversal. In terms of operation, it is advisable to follow the trend and look for a pullback, with the rebound continuing to be limited.
Trading Suggestions
Bitcoin: 102500-103500 range, target 10000-101500
Altcoin: 3500-3600 range, target 3200-3400
(Personal opinions are for reference only; everything is subject to actual trading!)
Official Account👇

免责声明:本文章仅代表作者个人观点,不代表本平台的立场和观点。本文章仅供信息分享,不构成对任何人的任何投资建议。用户与作者之间的任何争议,与本平台无关。如网页中刊载的文章或图片涉及侵权,请提供相关的权利证明和身份证明发送邮件到support@aicoin.com,本平台相关工作人员将会进行核查。