Master Discusses Hot Topics:
Finally, the government shutdown has come to an end as the President signed the agreement. The longest government shutdown in American history has finally reached a conclusion. As a result, yesterday afternoon, the market surged from 103K to 105.3K, looking like it was about to take off.
However, as soon as the U.S. stock market opened in the evening, the market quickly turned downward, dropping to a low of 100.8K. Those who chased the highs without setting stop-losses are probably questioning their life choices now.
In simple terms, this rebound is not a victory for the bulls, but a typical move by the bears to let you enjoy a brief high before kicking you back to where you started. The breakout at 104K was a false breakout, with bears clearly lying in wait above.
This market trend has completely demonstrated that the bears hold the power now, and the bulls have become fish on the chopping block, ready to be gutted at any moment. The support level at 100K has been gnawed down to almost nothing; another drop would likely lead to a collapse, with all the buy orders below being completely consumed.
Currently, the market is not a battle between bulls and bears, but rather a situation where the bears are dominating the bulls. Large buy orders? They are hiding below 98K to 94K, playing dead, waiting for the market to truly collapse before stepping in to pick up the pieces.
Ironically, just as the President announced the end of the shutdown, the market remained indifferent. The GDP has already taken a significant hit from this farce, while the two parties continue to tear each other apart over trivial matters like healthcare subsidies, with another potential shutdown on January 30.
How can the market dare to be truly optimistic? Moreover, the Federal Reserve members are all playing dead, with all four voting regional presidents blowing cold winds. The expectation of a rate cut in December, which was almost a certainty, has now dropped from 91% to 60%. Any so-called positive news in this context is merely a prelude to negative outcomes.
Returning to the market, from the current structure, the false breakout at 104.5K has thoroughly exposed the bulls' weakness. The bearish sniper point is at 108.2K on the daily chart; if it can rebound to that level, I would consider shorting.
The support below is at 98.1K, and being closer to that level makes it easier to hold. The market is now very clear: until it breaks below 98K, any high-level rebound is merely an opportunity for the bears to take over. Playing short-term longs is fine, but don’t talk about long-term positions. The current trend is simply a downward oscillation.
On the Ethereum side, the weekly downward momentum is accelerating, with each spike being more severe than the last. The last low hit 3050, and this time it could directly drop to 2926. The recent pullback reached a low of 3369, which held up reasonably well. However, the weekly EMA52 is at 3336; if it breaks tonight, we could still play a short-term long.
If it truly breaks, it could drop directly to the 3280-3222 range. The points below 3300: 3280, 3222, 3150, 3072, 3050 may seem like a bunch of support levels, but in reality, they are all paper-thin; if the bears increase their volume, they could be pierced instantly.
Unless the market shrinks in volume and no one dares to short, there might be a chance for a slight rebound. If you really want to catch the bottom, you have to wait for the bears to increase their volume and for a spike to show blood; that’s when you know it’s the real bottom.
Master Looks at Trends:
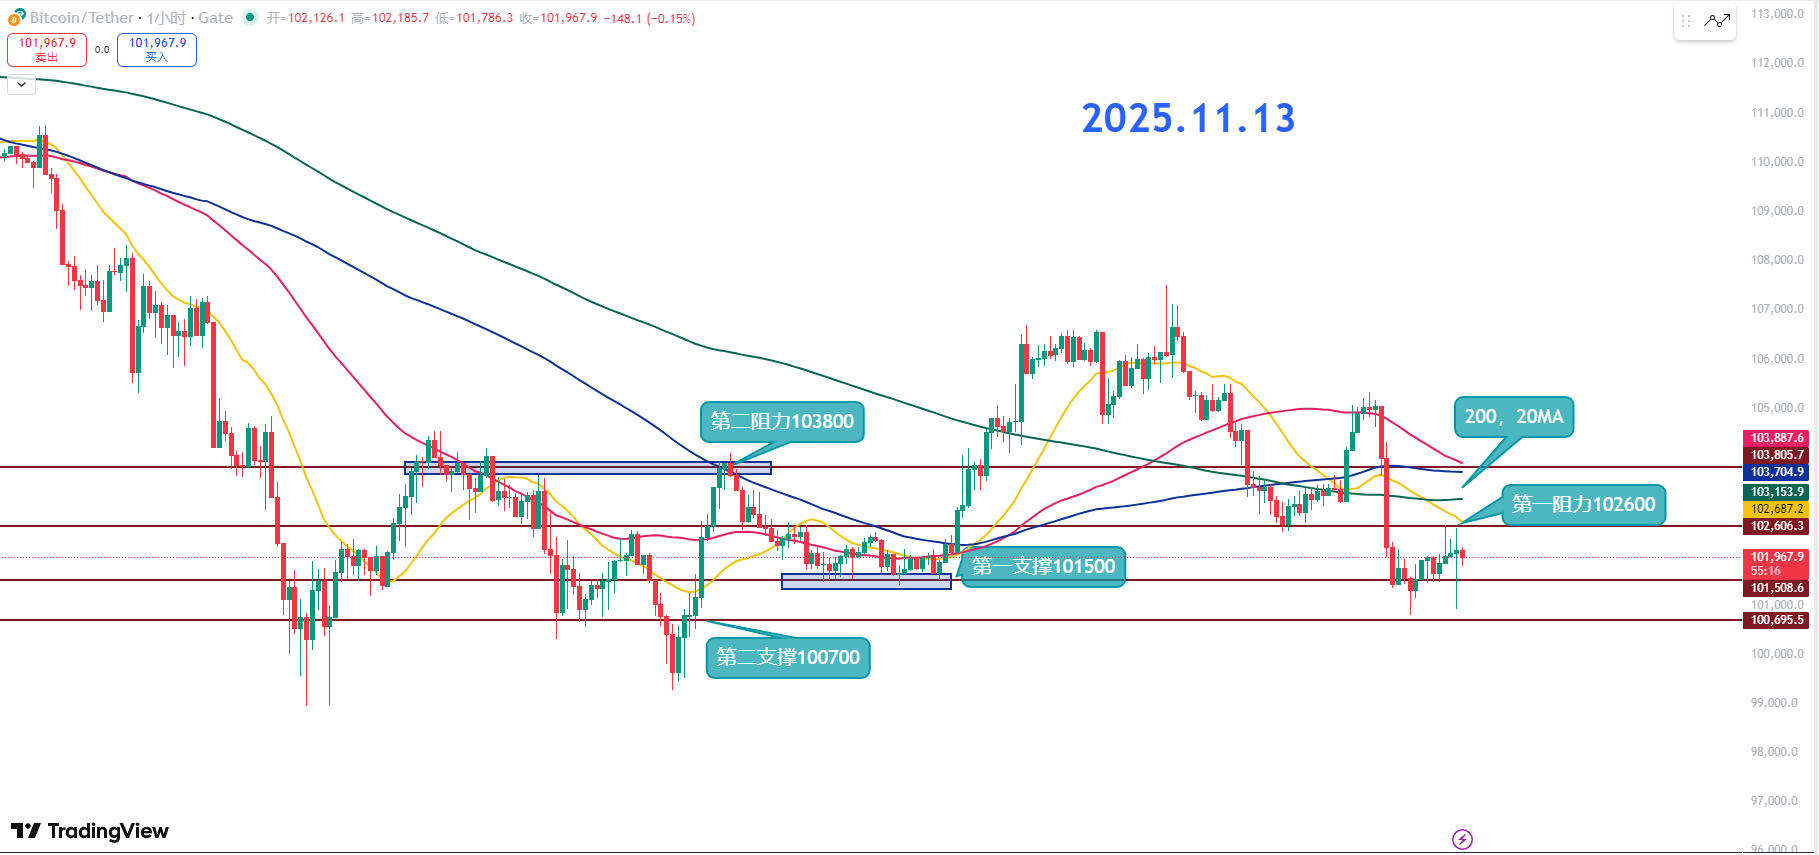
Resistance Level Reference:
Second Resistance Level: 103800
First Resistance Level: 102600
Support Level Reference:
First Support Level: 101500
Second Support Level: 100700
The first support level at 101.5K is the key short-term bottom. If it cannot hold, it will initiate an N-shaped decline, and the speed will accelerate. The first resistance is at 102.6K, which is a critical point that must be broken through in the short term, while also paying attention to the 200MA long-term moving average.
If it can stabilize above 103K, it indicates that buying pressure is increasing, and a long lower shadow at the bottom is also a good signal. If it can regain the 20 and 200MA, there might be a chance for a decent rebound.
Additionally, the first support at 101.5K is the lower edge of the range from November 9, while the second support from 100K to 99K, if lost, will push the market closer to that area. The first resistance at 102.6K is the previous low from November 12, and the second resistance at 103.8K is the high point from the range between November 4 and 8.
Currently, 101.5K is the lifeline for today. If it holds, there’s still a chance to breathe; once it breaks, not only will the decline accelerate, but we might also see 99K directly.
102.6K is the short-term resistance; whether it can break through will determine if the market has the qualification for a rebound. If it can push through 103.8K consecutively, with all moving averages flipped above, then the bulls will have some short-term hope.
11.13 Master’s Wave Strategy:
Long Entry Reference: Not currently applicable
Short Entry Reference: Short in the 103500-103800 range, Target: 102600-101500
If you truly want to learn something from a blogger, you need to keep following them, rather than making hasty conclusions after just a few market observations. This market is filled with performers; today they screenshot their long positions, and tomorrow they summarize their short positions, making it seem like they "catch the top and bottom every time," but in reality, it’s all hindsight. A truly worthy blogger will have a trading logic that is consistent, coherent, and withstands scrutiny, rather than jumping in only when the market moves. Don’t be blinded by flashy data and out-of-context screenshots; long-term observation and deep understanding are necessary to discern who is a thinker and who is a dreamer!
This article is exclusively planned and published by Master Chen (WeChat public account: Coin God Master Chen). If you want to learn more about real-time investment strategies, solutions, spot trading, short, medium, and long-term contract trading techniques, operational skills, and knowledge about candlesticks, you can join Master Chen for learning and communication. A free experience group for fans has been opened, along with community live broadcasts and other quality experience projects!

Warm reminder: This article is only written by the official public account (as shown above) of Master Chen; any other advertisements at the end of the article and in the comments section are unrelated to the author! Please be cautious in discerning authenticity, thank you for reading.
免责声明:本文章仅代表作者个人观点,不代表本平台的立场和观点。本文章仅供信息分享,不构成对任何人的任何投资建议。用户与作者之间的任何争议,与本平台无关。如网页中刊载的文章或图片涉及侵权,请提供相关的权利证明和身份证明发送邮件到support@aicoin.com,本平台相关工作人员将会进行核查。