History does not simply repeat itself, but it always carries similar rhymes. The performance of the global market in the first year of "Trump 2.0" is astonishingly similar to that of "Trump 1.0," and the historical alarm bells are ringing.
It has been a year since U.S. President Trump was re-elected, and during this time, the performance of the global financial markets has closely mirrored that of his first term's first year, showing a pattern of soaring risk assets, emerging markets outperforming U.S. stocks, and a weakening dollar.
However, historical data sends a strong warning: the second year of a presidential term is usually the worst for U.S. stocks and the period of highest market volatility.
1. Market Replication: The Astonishing Similarity of Two Trump Terms
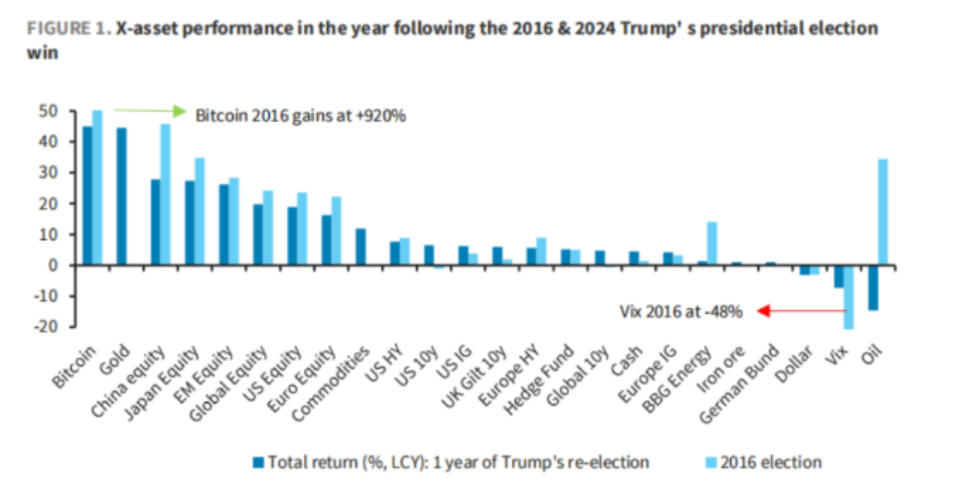
On the first anniversary of Trump's re-election, market trends present a strikingly similar picture to that of his first term. According to a report from Barclays Bank, the market performance in the first year after Trump's re-election almost perfectly replicated the trends following his initial victory in 2016.
● Risk assets (especially Bitcoin) surged significantly, stocks outperformed bonds, emerging markets and Chinese stocks outperformed U.S. stocks, while European stock markets lagged, and the dollar weakened during both periods.
● This similarity is not coincidental. Trump's policy direction at the beginning of both terms shows continuity, including an emphasis on tax cuts, deregulation, and a strong stance on trade policy.
These policy combinations boosted market confidence in the short term, especially for risk assets.
2. Subtle Differences: The Logic Behind the Variations
Despite the overall trend being similar, there are significant differences in market performance during the first year of the two terms.
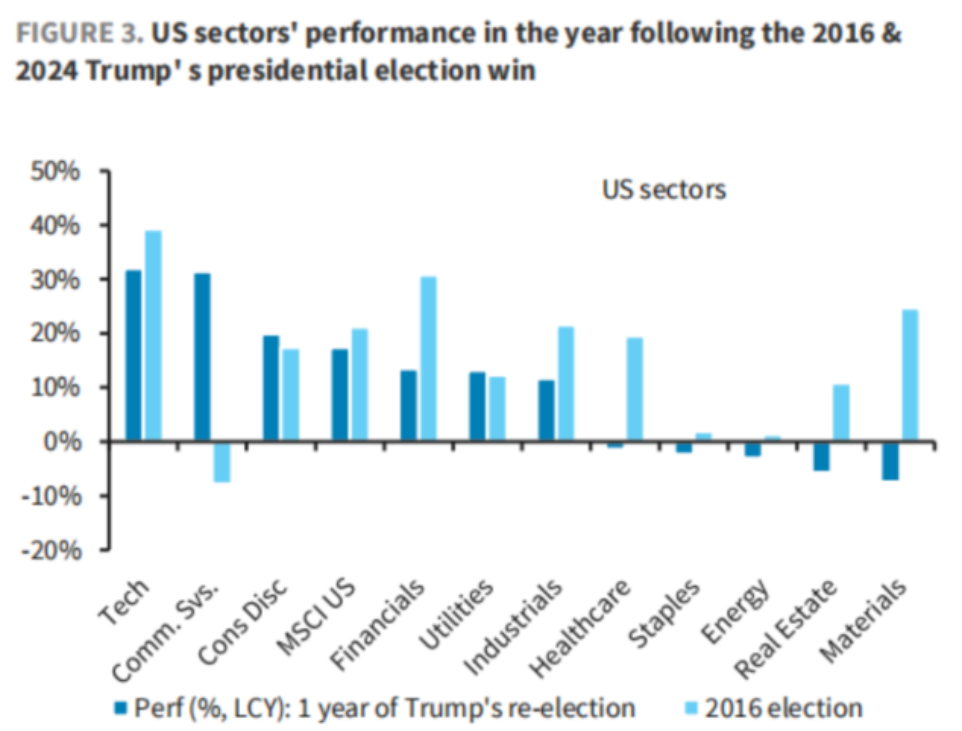
● During the "Trump 2.0" period, gold prices surged, while they remained subdued during the Trump 1.0 period; oil prices fell sharply, in stark contrast to their status as one of the best-performing assets between 2016-2017. Sector differentiation is also more pronounced. Unlike the broad gains across sectors during 1.0, this time, the performance of U.S. and European stock sectors is more divided.
● In the U.S., tech stocks once again took the lead, but materials, real estate, and energy sectors declined. In Europe, financials and utilities performed well, while healthcare, real estate, and materials sectors recorded declines.
● The performance of cryptocurrencies was more eye-catching during the "Trump 2.0" period. Trump frequently reached out to the crypto community, considering establishing a Bitcoin reserve and signing the "Genius Act." In July, the total market capitalization of cryptocurrencies first surpassed $4 trillion. In October, Bitcoin rose to a record $126,000.
3. Historical Alarm: The Curse of the Second Year of a Presidential Term
Historical data rings alarm bells for the upcoming second year. Looking back at data since 1927, the second year of a U.S. presidential term (the midterm election year) is the year with the lowest average and median returns for the S&P 500 index.
The experience of Trump's first term (2016-2020) also confirms this pattern.
● Bitcoin, emerging markets/Chinese stocks, and Japanese stocks, which performed excellently in the first year (2017), all turned to decline in the second year (2018). Meanwhile, market volatility surged, with the VIX index soaring by 71% in 2018.
● The significant drop in U.S. stocks in 2018 greatly diminished the "Trump effect." The S&P 500 index fell by 4.97% in Trump's second year, marking the worst performance since the George W. Bush administration in 2002.

4. Volatility Returns: Memories of 2018
● In 2018, trade frictions became headline news, continuously putting pressure on economic growth and ultimately leading to stock market declines. U.S. stocks faced a historic "Black Wednesday," setting multiple records for the longest consecutive declines since Trump took office.
● On October 10, 2018, the Dow Jones Industrial Average closed down 831.83 points, a drop of 3.15%, marking the largest single-day decline since February of that year. The Nasdaq plummeted by 4.08%, and the S&P 500 index closed down 3.29%, also the largest single-day decline since February.
● At that time, the CBOE Volatility Index (VIX), which measures market fear, surged by 42.4%. The sharp decline in U.S. stocks led to widespread discontent on Wall Street regarding the Trump administration, as Trump initiated tariffs against the EU, Mexico, and Canada, doubling down on regressive protectionist policies.
5. Future Outlook: Market Drivers for 2026
The main trading narrative in the global market will shift from Trump's election victory to preparations for the midterm elections. As the last major election of Trump's political career, the outcome of the 2026 midterm elections will directly determine the control of Congress and influence the future political landscape for Trump and the Republican Party. Trump's policy considerations for the midterms include trade policy, monetary policy, and fiscal policy.
These three aspects complement each other, forming the main trading narrative for overseas policy in 2026.
● In terms of trade policy, Trump may escalate tariff conflicts again to shift blame, garner votes, and pressure the Federal Reserve to cut interest rates for fiscal revenue.
● Regarding monetary policy, the new chair of the Federal Reserve will take office in May 2026, at which point the Fed is expected to initiate unexpected and excessive interest rate cuts beyond what the economy requires.
● On fiscal policy, interest rate cuts and tariffs will provide funding for expansionary fiscal policies. In the second half of 2026, Trump is expected to continue implementing expansionary fiscal policies to build momentum for the midterm elections.
Citibank analysts expect the dollar to recover lost ground in 2026. During the U.S. midterm elections next year, there will likely be more policies supporting U.S. economic growth, including deregulation, early tax cuts, and delayed spending reduction policies, all of which should support a rebound in U.S. economic growth expectations.
The market trajectory seems to have entered a cycle. Barclays Bank's report points out that the current market bears a high resemblance to the "Trump 1.0" period, but this joy of replication may be short-lived.
Historical data shows that the second year of a presidential term is often the most challenging period for U.S. stocks—the average and median returns of the S&P 500 index in this year are the lowest.
Looking towards the faintly visible 2026 midterm elections, investors must remain vigilant: the specter of volatility may be unleashed once again.
Join our community to discuss and grow stronger together!
Official Telegram community: https://t.me/aicoincn
AiCoin Chinese Twitter: https://x.com/AiCoinzh
OKX benefits group: https://aicoin.com/link/chat?cid=l61eM4owQ
Binance benefits group: https://aicoin.com/link/chat?cid=ynr7d1P6Z
免责声明:本文章仅代表作者个人观点,不代表本平台的立场和观点。本文章仅供信息分享,不构成对任何人的任何投资建议。用户与作者之间的任何争议,与本平台无关。如网页中刊载的文章或图片涉及侵权,请提供相关的权利证明和身份证明发送邮件到support@aicoin.com,本平台相关工作人员将会进行核查。


