This week, after the K update, Bitcoin is currently operating near the lower Bollinger Band. The significant drop last week has created a large gap between the price and the 5-day moving average. From the current indicators, both MACD and KDJ are showing bearish trends, and the 5-day and 10-day moving averages continue to slightly suppress the price. The overall trend of the candlestick chart remains bearish, and in the short term, if the price cannot effectively stabilize above the 5-day moving average, the bearish trend will continue to dominate.
From the daily chart perspective, the current Bitcoin trend is in a downward wave 2 pattern. Although the short-term MACD and KDJ indicators are showing a rebound sentiment, the resistance area above at 108500-110000 is a high-pressure zone. If the daily chart cannot stabilize above any resistance during a rebound, Bitcoin will continue its downward wave, starting wave 3 of the decline.
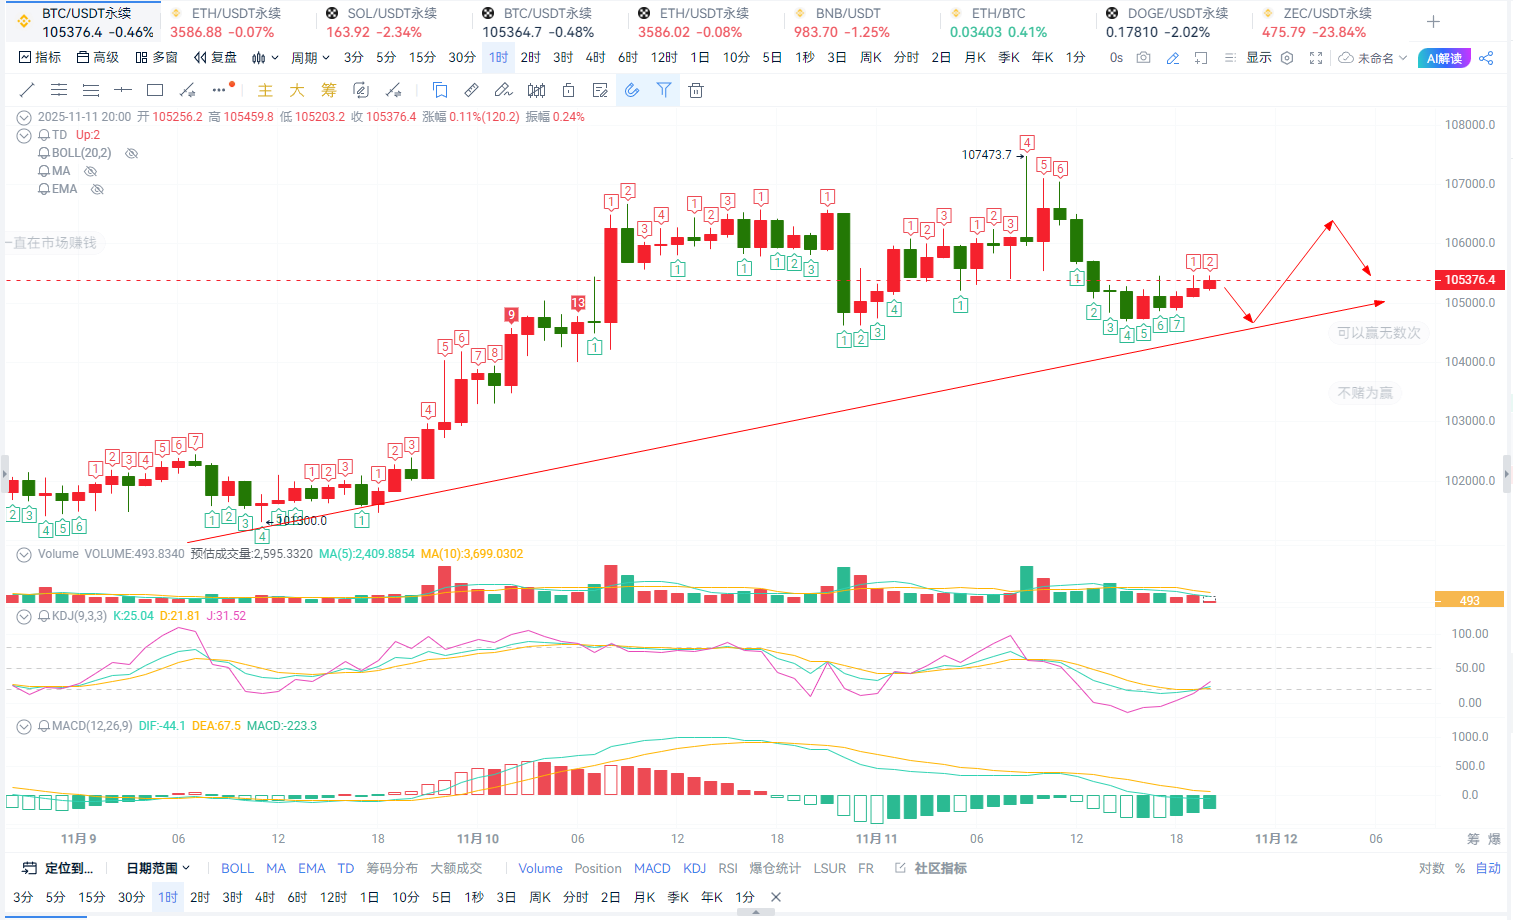
On the 4-hour chart, Bitcoin is currently fluctuating near the middle Bollinger Band. From the indicators, there is a significant divergence between bulls and bears. The MACD indicator shows a reduction in bullish momentum, and the KDJ lines are also showing a retracement sentiment. However, the 30-day moving average and the overall trend of the Bollinger Band are leaning upwards. Combined with the hourly chart, the current market is leaning towards a box-like fluctuation adjustment. The support reference for the low point is around 104200. In terms of the evening to early morning trend, if the short-term pullback cannot effectively break below 104200, a strategy to capture a short-term low can be considered.
Operational strategy: 104500-103500 low, target: 106000-107500, stop loss down by 500 points.
Enter near the reference pressure level.
Ethereum's short-term trend is basically in sync with Bitcoin. The high resistance is around 3700-3837, and the short-term low support is around 3510. My personal view for the evening to early morning trend is consistent with Bitcoin, and a strategy to capture a short-term low followed by a high can be considered.
Operational strategy: 3540-3500 low, target: 3600-3640, stop loss: 3475. The reference point for the entry is near the resistance level. This forecast is expected to be sufficient for the current trend, and I will continue to follow up.
Personal views are for reference only; there may be delays in article review and push notifications. The market changes rapidly, so specific entry and exit points should be based on real-time guidance. Please exercise caution when entering the market.

免责声明:本文章仅代表作者个人观点,不代表本平台的立场和观点。本文章仅供信息分享,不构成对任何人的任何投资建议。用户与作者之间的任何争议,与本平台无关。如网页中刊载的文章或图片涉及侵权,请提供相关的权利证明和身份证明发送邮件到support@aicoin.com,本平台相关工作人员将会进行核查。


