The market has been on an upward trend these past two days. Here, we believe it is a rebound, not a reversal, so our suggestion is to focus on short positions.
Weekly Level
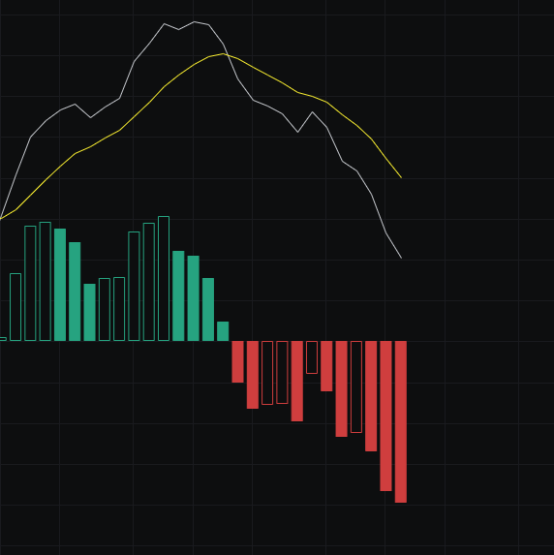
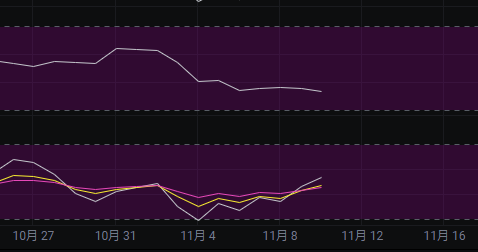
From the MACD perspective, the energy bars continue to decline, and both the fast and slow lines are under pressure. Therefore, there are still no signs of a bottoming out from the MACD, so we maintain a bearish outlook.
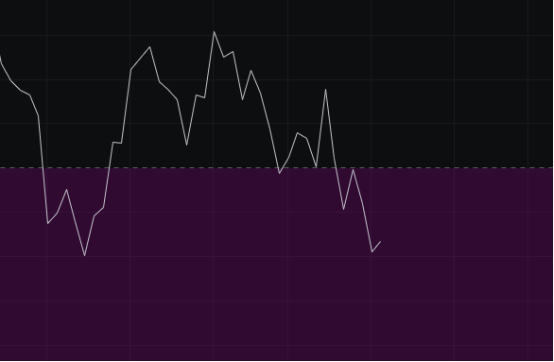
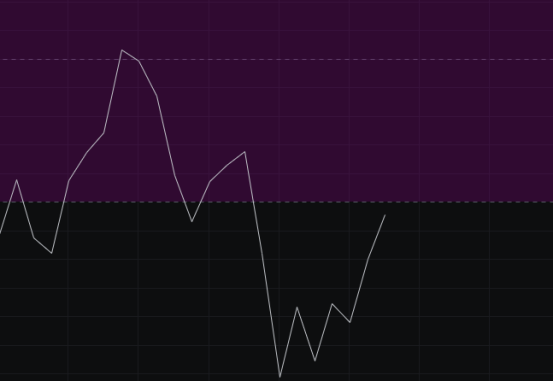
Looking at the CCI, after the last drop below 100, the rebound did not manage to stay above 100, and it has now fallen to around 67. If this week closes with a bearish candle, we can conclude that the CCI will not return above 100 in the short term, marking the end of a bull market that has lasted for over two years.
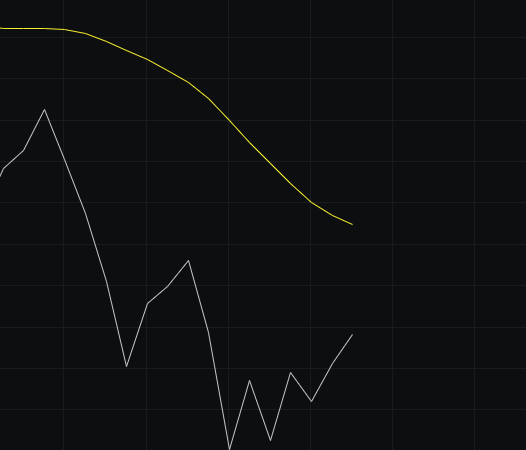
From the OBV perspective, with two consecutive weeks of decline, the outflow of OBV is quite evident, causing the slow line to nearly flatten. We will wait for the slow line to flatten before observing the direction chosen by the OBV, and then decide whether to go long or short.
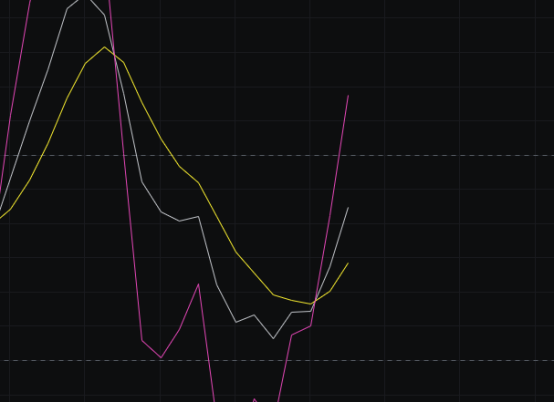
Looking at the KDJ, it continues to decline and is currently around 33. Next, we will watch for the KDJ to reach 20. Since it is moving downward, the market is in a downtrend, so we continue to hold a bearish view.
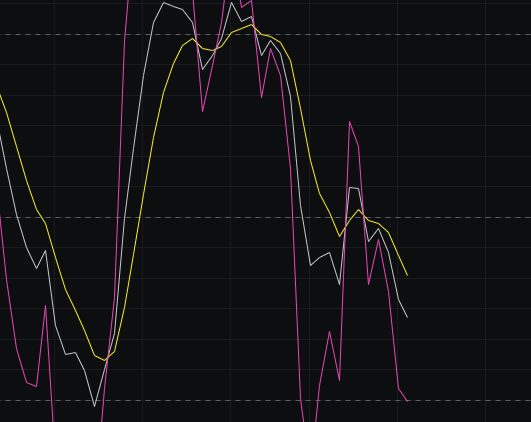
From the MFI and RSI perspectives, both indicators are generally moving downward, indicating a bearish bias. We will first look for them to reach around 20, and then observe the market's direction.
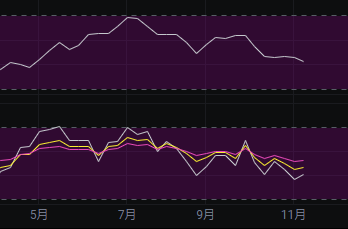
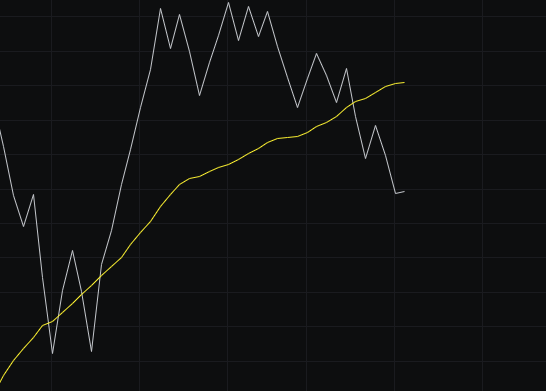
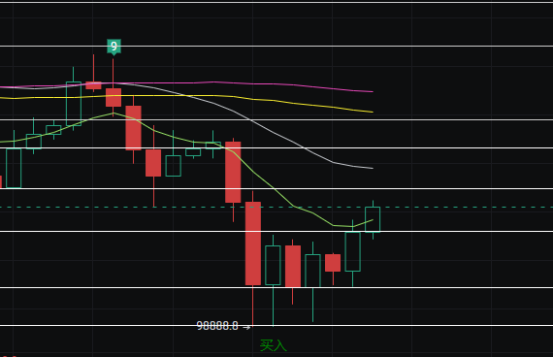
Looking at the moving averages, last week the market broke below the 30 line, and the BBI intersected with 30. If next week closes with a bearish candle, it will form a death cross, and we will continue to maintain a bearish outlook. If next week closes bullish, we will then look at the specific pattern.
From the Bollinger Bands perspective, the bands are currently opening, and the price has hit the lower band. The market is likely to continue moving downward to widen the bands. Therefore, even though it is currently a bullish candle, it is very likely to close as a bearish candle. If it ultimately closes bullish, the bands should not open but rather move sideways or continue to narrow.
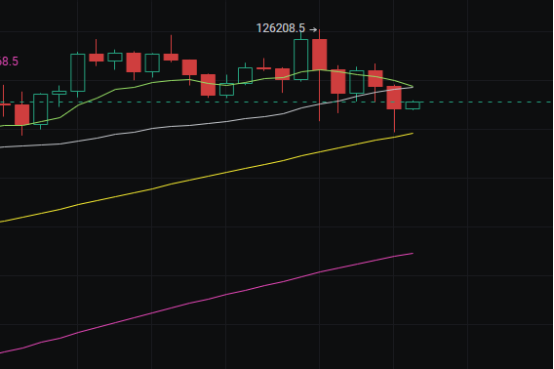
Daily Level
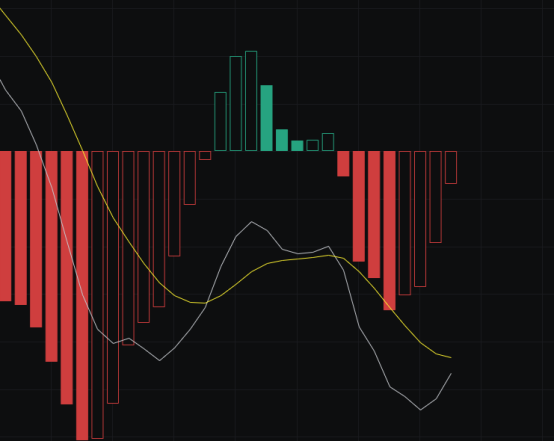
From the MACD perspective, looking at the larger cycle, there has been a bullish divergence, so a rebound here is logical. As for how high the rebound will go, it is still unclear, and we will continue to wait for tomorrow.
Looking at the CCI, it has now returned to around -100. If the market tends toward a decline, we should avoid touching -100. If this is the case, even if today does not close bullish, it should at least not close bullish tomorrow. We will judge the intentions of the market makers based on the market movements over the next two days. Of course, we cannot rule out the possibility of it hitting above -100 and then coming back down.
From the OBV perspective, the volume has rebounded in recent days, forming a W bottom. Therefore, shorts should still manage their stop losses, but the rebound in volume is not significant, and we will need a few more days to see how it develops.
Looking at the KDJ, it has returned to around 40. We will see if it can break through 50; if it does, it would be very unfavorable for the bears. We will keep observing over the next two days.
From the MFI and RSI perspectives, the two indicators are moving in different directions. For both indicators to move in the same direction, we need to see a continuous trend in the same direction over the next few days to develop a new wave of market movement. We will see how it unfolds.
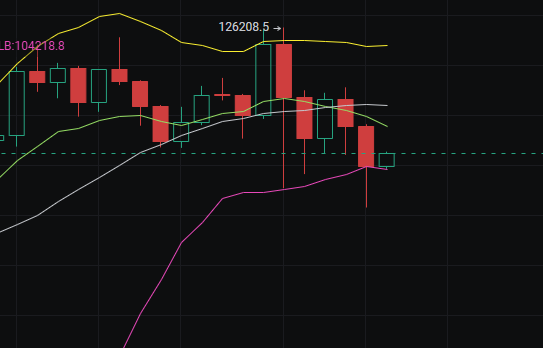
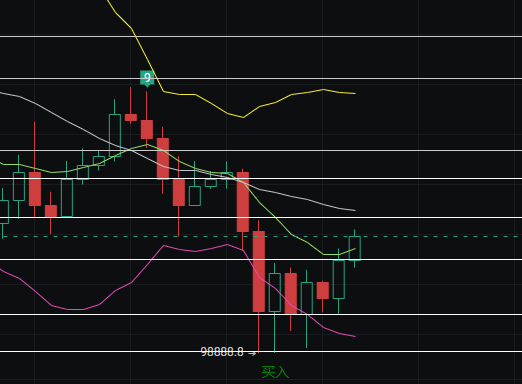
Looking at the moving averages, the price is currently above the BBI. Whether it can maintain this closing situation remains to be seen. However, since the price has risen above, it indicates that the bulls are still exerting strength. We will observe whether the bulls can continue to exert strength.
From the Bollinger Bands perspective, the upper and lower bands are only showing a slight downward trend. If tomorrow closes bullish again, it may flatten out or start to narrow, bringing the market back to a wide range of fluctuations, which is bad news for the bears. If tomorrow can close bearish, there is still a possibility of developing a downward channel, so the Bollinger Bands are at a critical juncture.
In summary: Several indicators are currently at critical junctures, and the market direction will depend on the movements over the next two days. Today's resistance is seen at 107500-109000, and support is at 105000-103500.
免责声明:本文章仅代表作者个人观点,不代表本平台的立场和观点。本文章仅供信息分享,不构成对任何人的任何投资建议。用户与作者之间的任何争议,与本平台无关。如网页中刊载的文章或图片涉及侵权,请提供相关的权利证明和身份证明发送邮件到support@aicoin.com,本平台相关工作人员将会进行核查。