The current overall market in the cryptocurrency space is still very weak, with poor rebound strength. Although there has been a pin bar recovery, we still need to wait for a right-side signal before considering going long.
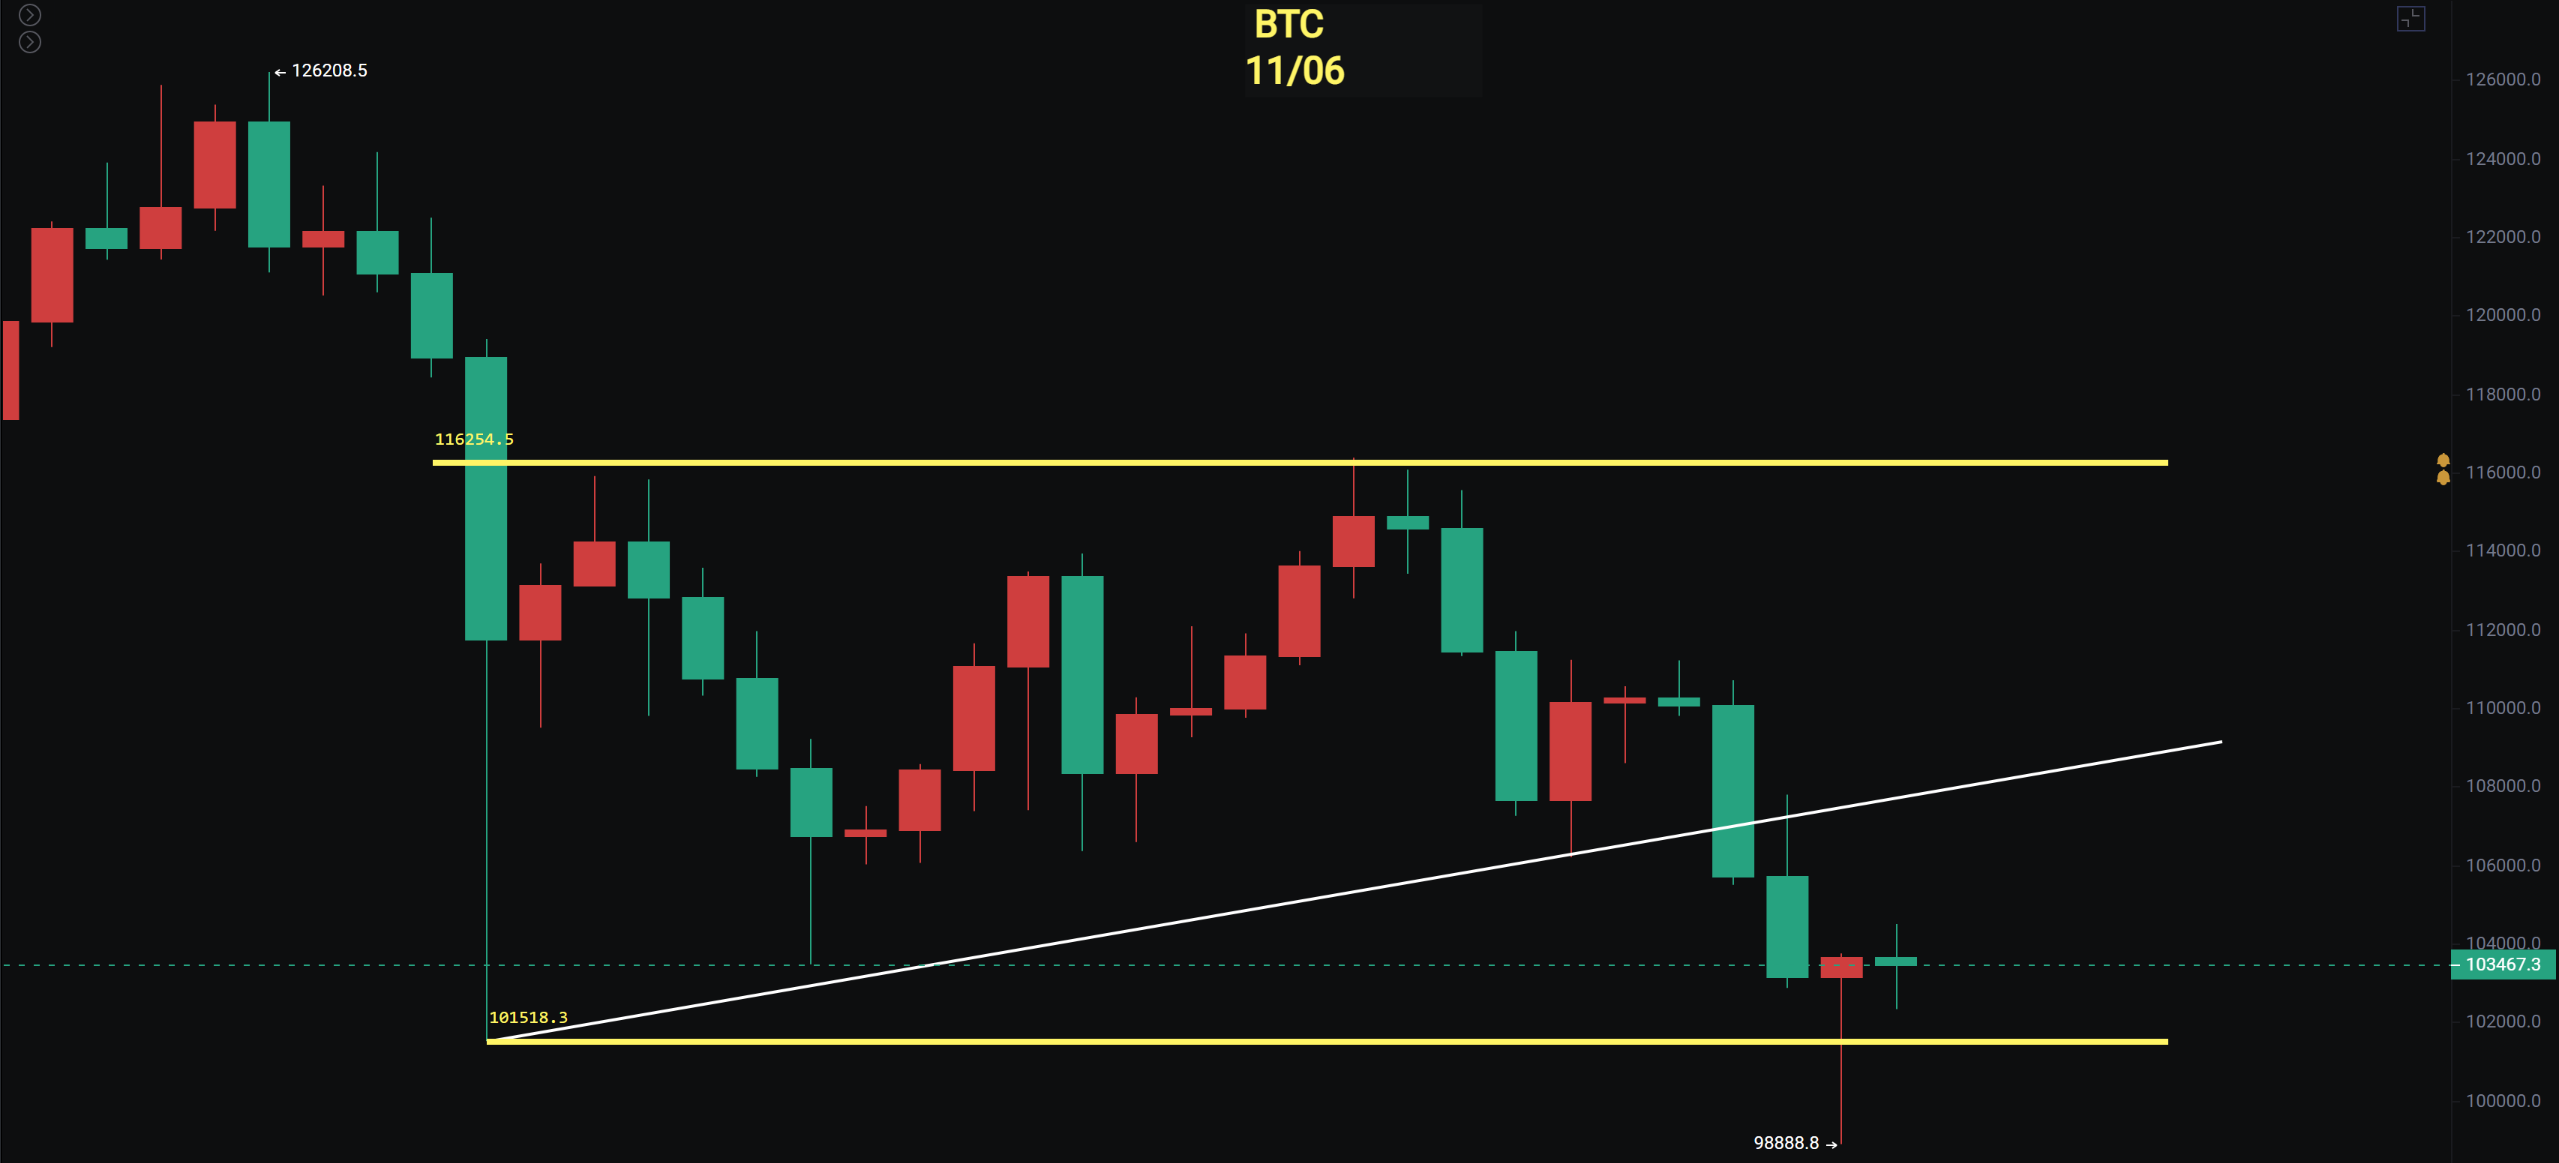
From a long-term perspective, the monthly MACD indeed shows signs of a death cross, and the histogram is continuously shortening. However, this does not rule out the possibility of significant short-term fluctuations. The weekly chart is testing the 126,000 mark, with the MACD histogram growing below the zero axis, limiting the potential for short-term upward movement. From the naked candlestick perspective, the sharp drop at 126,000 has formed an engulfing pattern, and the next three weeks show a double bullish engulfing pattern with a bearish candle, indicating an overall weak trend. However, yesterday's offline pin bar rebound is still a left-side opportunity, and we need to wait for a clear right-side opportunity.
Bitcoin
Bitcoin's lowest pin bar was at 98,888, breaking below the low of the sharp drop on the 10th. However, the pin bar was recovered yesterday, and it is still a left-side opportunity. From the perspective of rebound strength, it remains weak. If the key resistance cannot recover, the downward trend cannot be changed. We are currently waiting to see if a right-side entry opportunity can emerge.
In the short term, the price must recover above 107,000 to continue looking for a rebound. Tomorrow is Friday, and the weekend is approaching. If this week's weekly close is below 107,000, the downward trend will continue.
Support: 98,888 - 101,516
Resistance: 107,000 - 111,500
Ethereum
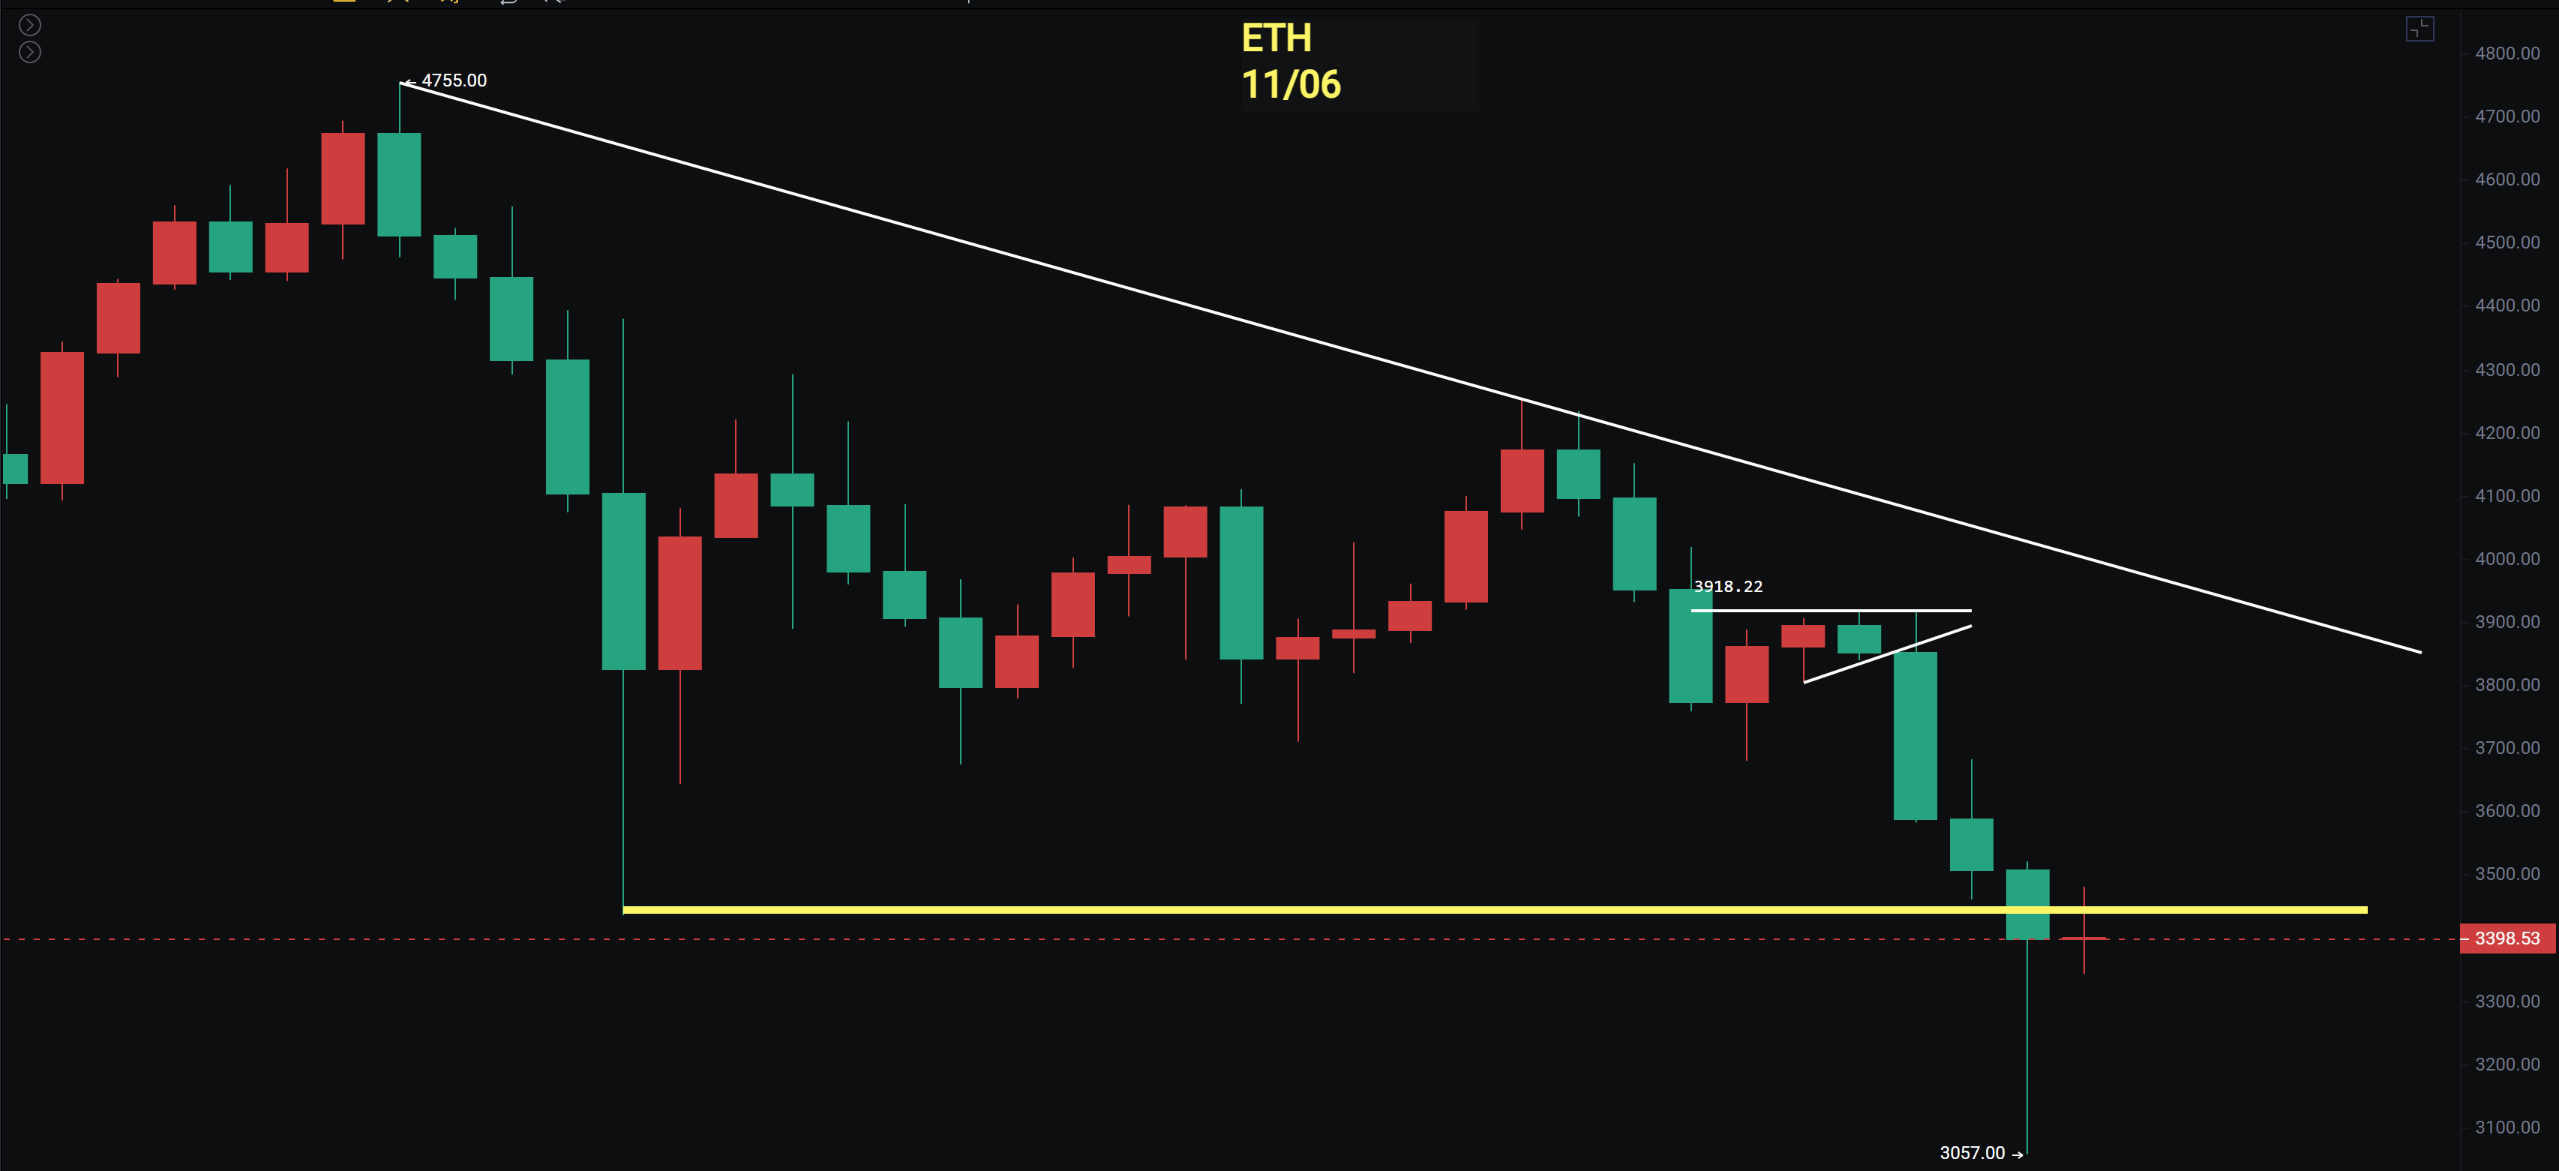
As mentioned in the weekly analysis, after a double bearish engulfing pattern, it was followed by a doji and then broke below the range. The weekly MACD continues to cross below the zero axis, and the daily chart has broken below the pin bar from the 10th, with no recovery in the rebound, with the lowest pin bar at 3,057. Like Bitcoin, we are also paying attention to whether it can produce a right-side opportunity.
The 4-hour chart shows a breakout from a converging triangle with an upward rebound, just touching the bottom of the pin bar. Next, we will focus on whether it can recover back inside the triangle.
Support: 3,057 - 3,435
Resistance: 3,680 - 3,920
If you like my views, please like, comment, and share. Let's navigate through the bull and bear markets together!!!
The article is time-sensitive and for reference only, with real-time updates.
Focusing on K-line technical research, sharing global investment opportunities. Public account: BTC Trading Prince Fusu

免责声明:本文章仅代表作者个人观点,不代表本平台的立场和观点。本文章仅供信息分享,不构成对任何人的任何投资建议。用户与作者之间的任何争议,与本平台无关。如网页中刊载的文章或图片涉及侵权,请提供相关的权利证明和身份证明发送邮件到support@aicoin.com,本平台相关工作人员将会进行核查。