As the annual CPI growth rate in the U.S. approaches 3.0%, it strengthens the market's expectations for an imminent interest rate cut by the Federal Reserve; meanwhile, the U.S. and China are expected to hold a summit in Seoul at 9 a.m. on Thursday to ease global geopolitical tensions.
Affected by this, the three major U.S. stock indices closed at new highs on the 28th, but Bitcoin showed a stark contrast. After rebounding to test $116,000 last night, Bitcoin began to fluctuate and decline after leaving a long upper shadow. As of the time of writing, the price is quoted at $112,600, giving back the gains made earlier this week.
Next, at 2:00 a.m. on the 30th, the Federal Reserve is set to announce its latest interest rate decision. A 25 basis point rate cut is a foregone conclusion, but it is important to pay attention to the subsequent monetary policy press conference held by Fed Chair Powell. I hope everyone is prepared for risk management!!!
Bitcoin Four-Hour Chart
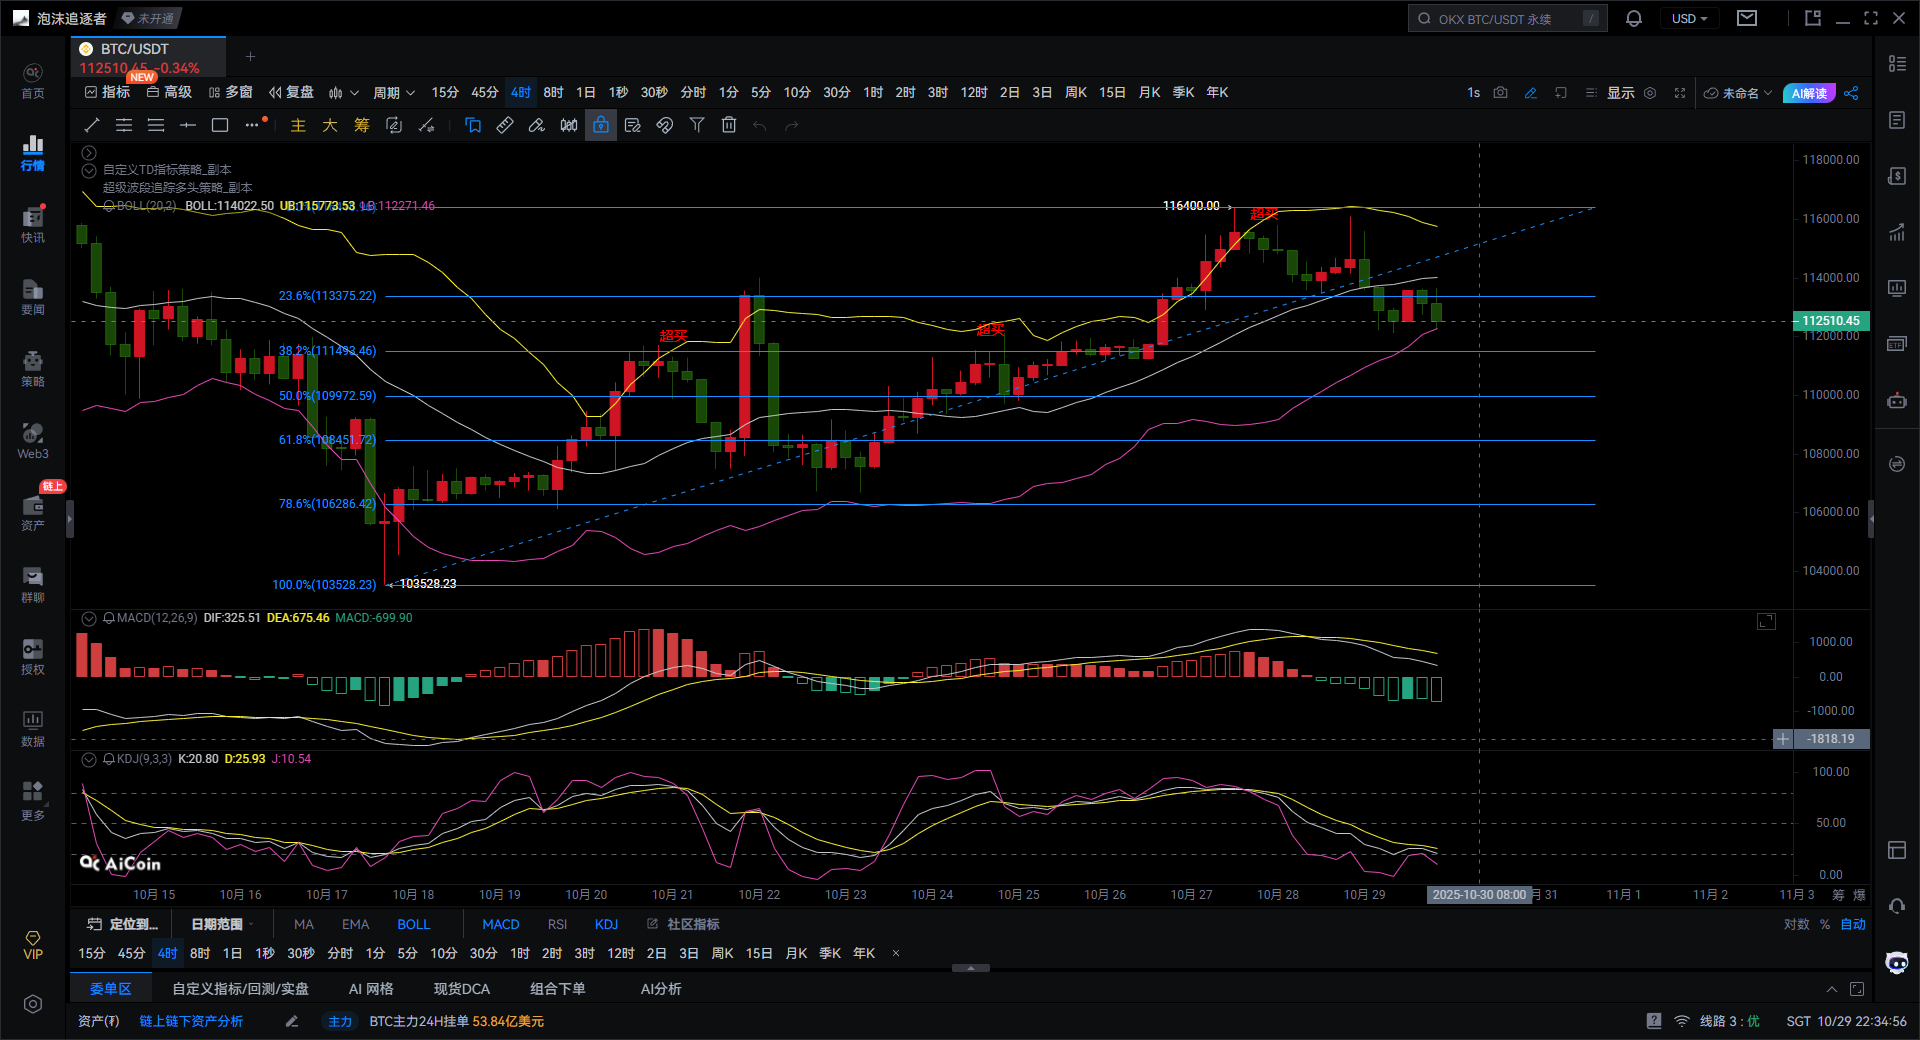
From the four-hour chart of Bitcoin, it can be observed that the current price is around $113,500, in a phase of adjustment and consolidation after the previous high of $116,400.
First, let's analyze the Fibonacci retracement levels. The retracement line stretches from the previous low of $103,582 to the recent high of $116,416. The current price is operating between the 38.2% retracement level of about $111,500 and the 23.6% retracement level of about $113,375, forming a medium-term adjustment support area. $111,500 is the first support level, combined with the middle band of the Bollinger Bands and moving average support, making it a key defense for bulls; if broken, it may test the 50% retracement level of $109,972; the critical defense level is the 61.8% retracement level of $108,000, and breaking this would damage the upward structure. On the pressure side, short-term resistance is at $114,000, corresponding to the upper band of the Bollinger Bands and the upper edge of the downward channel; strong resistance is at the previous high of $116,400, and a breakout would target $118,000-$120,000. Overall, if the support at $111,500 can be maintained, the room for a pullback is limited, and a rebound is expected to continue.
Bollinger Bands analysis shows a slight contraction, indicating a decrease in volatility, with the market preparing to choose a direction. The upper band around $116,000 serves as short-term resistance, while the middle band around $111,500 is key support, coinciding with the Fibonacci 38.2% level; if the lower band around $107,000 is touched, it may enter a deep adjustment. The price has rebounded from the middle band but has not reached the upper band, indicating that it is still in a repair phase in the short term. If two consecutive four-hour candlesticks close above the middle band, the Bollinger Bands may open upwards, indicating a strengthening market.
The MACD indicator on the four-hour level shows that the DIF line is running below the DEA line, but the distance between the two lines is narrowing, and the MACD green histogram is shortening and converging. If a golden cross forms, it indicates a weakening of bearish momentum, and bulls will take over. This suggests that the current situation is one of weakening bearishness and brewing rebound, with the appearance of a golden cross confirming the rebound signal, targeting $114,000-$116,000.
The KDJ indicator is diverging upwards after a low-level golden cross, with the K value around 29, D value around 28, and J value around 30, having rebounded from the oversold area. Short-term signals are leaning bullish, with the golden cross indicating increased buying pressure; if the K value breaks above the 50 midline, the rebound will accelerate; if there is a flattening or death cross, caution is needed for momentum decline. Both KDJ and MACD indicate that the short-term repair rebound may continue.
In summary, the overall trend is still in a technical pullback phase within an upward channel, confirming support through a retest. The main structure of the rise since mid-October remains intact, with the depth of the pullback limited to the 38.2% level, and indicators show a reduction in bearishness. If the price stabilizes at the middle band and breaks above $114,000, it will confirm a reversal signal. The short-term bias is towards consolidation and strength, while the mid-term trend remains upward.
There are three possible scenarios moving forward: the first possibility is a continuation of the rebound, conditioned on maintaining $111,500 and breaking above $114,000, with signals including a MACD golden cross and KDJ upward movement, targeting $116,400-$118,000, which has a higher probability. The second scenario is a consolidation phase, oscillating repeatedly in the $111,000-$114,000 range, with signals being MACD sideways and Bollinger Bands contracting, which has a medium probability. The third scenario is a deep pullback, conditioned on breaking below $109,900 with increased volume, with signals being a MACD death cross and expanding green histogram, targeting $108,000-$106,000, which has a lower probability.
In conclusion, I offer the following suggestions for reference (the interest rate decision and important speeches at 2 a.m. on the 30th may lead to sharp fluctuations!).
Gradually and lightly accumulate long positions in Bitcoin in the $112,000-$112,500 range, targeting $114,000-$116,000, and if broken, continue to look towards $118,000.
Giving you a 100% accurate suggestion is not as good as providing you with the right mindset and trend; teaching someone to fish is better than giving them fish. The suggestion is to earn for a moment, but learning the mindset will allow you to earn for a lifetime!

Time of writing: (2025-10-29, 21:30)
(Written by - Daxian Says Coin) Disclaimer: Online publication has delays, and the above suggestions are for reference only. Investment carries risks; please proceed with caution!
免责声明:本文章仅代表作者个人观点,不代表本平台的立场和观点。本文章仅供信息分享,不构成对任何人的任何投资建议。用户与作者之间的任何争议,与本平台无关。如网页中刊载的文章或图片涉及侵权,请提供相关的权利证明和身份证明发送邮件到support@aicoin.com,本平台相关工作人员将会进行核查。