Today is Tuesday, October 28th.
The daily closing line looks really bad, but if we want to continue to rise, this level must not be broken. We can see that Bitcoin's daily closing line has formed a candlestick with an upper shadow, and this type of candlestick looks very ugly. The reason depends on the previous pressure level. We can see that a very ugly top signal has also appeared at the 30-minute level under this pressure, making the upcoming market not particularly optimistic.
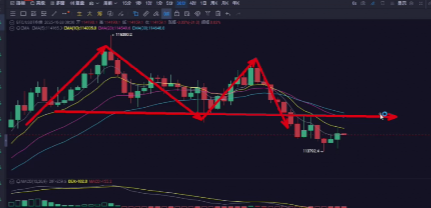
If we want the market to continue to rise, we need to look at a very key support level. Next, I will provide market analysis. Today's movement, after the U.S. stock market opened with a gap up, continued to rise in the last trading session. However, Bitcoin and Ethereum did not follow this situation, indicating that the main funds have been drawn away by the U.S. stock market, rather than pushing up alongside it, which means that the bullish funds have been reduced to some extent.
Looking down, we can see that at the 4-hour level, there have been 14 consecutive bearish candles. Currently, it has already hit the support level. There are two support levels below and two resistance levels above: one at 113,200 and the other at 111,600. We are now very close to the 113,200 support level, which is the previous neckline support level.
If this level is directly lost, two situations may occur. The first is that we can see the MACD; if it breaks below 113,200, the continuous green bars will be broken. If it wants to rise later, the situation will be completely different. If it does not break and pushes up, then the potential for a breakout later will be very strong.
If it breaks and produces red bars, then this round of rising will basically end around 115,400. The market situation will be very different. From the 30-minute level, we can see that there is still some capital gradually entering the market at this position, slowly forming an alternating pattern of bullish and bearish candles, which is much better than the previous consecutive bearish candles.
The sentiment has eased, and the previous small support range is at this position, so it can drop to this level without any problem.
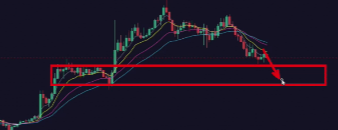
However, it cannot break down through the bearish candles, so the next position is the key point we need to pay attention to. Once it breaks down, this wave of rising will directly end. As long as it does not break down, it can still be bought on dips.
We hope for a stretch upward. Some students may not have observed the bottom pattern, so let's take a look at Ethereum's movement. Ethereum is currently also showing a very ugly candlestick with an upper shadow on the daily chart.
Yesterday, it was just mentioned that a bullish candle broke through four bearish candles, but today's movement looks very ugly, similarly pressured by the upper resistance level around 4,250.
For Ethereum's support and resistance levels, the first resistance level is around 4,260. If it goes higher, there is another significant resistance level at 4,340, which is a heavily pressured area. In the short term, it is understandable that some main funds choose to retreat.
However, to continue moving upward, strong support from the lower support level is needed. It has now reached the support level near 4,070, and we need to see if this level can hold.
The 30-minute level also shows that the current movement is still very challenging. After this wave of movement rose to 4,253, it retraced downwards. Last night, it surged again and is now falling back, forming an M-shaped pattern. At the pressure level of the M-shaped pattern, it currently does not have a good breakthrough capability.
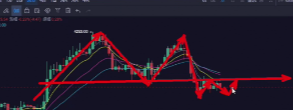
So we need to continue looking down at the support level. Below, a platform has been built, similar to Bitcoin, which can also break down, but it cannot break through. Therefore, some adventurous friends can consider placing long positions at this level, with the extreme stop loss being the lowest position at 4,042. Let's see if it can move upward. Overall, the 4-hour moving average is still trending upward.
Similarly, the MACD situation has also shown this issue, where it has formed green bars that continue to rise in an uninterrupted manner.
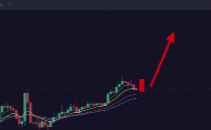
Next, these two 4-hour candlesticks indicate that by 8 PM today, there must be a medium bullish candle to break through. Otherwise, this wave of movement is very likely to retrace downward.
免责声明:本文章仅代表作者个人观点,不代表本平台的立场和观点。本文章仅供信息分享,不构成对任何人的任何投资建议。用户与作者之间的任何争议,与本平台无关。如网页中刊载的文章或图片涉及侵权,请提供相关的权利证明和身份证明发送邮件到support@aicoin.com,本平台相关工作人员将会进行核查。


