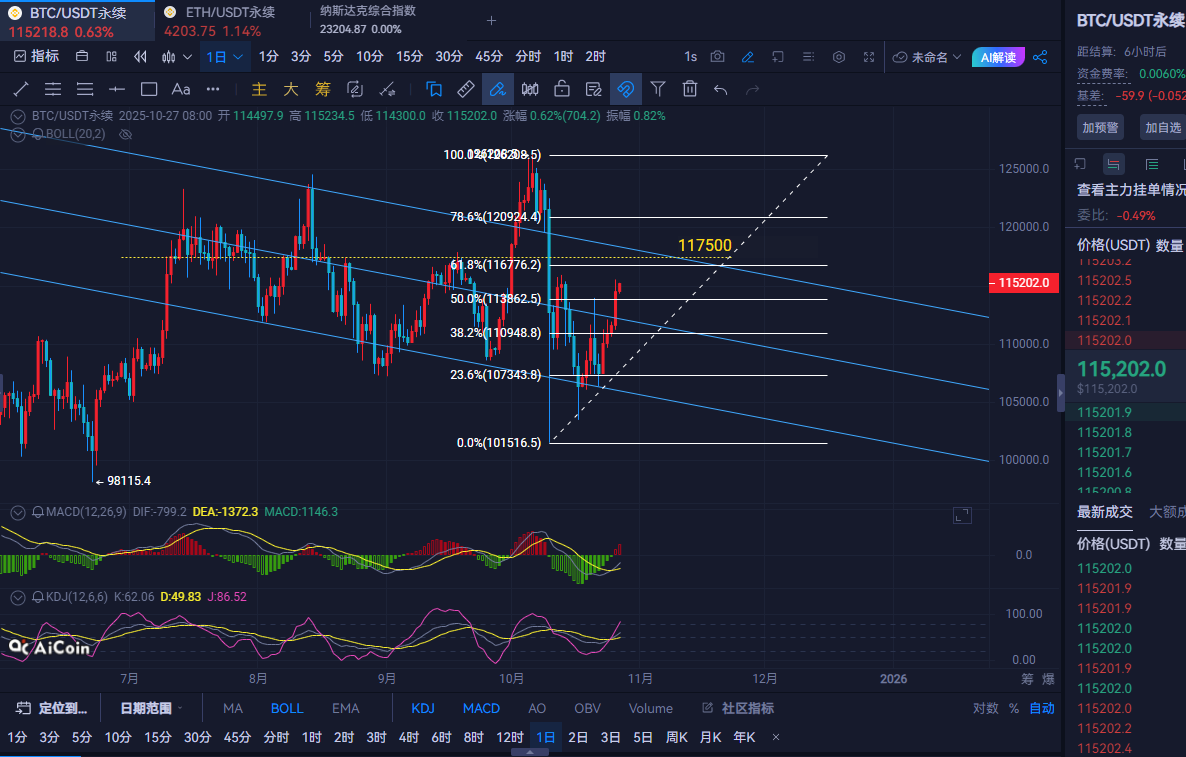
Intraday Analysis: From the daily chart, Bitcoin's price has broken through the middle track with five consecutive bullish candles and has stabilized. However, from the daily trend perspective, it is still in a downward channel. This recent surge is merely a correction phase after a previous significant rise. Unless it breaks through the 61.8% resistance level at 116800 and the key resistance level at 117500, the trend cannot be considered reversed. Of course, the short-term rebound is relatively strong, and it depends on whether it can break through the short-term resistance at 116000. This level will determine whether the upward trend will continue.
Ethereum has been moving upward in sync in recent days, breaking through the previous high point and reaching the key resistance level at 4200. Although the lows are gradually rising and the MACD histogram is shrinking from negative to positive, indicating an increase in bullish momentum, it is still below the zero line, and the trend has not been fully confirmed. The trading volume on October 27 was 48980, significantly reduced compared to the previous day, indicating weakened buying power during the upward movement. The volume from October 23 to 26 was notably high, especially on October 24, which reached 423789, indicating that funds have entered the bottom area.

Trading Suggestions: For Bitcoin, buy near the current price of 115200-114700, with a stop loss at 114000, targeting 116300-116800. If it breaks through, look for 117000-117500; if it doesn't break, consider shorting.
For Ethereum, buy near the current price of 4180-4150, with a stop loss at 4120, targeting 4287-4336. If it breaks through, look for 4390-4410; if it doesn't break, consider shorting.
This strategy is for reference only; please invest cautiously and secure profits (for real-time updates, follow the public account: Ethereum Kai).
免责声明:本文章仅代表作者个人观点,不代表本平台的立场和观点。本文章仅供信息分享,不构成对任何人的任何投资建议。用户与作者之间的任何争议,与本平台无关。如网页中刊载的文章或图片涉及侵权,请提供相关的权利证明和身份证明发送邮件到support@aicoin.com,本平台相关工作人员将会进行核查。


