Li Ying in the Crypto Circle: Bitcoin Latest Market Analysis on 10.27
Article Published on 2025.10.27------00:10
The current price of Bitcoin is 113,700. Li Ying believes that Bitcoin is in an upward trend, with strong bullish signals shown in the technical analysis. The short-term moving averages have formed a golden cross, indicating a high possibility of trend continuation. However, the extreme shrinkage in trading volume has created a significant divergence between price and volume, suggesting that the current rise lacks sufficient capital support, posing a risk of a pullback in the short term. The key support level at 112,000 has formed a bullish engulfing pattern at this position, hinting at a potential rebound opportunity in the short term, but attention should be paid to changes in trading volume to confirm the continuation of the trend. The daily chart shows a strong upward trend with multiple consecutive bullish candles. The 2-hour K-line shows significant pressure at 114,000. The MACD on the 2-hour chart may enter an adjustment phase. The EMA on the 2-hour moving averages shows a bullish arrangement, with short positions reaching a critical point. Li Ying chooses to take profits and wait for new signals before re-entering the market.
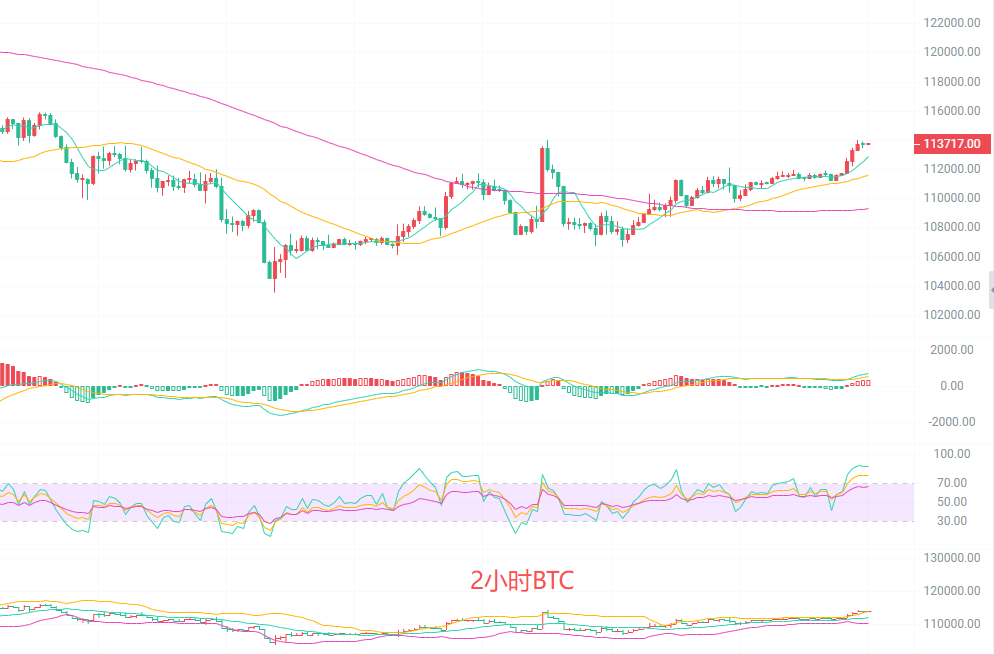
Short-term Strategy Reference:
- Long Entry Point: 112,000, Stop Loss: 111,500, Stop Loss Distance: 500 points, Target: 113,500
- Short Entry Point: 114,000, Stop Loss: 114,500, Stop Loss Distance: 500 points, Target: 112,000
Ethereum Latest Market Analysis
Before publication, the current price of Ethereum is 4,075. Li Ying observes that Ethereum is currently in an upward trend, with the technical analysis showing relatively strong bullish signals. The MA bullish arrangement and the resonance of the golden cross indicate that the market is in a strong upward phase, while the recent bullish engulfing pattern further strengthens the expectation that prices may continue to rise in the short term. The 2-hour K-line shows multiple consecutive bullish candles, with higher highs being established. The daily chart is in a strong phase. The MACD on the 2-hour chart shows enhanced bullish momentum with room for further increases. The EMA shows a bullish arrangement, with strong support below. After taking profits at high levels, Li Ying suggests waiting for a pullback to the bottom support before continuing to go long, and to be patient for signals to appear.
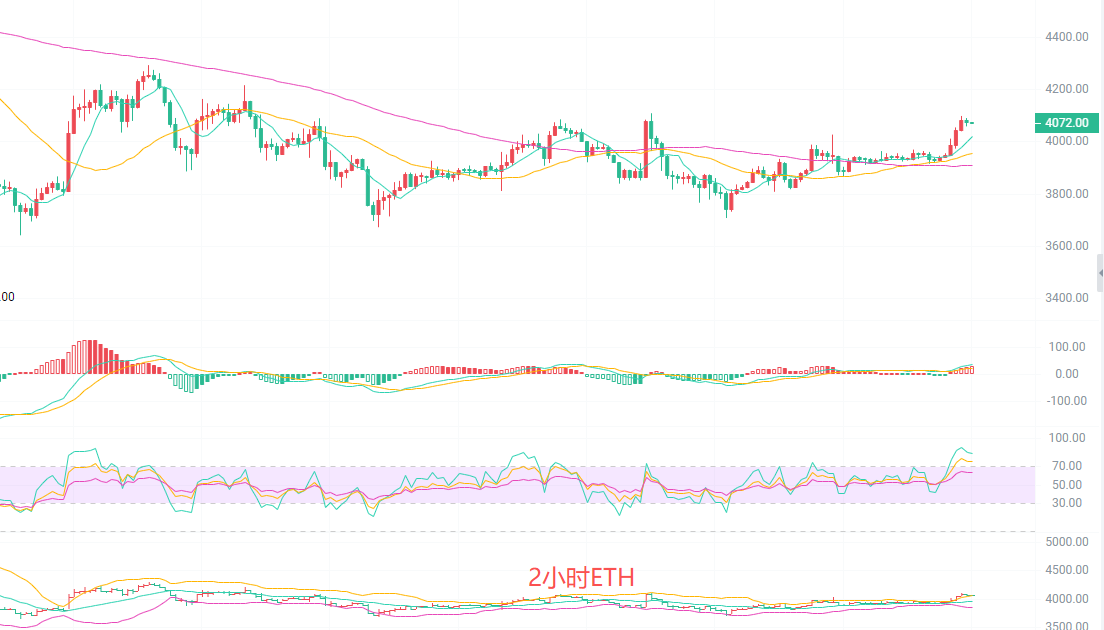
Short-term Point Reference:
- Short Entry Point: 4,100, Stop Loss: 4,150, Stop Loss Distance: 50 points, Target: 4,000
- Long Entry Point: 4,000, Stop Loss: 3,950, Stop Loss Distance: 50 points, Target: 4,100
The above content is exclusively original by Li Ying. Please indicate the source when reprinting! The article's publication review has a delay, and the market changes rapidly. The above suggestions are for reference only, and risks are borne by the reader. I hope Li Ying's insights will be helpful to you!

The content of the article is time-sensitive and for reference only; risks are borne by the reader.
免责声明:本文章仅代表作者个人观点,不代表本平台的立场和观点。本文章仅供信息分享,不构成对任何人的任何投资建议。用户与作者之间的任何争议,与本平台无关。如网页中刊载的文章或图片涉及侵权,请提供相关的权利证明和身份证明发送邮件到support@aicoin.com,本平台相关工作人员将会进行核查。


