
The US stock market continues its upward trend, reaching a historic high. After a pullback on the 10th, it has achieved an upward breakthrough after 10 working days of fluctuations. Although external disturbances still exist, the strong characteristics of the market are evident—sharp declines and pullbacks in a bull market are normal. In terms of gold, after a 5% drop on the 21st, it has consecutively formed three doji candles, with weak rebound strength, and there is still potential for further decline.
There are only three days left until the next Federal Reserve interest rate cut, which is basically confirmed. There will be another rate cut within the year, and the market is currently more focused on the interest rate cut timeline in 2026.
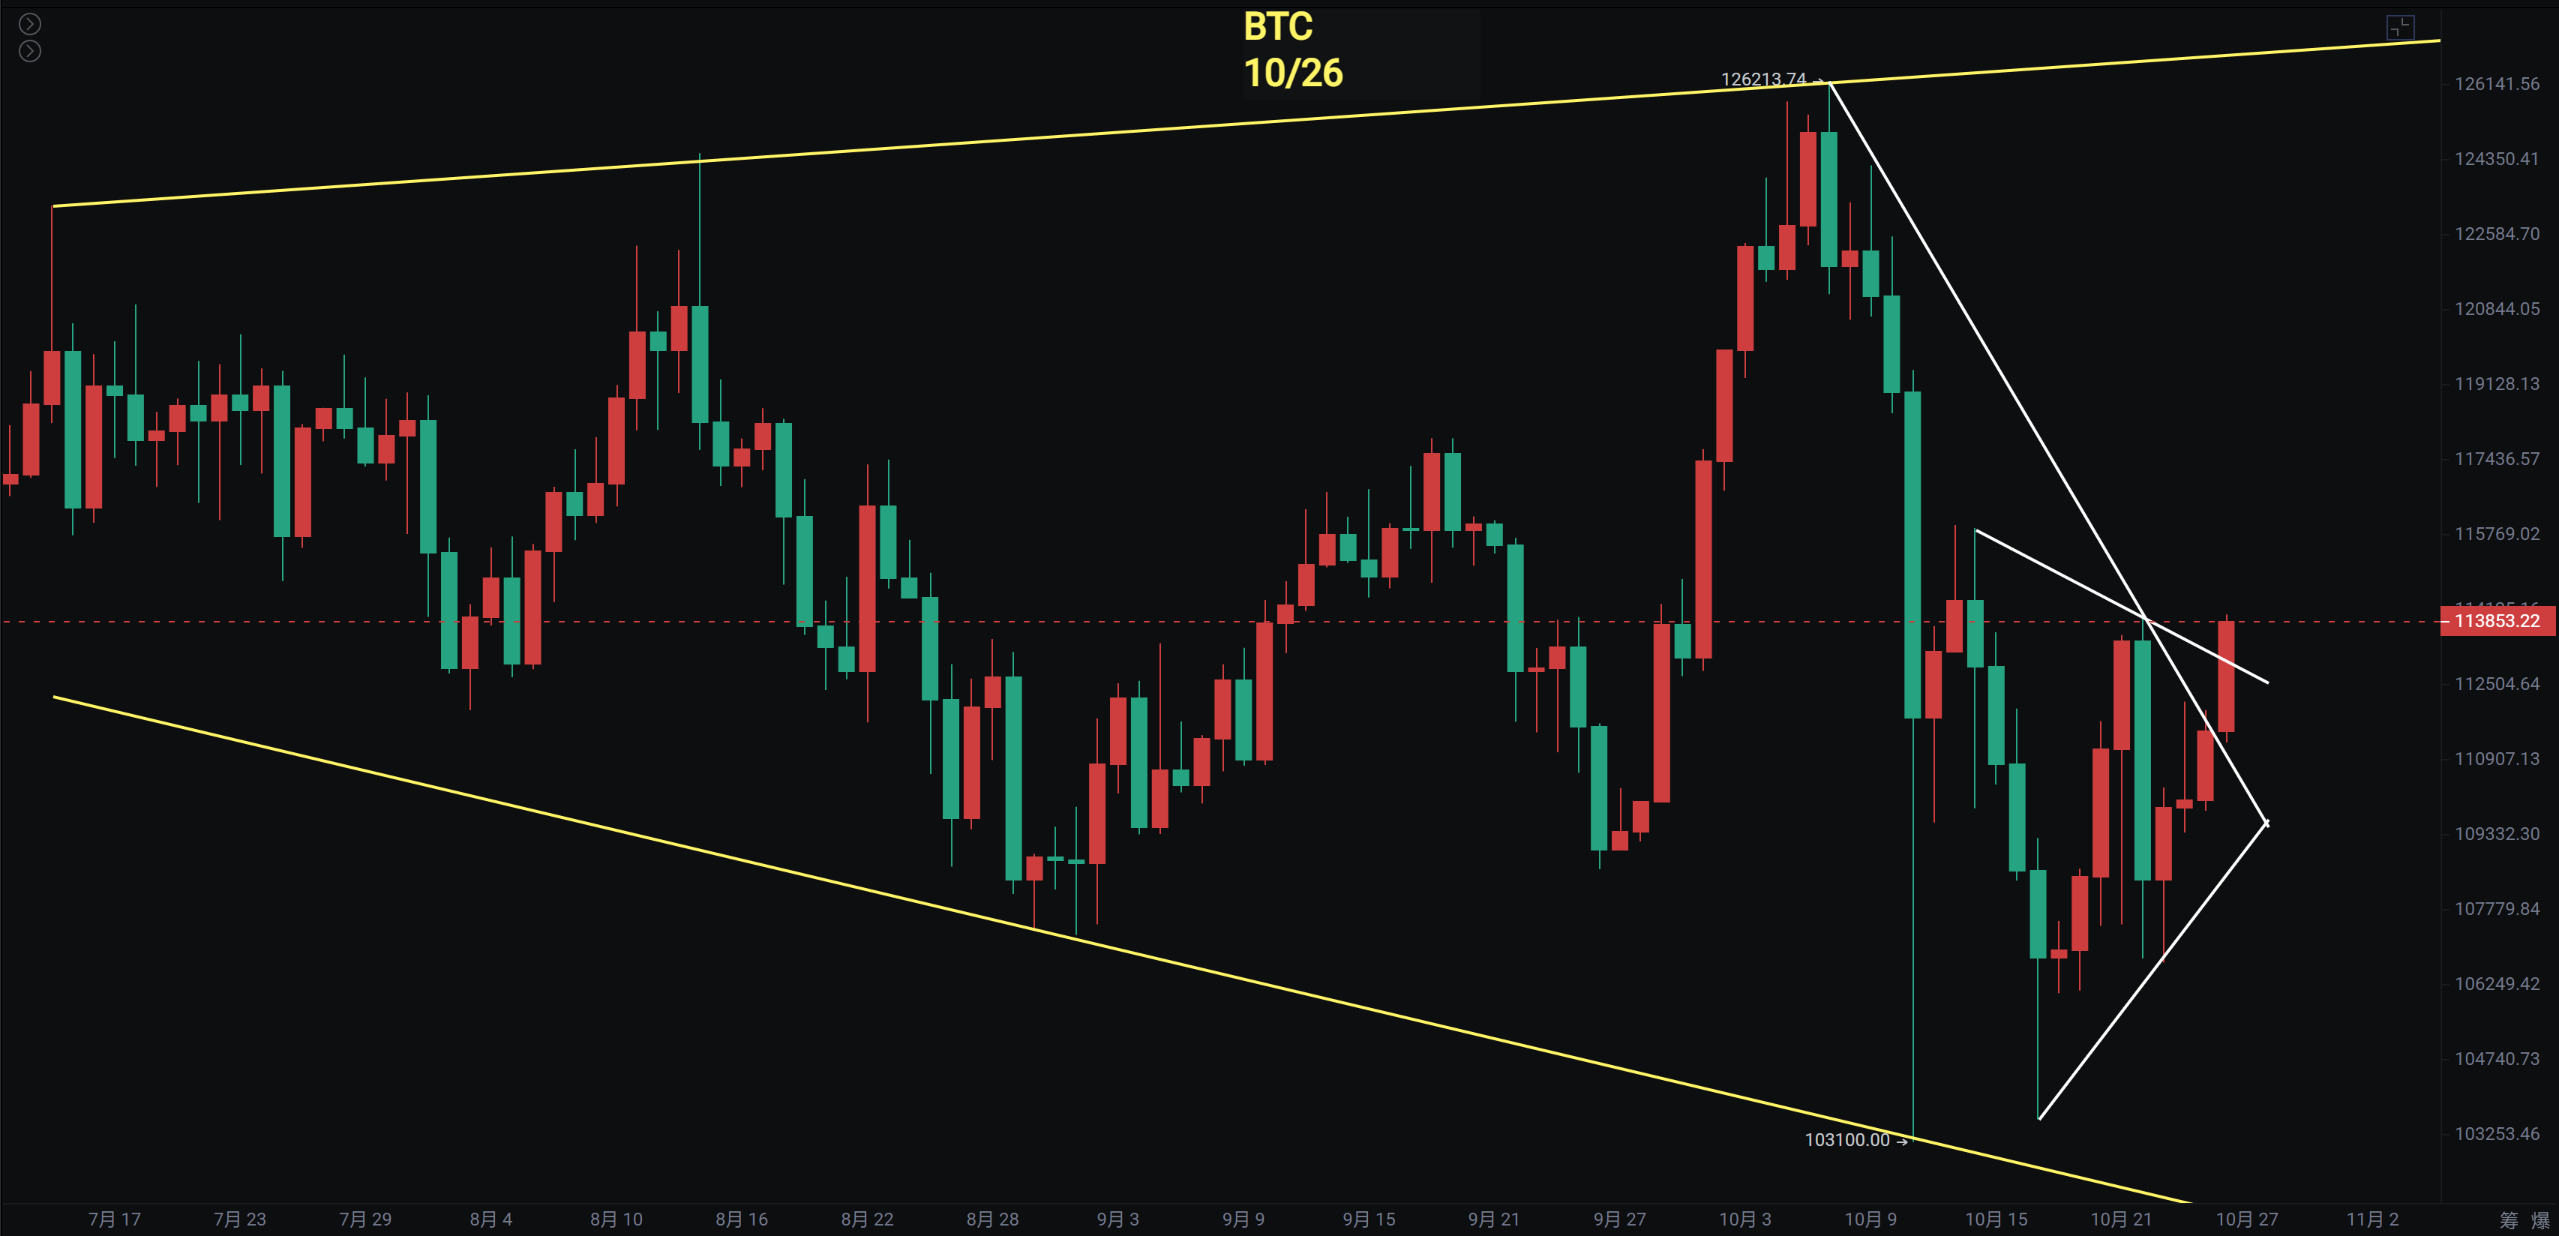
Bitcoin
Bitcoin has been fluctuating narrowly for nearly half a month after a sharp drop, with a second bottom test not breaking the previous low, currently priced around $113,700. This week's trend is crucial and will determine whether the market continues to fluctuate upward or extends the adjustment: the weekly chart shows a bullish candlestick pattern, and the price shows signs of breaking through the middle Bollinger band. If the closing next week can stabilize above the middle Bollinger band, it is expected to challenge the upper Bollinger band. From a technical perspective, the current rebound is hindered at the Fibonacci 0.5 retracement level. If it can reach the 0.6 to 0.786 range, it will likely experience a pullback before restarting the rebound.
On a short-term basis, both the 4-hour and daily charts have formed a triangle breakout pattern, currently facing pressure in the $115,000-$116,000 range. If this range can be broken, the rebound target can look towards the Fibonacci 0.618 to 0.786 range.
● Support level: 101,516 - 103,500

● Resistance level: 116,000 - 118,600 - 121,000
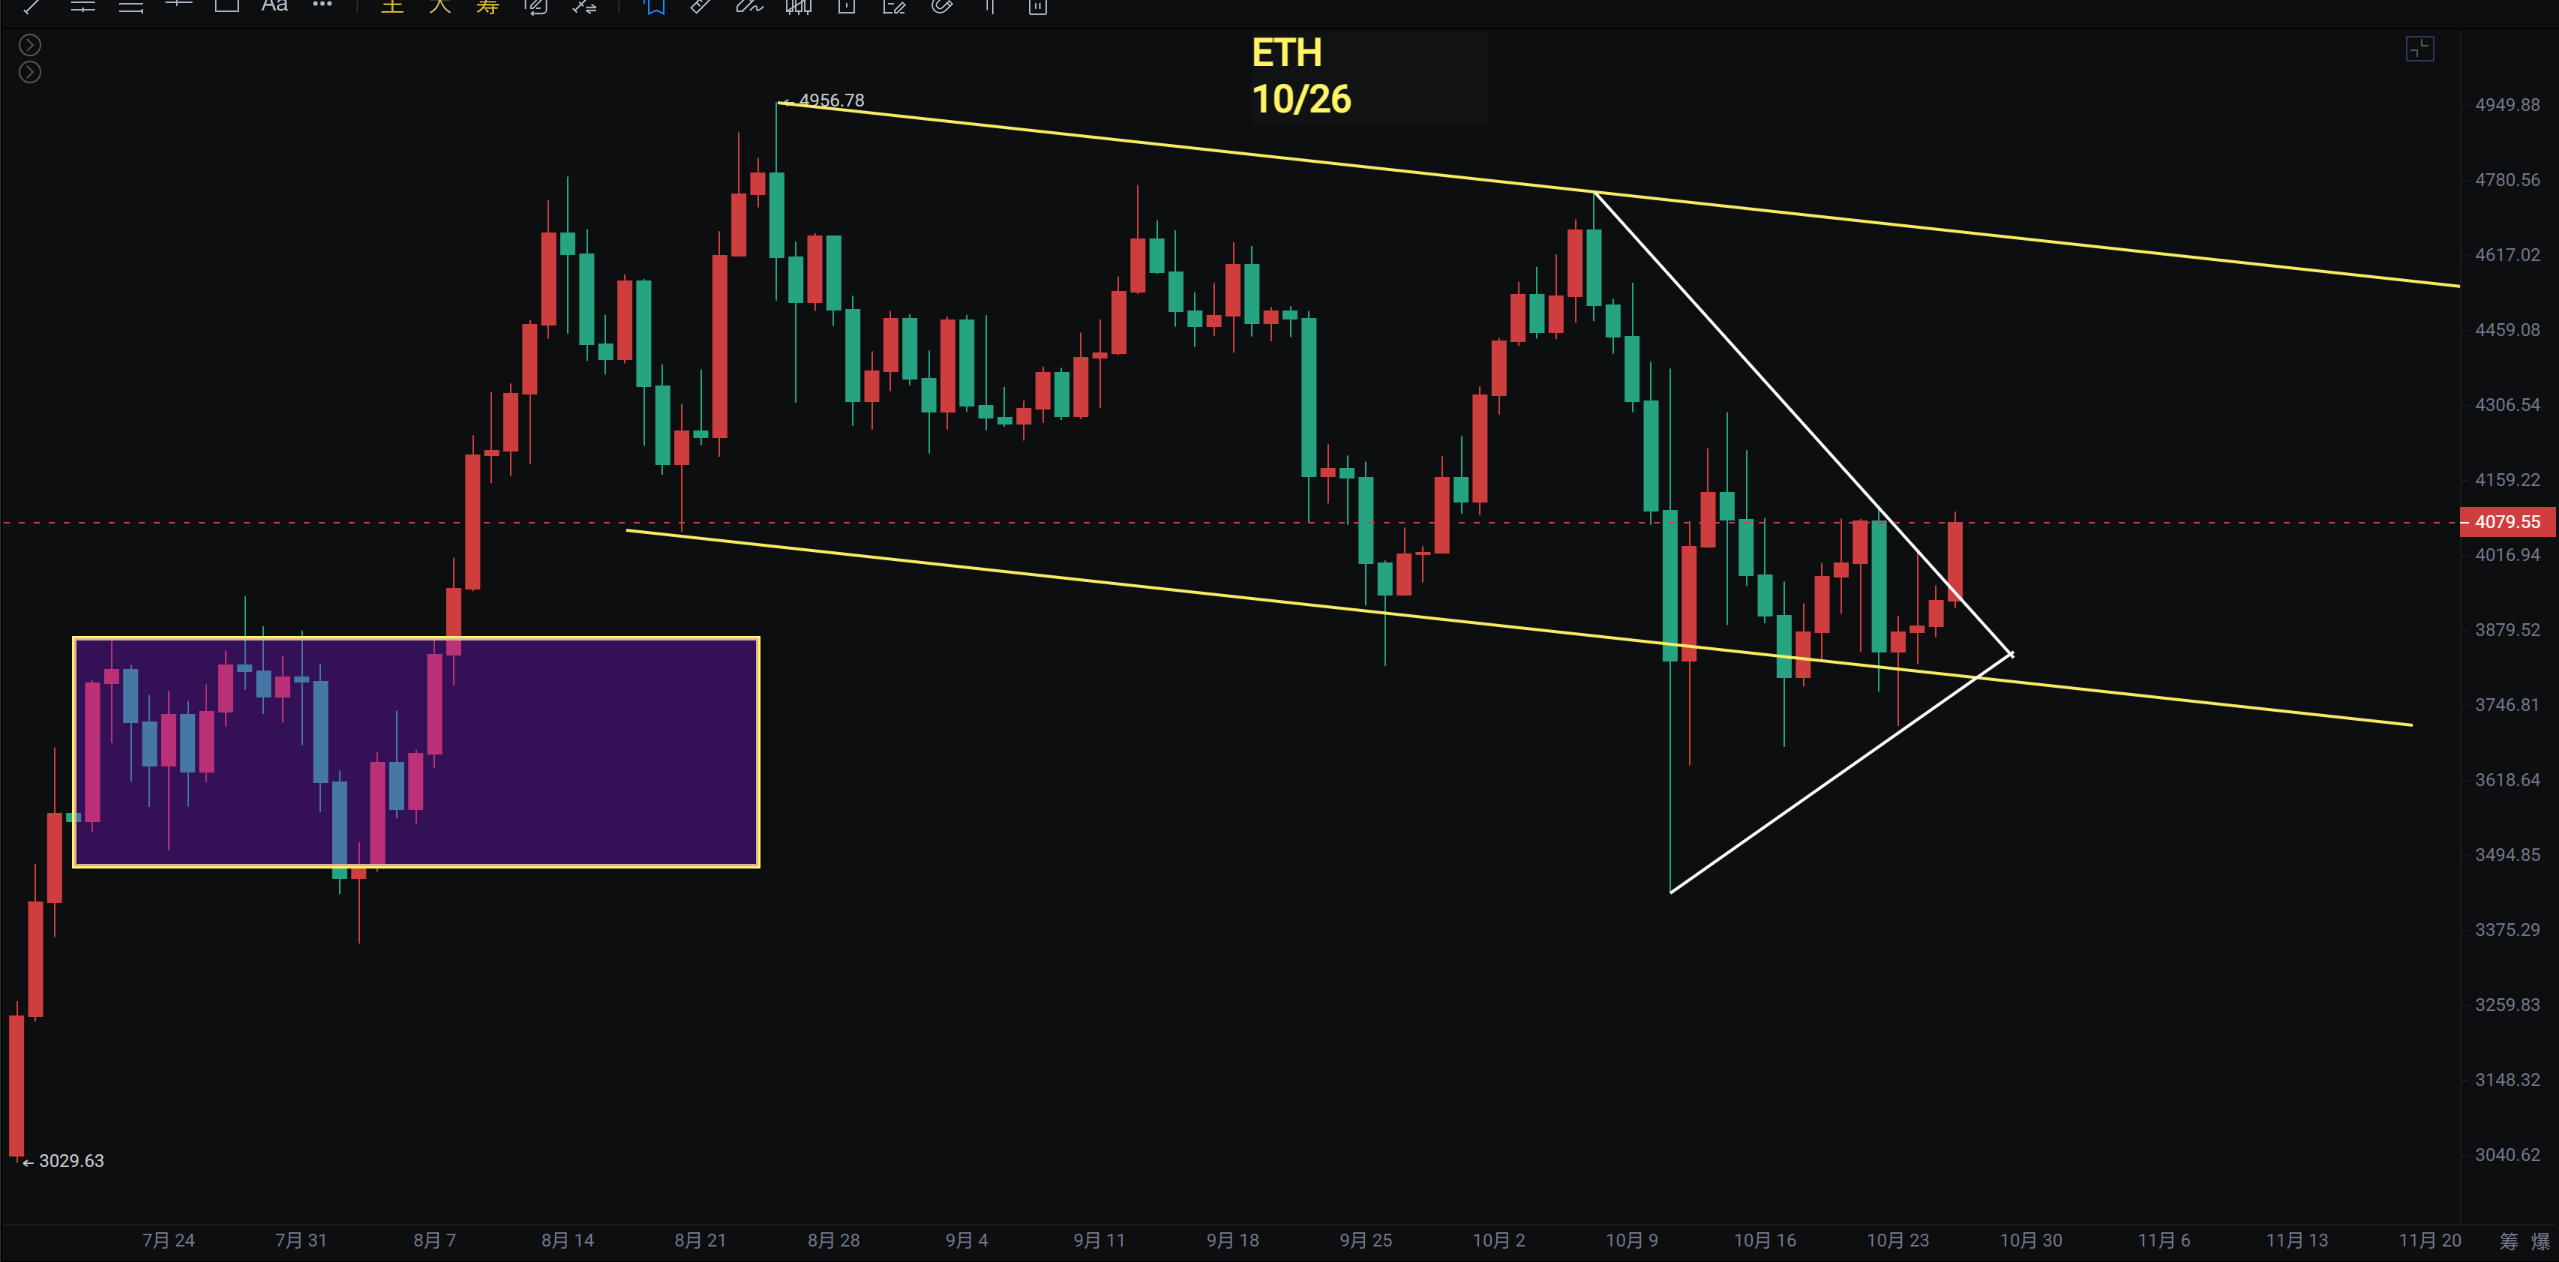
Ethereum
Ethereum's weekly chart has formed a "double bearish engulfing" pattern followed by two consecutive weeks of doji candles, indicating weak rebound momentum. The weekly MACD indicator has been below the zero line for two consecutive weeks, with the fast and slow lines crossing, but the price has not broken below the middle Bollinger band. The daily chart previously showed box fluctuations, which have now turned into a downward channel, with the current price hovering around $4,060. If it can break through $4,300, it is expected to test the upper edge of the channel.
The daily price continues to fluctuate around the MA120 moving average. If this support level holds firm, there is still a chance for a rebound. Currently, the daily MACD indicator has crossed above the zero line, and the RSI indicator has also achieved a breakout.
● Support level: $3,435 - $3,650

● Resistance level: $4,250 - $4,470 - $4,755
If you like my views, please like, comment, and share. Let's navigate through the bull and bear markets together!!!
This article is time-sensitive and for reference only, updated in real-time.
Focusing on K-line technical research, sharing global investment opportunities. Official account: BTC Trading Prince Fusu

免责声明:本文章仅代表作者个人观点,不代表本平台的立场和观点。本文章仅供信息分享,不构成对任何人的任何投资建议。用户与作者之间的任何争议,与本平台无关。如网页中刊载的文章或图片涉及侵权,请提供相关的权利证明和身份证明发送邮件到support@aicoin.com,本平台相关工作人员将会进行核查。


