Original Author: Michael Nadeau
Original Compilation: Chopper, Foresight News
There are many tools and frameworks for understanding Bitcoin price trends, such as the quantity theory of money (MV = PQ), stock-to-flow ratio, network value to transaction ratio, network value to Metcalfe's law ratio, realized price to market cap ratio, production costs, and so on.
However, in the current market, everything ultimately comes down to liquidity conditions.
In this article, we will explore the relationship between Bitcoin and global liquidity: Is Bitcoin really "lagging" behind global liquidity?
Bitcoin and Global Liquidity
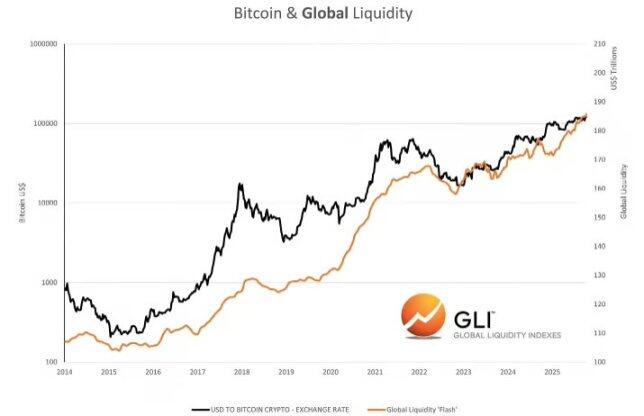
Data Source: Global Liquidity Indexes
According to research from Global Liquidity Indexes: "Historical data shows that changes in liquidity often trigger changes in the prices of risk assets, with a lag of about 3 months. Specifically, after an increase in global liquidity, risk assets typically perform well; while a decrease in liquidity often signals a weak price trend for assets."
Additionally, Raoul Pal from Global Macro Investor stated that global liquidity can explain 90% of Bitcoin price fluctuations.
So, what does the current data say?
- The annualized growth rate of global liquidity over three months is 10.2%;
- The current annual growth rate of global liquidity is 6%.
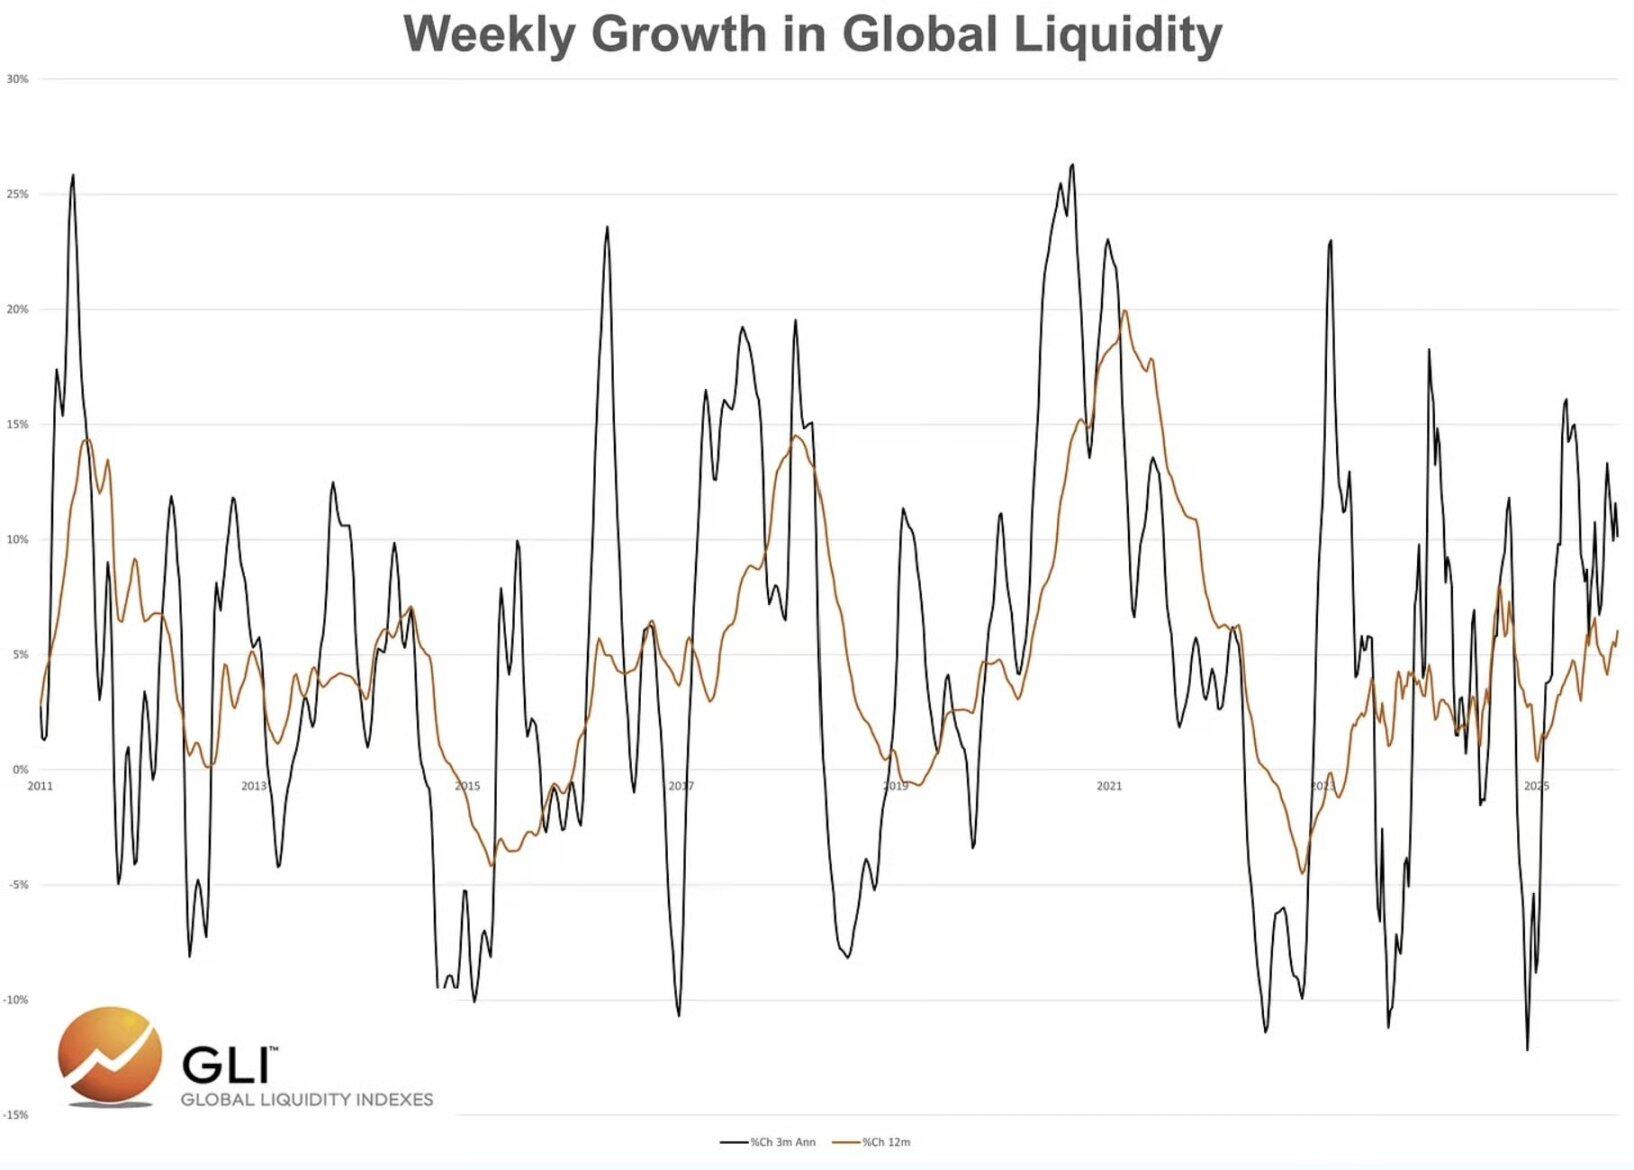
Data Source: Global Liquidity Indexes
Based on this data and logic, Bitcoin should continue to rise, right?
From the data and conventional narrative, the conclusion seems to be so. However, in the previous two cycles, global liquidity continued to expand for quite some time after Bitcoin reached its peak.
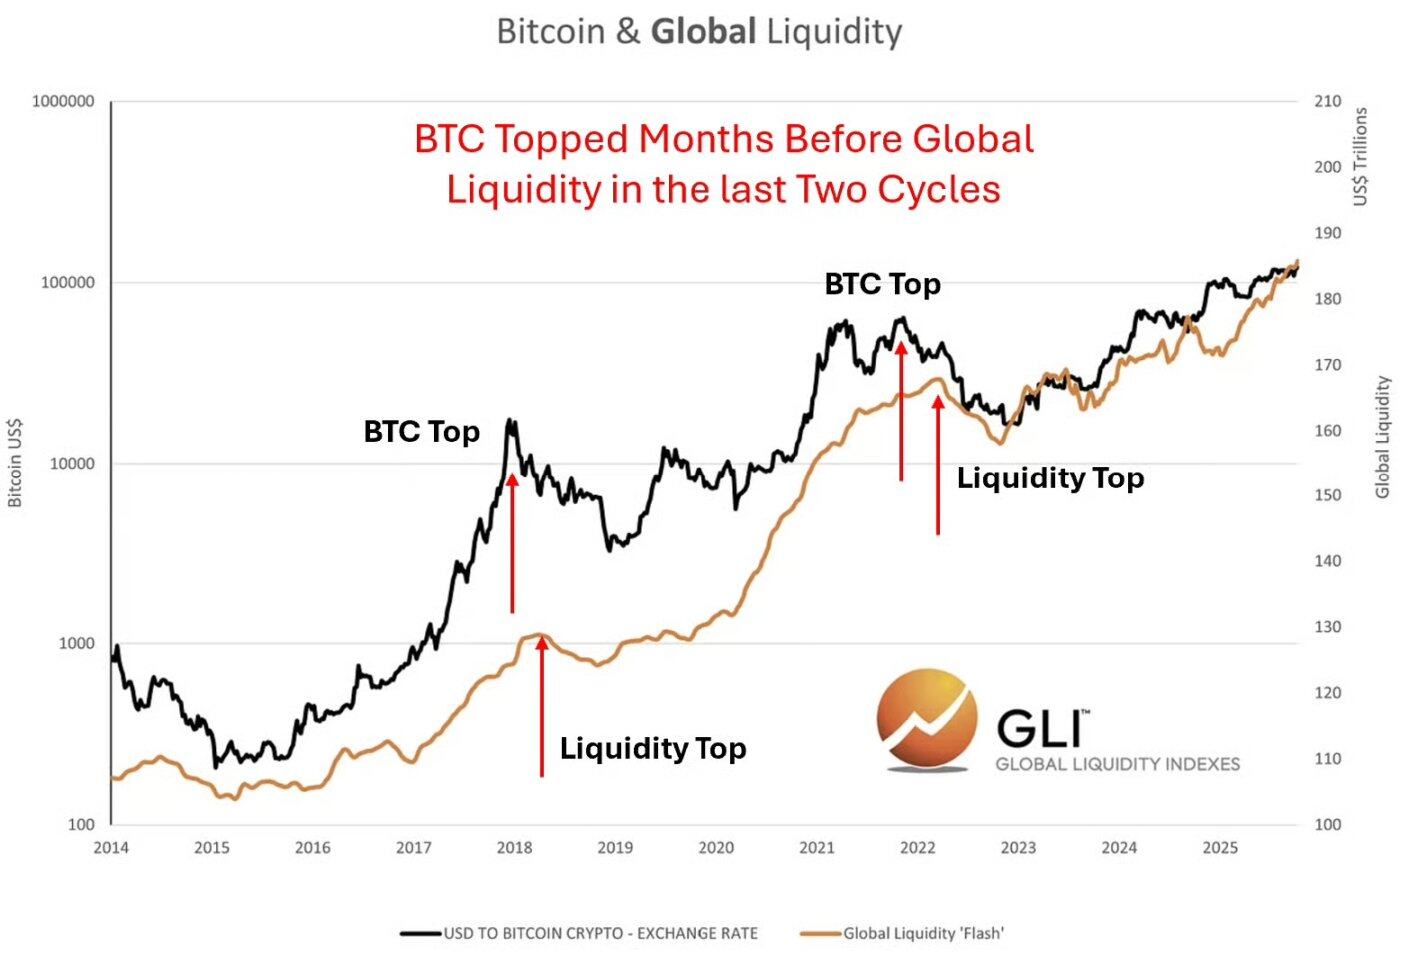
Data Source: Global Liquidity Indexes
This phenomenon contradicts the common saying that "Bitcoin prices lag behind liquidity."
Let’s pause for a moment and consider a question: Why would Bitcoin lag behind liquidity conditions?
After all, the market is forward-looking; moreover, Bitcoin trades continuously 24/7 in the global market. Why would it lag behind liquidity, a price-related key variable recognized by market participants?
In fact, we believe Bitcoin is leading global liquidity, especially at the market cycle peak.
Why? We think the market is reflecting the tightening trend of liquidity in advance, sensing the upcoming changes.
However, at the market bottom (bear market), the situation is the opposite, where global liquidity often leads Bitcoin.
Why? Because in a bear market, the market usually waits for clear signals from monetary and fiscal authorities before taking action.
It should be noted that we have not yet confirmed this view through quantitative analysis, but we can support this judgment through chart analysis.
Assuming global liquidity will expand again after Bitcoin reaches its peak, then our core task is to identify the catalysts that lead to a decline in global liquidity.
In the last cycle, the catalyst was high inflation and the Fed being forced to raise interest rates quickly, which was the reason for the market's "early positioning" in November 2021, when the liquidity contraction was driven by central bank monetary policy.
So, what could be the catalyst in this cycle?
In the current cycle, the pressure of liquidity tightening may not come from the Fed (the market expects the Fed to cut rates in October and December), but rather from fiscal policy.
Expected Fiscal Impact: Tariff Increases and BBB Spending Cuts
Expected Tariff Revenue: Assuming a tariff rate of 13%, it is expected to increase tariff revenue by $380 billion annually. The chart below shows the impact of tariffs to date.
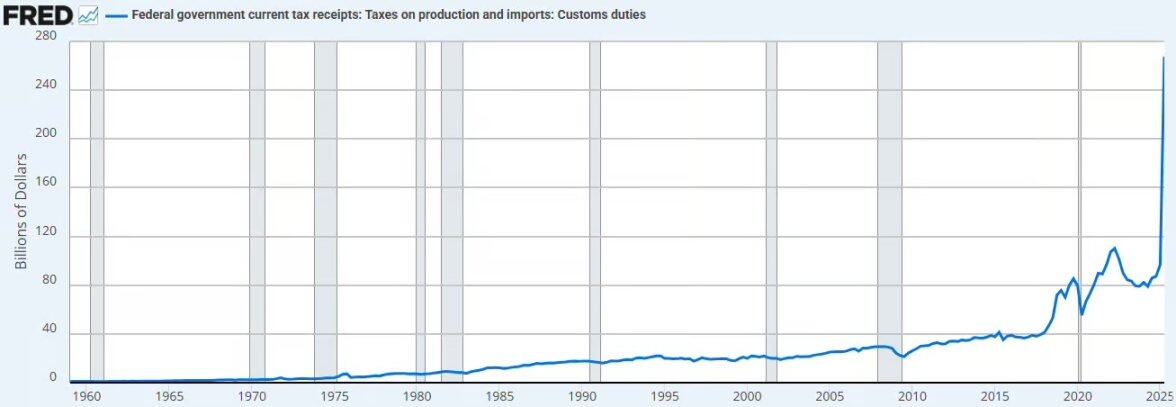
Data Source: Federal Reserve Economic Database
This will lead to liquidity being drained from the private sector and flowing back into the public sector's fiscal accounts.
We believe that this measure, even if it does not trigger deflation, will bring deflationary pressure.
Spending Cuts: The Congressional Budget Office (CBO) projects a reduction of $1.2 trillion to $1.3 trillion in spending over the next decade, including reforms to Medicaid and cuts to the Supplemental Nutrition Assistance Program (SNAP), translating to about $125 billion in spending cuts annually.
Adding the increased tariff revenue and spending cuts together, it will result in a fiscal tightening of $505 billion annually, accounting for 1.7% of the U.S. GDP.
However, in 2026, the U.S. will implement effective tax cuts for businesses, including tax exemptions for tip income, while adding $35 billion annually for infrastructure, defense, rural hospitals, NASA, and other areas.
These measures may offset the fiscal tightening brought about by tariffs and spending cuts, but will it be enough?
If Bitcoin is indeed leading liquidity again at the cycle peak, then we believe it is currently "positioning early" for the negative impact of tightening fiscal policy on liquidity.
You may often hear Basant mention in interviews: "We hope to stimulate the economy through the private sector."
We agree with this direction, but the process of achieving this goal may be fraught with difficulties. This is also why the Trump administration insisted on significantly lowering interest rates, aiming to bridge our transition to a new economic model.
Banking Liquidity
In addition to the potential changes in fiscal policy mentioned above, we also observe that banking liquidity is tightening.
The chart below shows that the imbalance between liquidity among market-making banks and available collateral during the overnight financing period is increasingly pronounced. This indicates that the money market is facing a liquidity shortage, with market makers either lacking cash or collateral.
This phenomenon aligns with the following factors:
- Fiscal tightening;
- The Fed's ongoing balance sheet reduction;
- The rebuilding of the Treasury's general account balance.
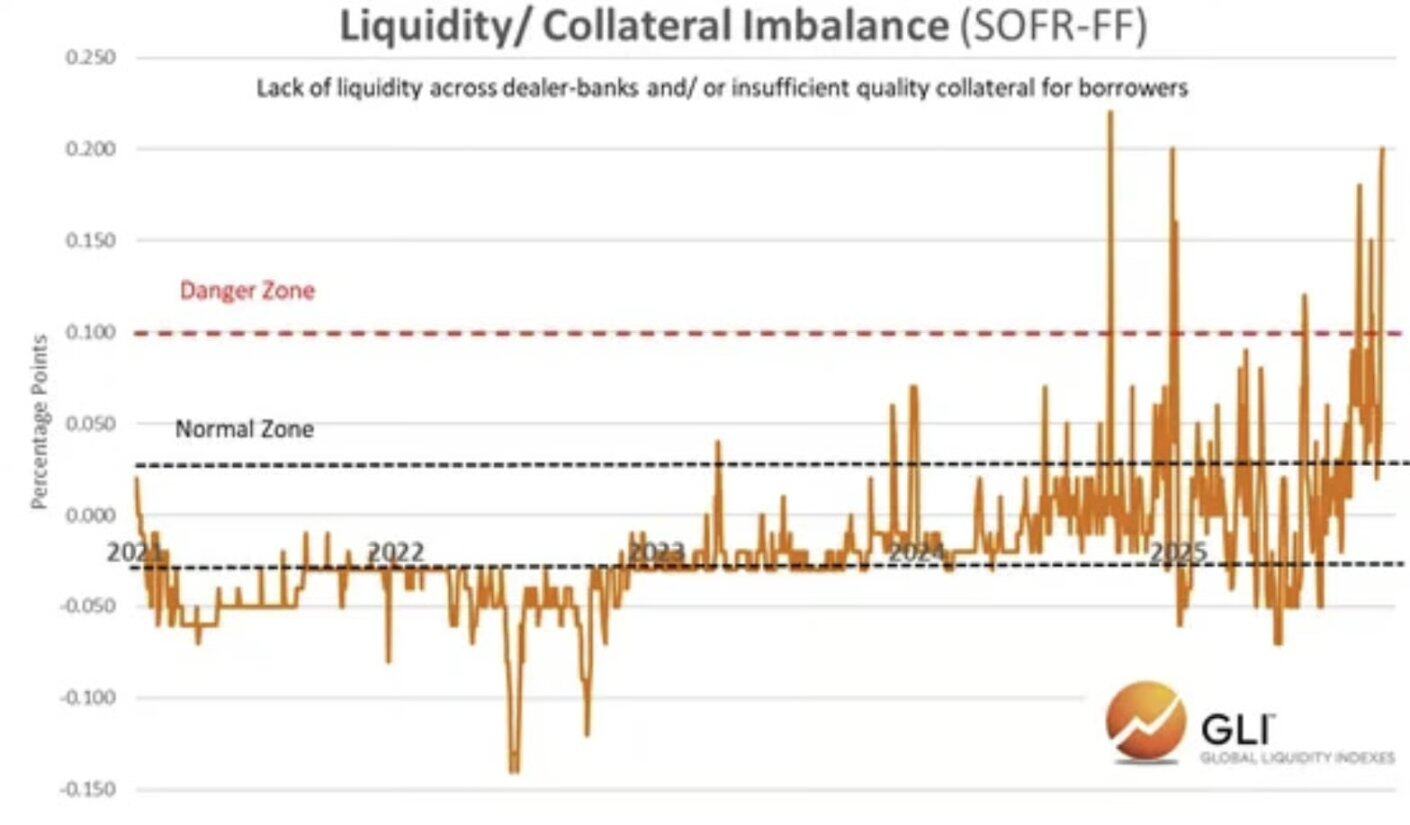
Data Source: Global Liquidity Indexes
As these factors develop, bank reserves are approaching the shortage level set by the Fed.
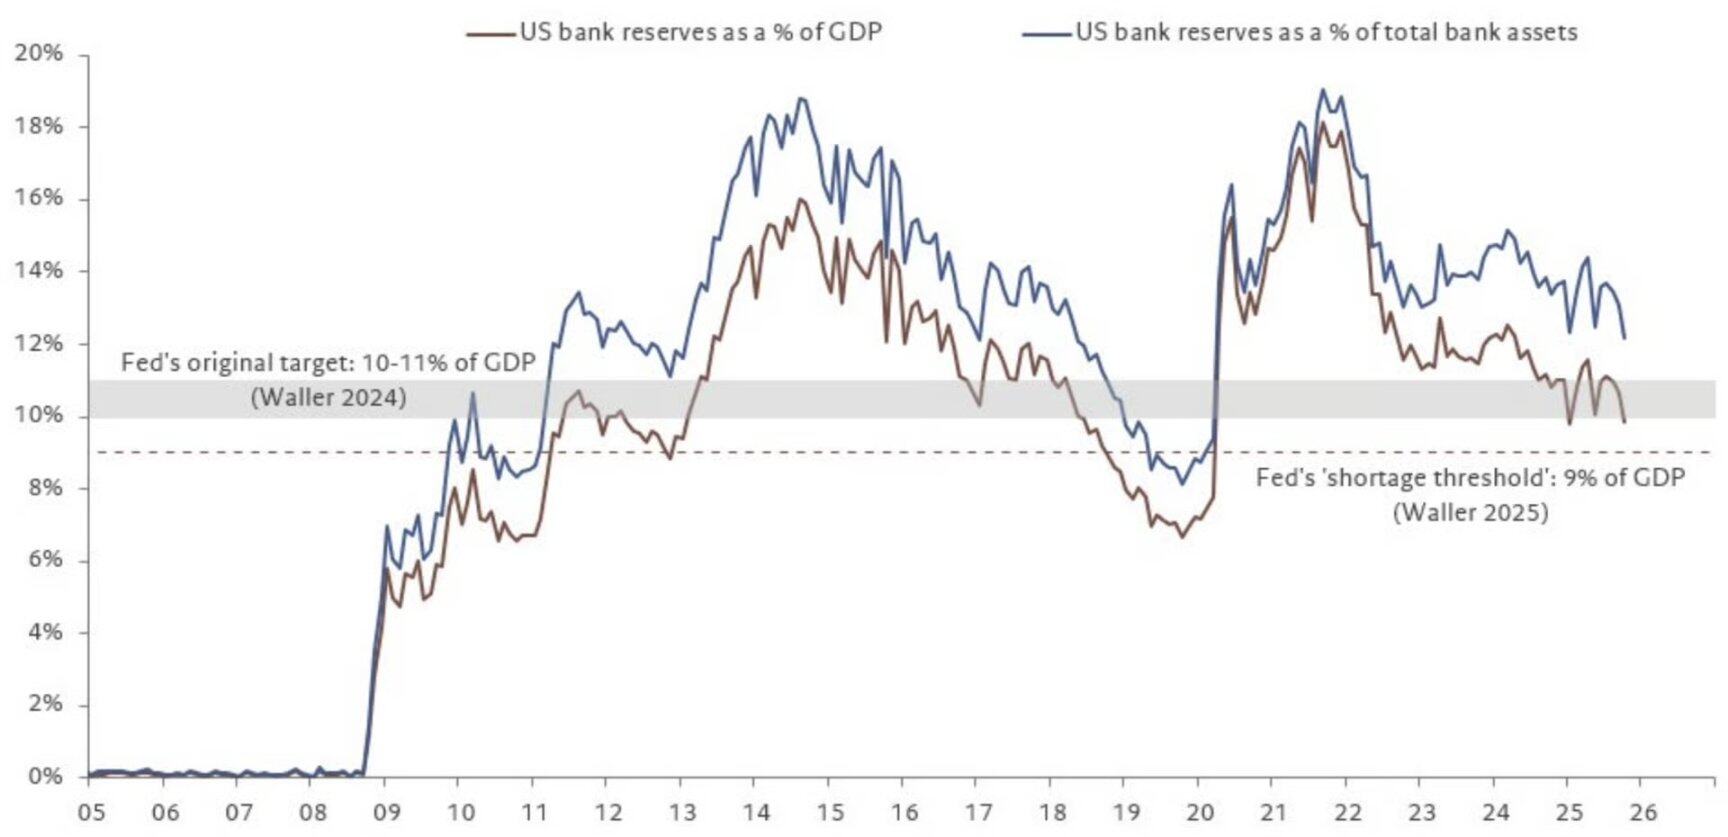
Data Source: @fwred
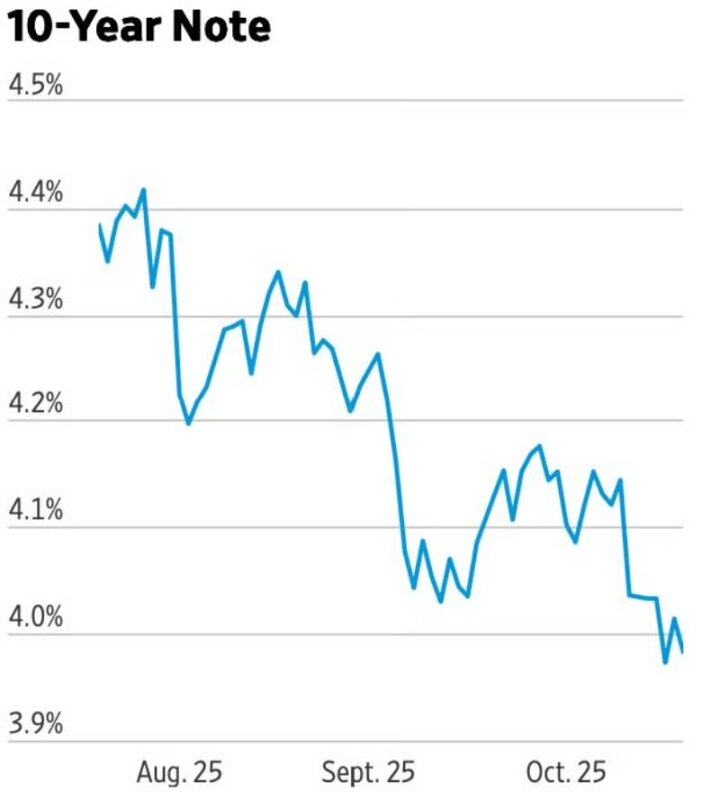
In summary, various signs indicate that trouble is brewing, and the performance of the bond market seems to corroborate this.
Conclusion
It is clear that at the peaks of the previous two cycles, Bitcoin led global liquidity. In the 2021 cycle, Bitcoin sensed the trends of high inflation and interest rate hikes in advance; at that time, the Biden administration was pushing the economy towards a fiscally dominated model, which is the core factor driving Bitcoin liquidity in this cycle.
So, what about now?
We are gradually exiting the fiscally dominated model. In our view, during this transition, risk assets may be negatively impacted.
免责声明:本文章仅代表作者个人观点,不代表本平台的立场和观点。本文章仅供信息分享,不构成对任何人的任何投资建议。用户与作者之间的任何争议,与本平台无关。如网页中刊载的文章或图片涉及侵权,请提供相关的权利证明和身份证明发送邮件到support@aicoin.com,本平台相关工作人员将会进行核查。


