1. Core Principles of the OBV Indicator
1. What is OBV?
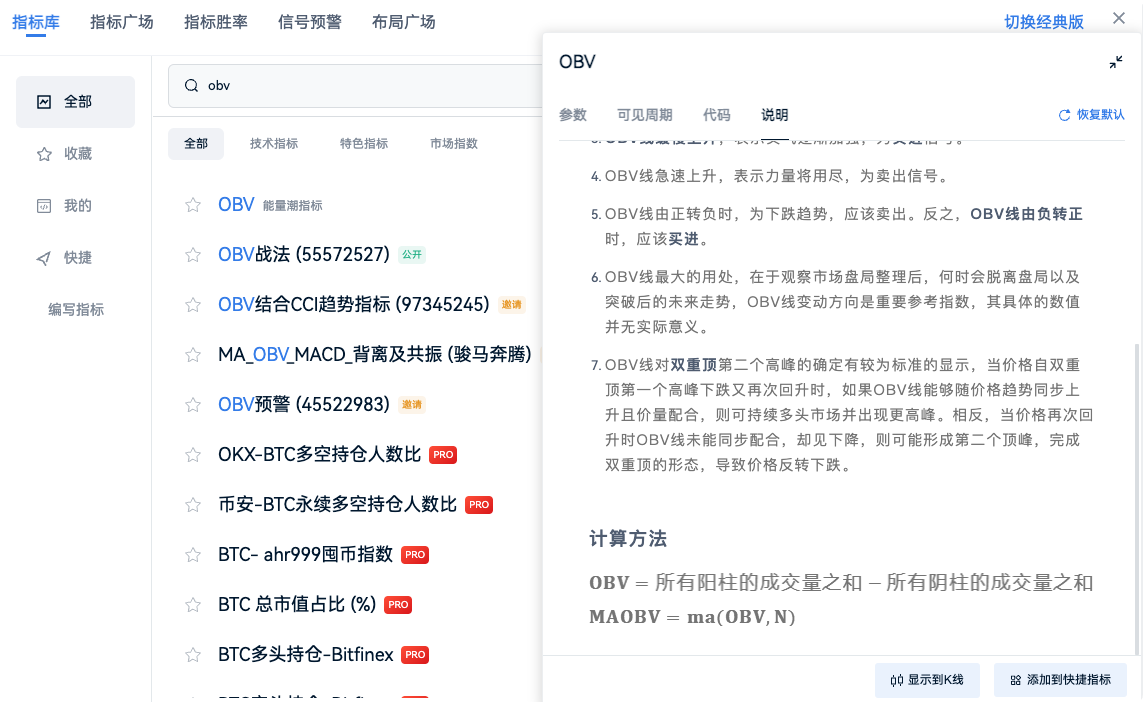
OBV (On Balance Volume) is an energy flow indicator, a volume-price analysis tool used to track the trend of capital inflows and outflows in asset prices.
Core Idea: Trading volume is a key factor driving price changes. By accumulating daily trading volume, it measures the comparison of bullish and bearish forces among market participants.

2. Calculation Formula:
- Closing Price Rises: Add the day's trading volume to the previous day's OBV value.
- Closing Price Falls: Subtract the day's trading volume from the previous day's OBV value.
- Closing Price Remains Unchanged: The day's OBV value remains the same.
3. Core Functions:
Volume-Price Divergence Indicates Trend Reversal: Divergence between OBV and price (e.g., price makes a new high but OBV does not) may suggest a potential reversal;
Helps assess the strength of bullish and bearish forces and understand market sentiment indirectly.
2. OBV Golden Cross and Death Cross Signals
1. Definition of Golden Cross and Death Cross:
- Golden Cross Signal: The short-term trend line OBV crosses above the long-term trend line OBV, forming a "crossing upwards" pattern, indicating strong bullish sentiment.
- Death Cross Signal: The short-term trend line OBV crosses below the long-term trend line OBV, forming a "crossing downwards" pattern, indicating bearish dominance in the market.
2. Key Points for Using OBV:
- Breakthrough Resistance Levels: When OBV breaks through historical resistance levels, it often signals that prices may rise accordingly.
- Validate Price Trends: When prices break new highs or lows, observe whether OBV also breaks through simultaneously; if not consistent, it may indicate a false breakout signal.
- Trend Confirmation: If OBV continues to rise but prices remain unchanged, it indicates that major players are active, potentially leading to a trend-following market.
3. Combining Signal Strengths and Weaknesses:
- OBV excels at capturing trend continuation phases but is less sensitive to short-term fluctuations or minor reversal signals.
- It is recommended to use in conjunction with candlestick positions and trend line resistance levels for a comprehensive analysis of signal strength.
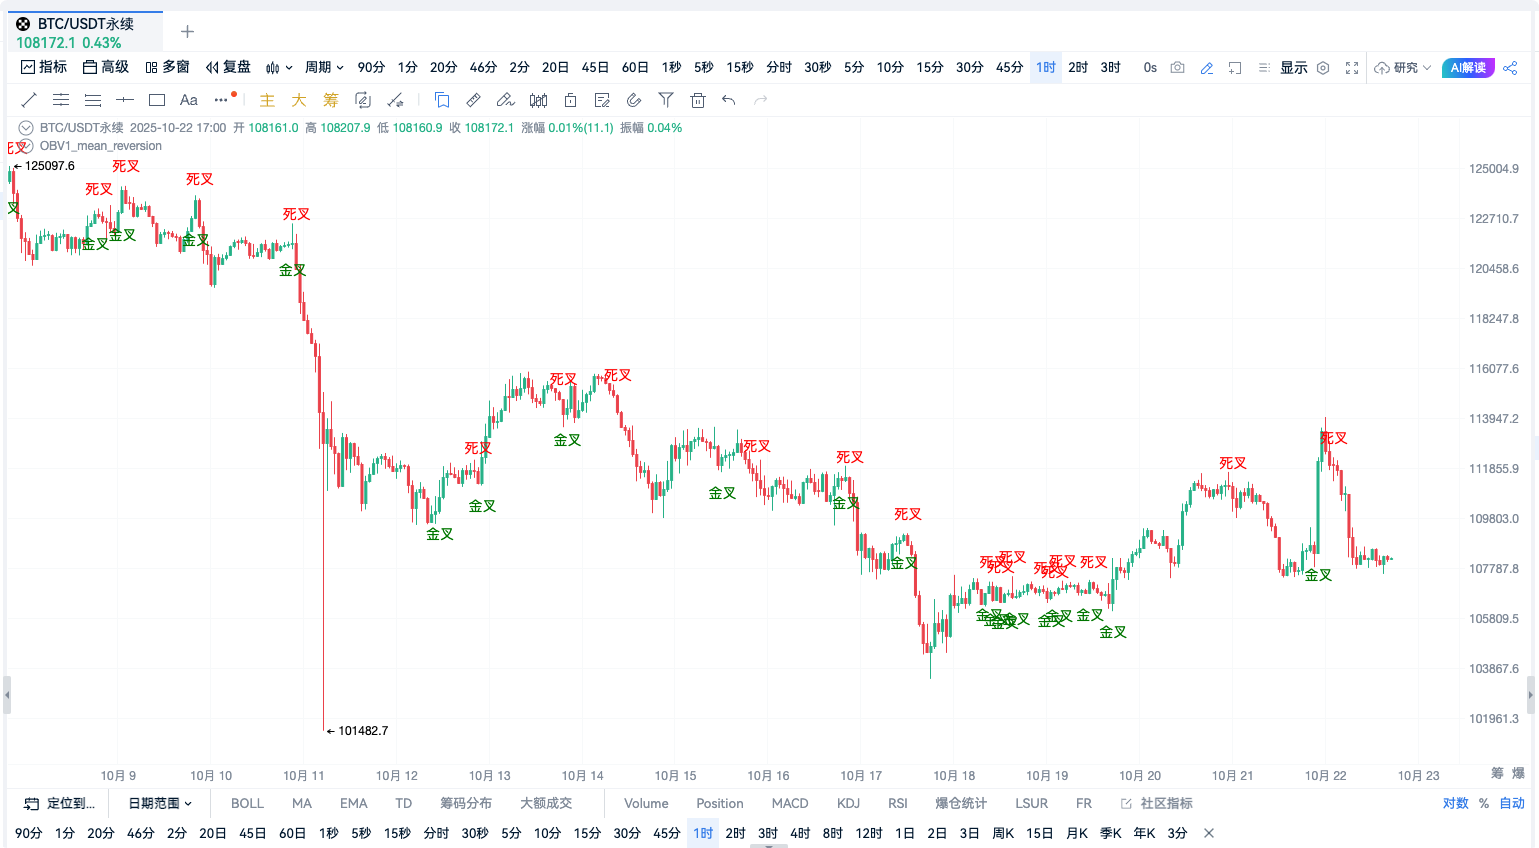
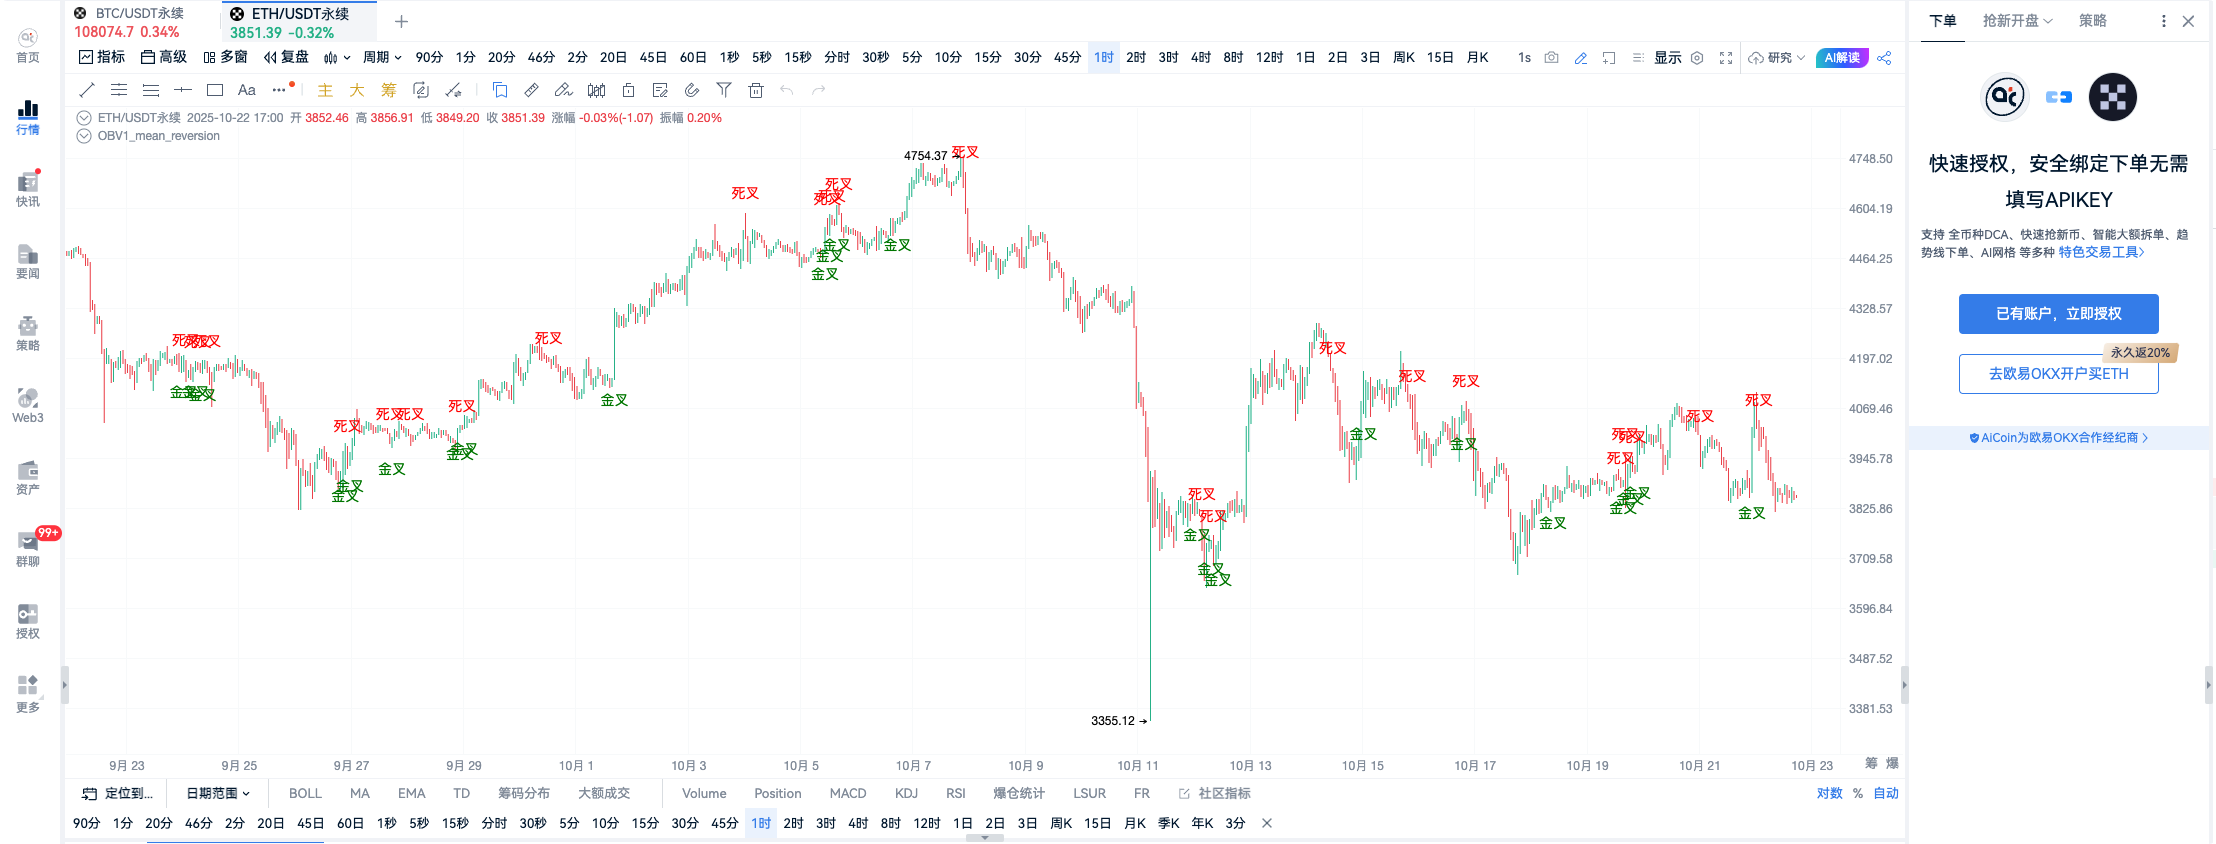
3. Custom Indicator · Signal Effect

(Image OKX-BTCUSDT Perpetual Contract)

(Image OKX-ETHUSDT Perpetual Contract)
Summary: Signal Performance Analysis
The OBV indicator performs exceptionally well in trending markets, accurately identifying bullish and bearish directions and providing trend-following trading signals. However, in sideways and volatile markets, due to smaller fluctuations in capital flow, false signals may occur, leading to drawdown losses. It is suitable for trend traders, while short to medium-term operations should be optimized with other indicators.
4. Custom Indicator · Script Source Code
// This indicator was created by the AICOIN Research Institute. For any usage issues, please join the indicator community for consultation.
// @version=2
change = close - close[1]
obv = cum((change > 0 ? 1 : change < 0 ? -1 : 0 ) * volume)
maobv = ma(obv, 30)
// Define conditions
is_sell=crossup(obv, maobv)
is_buy=crossdown(obv, maobv)
// Define alert conditions for use in the alert window
alertcondition(is_sell, title='OBV Golden Cross', direction="sell")
alertcondition(is_buy, title='OBV Death Cross', direction="buy")
// Plot on the chart
// plot(obv, title='OBV')
// plot(maobv, title="MAOBV")
plotText(is_sell, title="Golden Cross", text='Golden Cross', color='green', refSeries=low, placement='bottom')
plotText(is_buy, title="Death Cross", text='Death Cross', color='red', refSeries=high, placement='top')
// Buy
exitShort(is_buy, price='market', amount=1)
enterLong(is_buy, price='market', amount=1)
// Sell
exitLong(is_sell, price='market', amount=1)
enterShort(is_sell, price='market', amount=1)
5. Comprehensive Summary
Recommended Scenarios:
- The OBV indicator is more suitable for one-sided upward or downward trending markets, helping to determine the true buy/sell direction.
- It is not sensitive enough for volatile markets, so it is recommended to combine with other indicators (such as candlestick patterns or support and resistance levels) for comprehensive analysis.
- Short-term traders should incorporate stop-loss strategies to avoid drawdowns caused by frequent opening and closing of positions in sideways ranges.
Risk Management Recommendations:
- It is not advisable to engage in excessive trading in sideways markets without a clear trend; consider increasing signal grading or expanding observation periods to avoid false signals above minor support or resistance.
- All signal executions should have strict stop-loss levels set, such as 5%-10% floating stop-loss to protect account safety.
From the perspective of actual trading effectiveness, the OBV indicator can accurately identify trend directions and is an important reference tool for short, medium, and long-term trend traders. However, in volatile markets, due to higher drawdown rates, combining with other indicators can further enhance the reliability and win rate of signals.
Join our community to discuss and become stronger together!
Official Telegram community: t.me/aicoincn
AiCoin Chinese Twitter: https://x.com/AiCoinzh
Group Chat - Wealth Group:
https://www.aicoin.com/link/chat?cid=10013
免责声明:本文章仅代表作者个人观点,不代表本平台的立场和观点。本文章仅供信息分享,不构成对任何人的任何投资建议。用户与作者之间的任何争议,与本平台无关。如网页中刊载的文章或图片涉及侵权,请提供相关的权利证明和身份证明发送邮件到support@aicoin.com,本平台相关工作人员将会进行核查。


