Li Ying in the Cryptocurrency Circle: Bitcoin Latest Market Analysis on 10.20
Article Published on 2025.10.20------00:10
The current price of Bitcoin is 106,400. Li Ying assesses that Bitcoin is in a range-bound oscillation pattern, with prices running between the support level of 102,000 and the resistance level of 114,500. In the short term, the rebound momentum has somewhat strengthened, mainly influenced by the engulfing pattern and the bullish resonance from the short-term moving average golden cross. However, the significant reduction in trading volume indicates an unhealthy price-volume relationship, leading to considerable uncertainty regarding the continuation of the rebound. The daily line closed with a bullish candle, rising from 106,103 to 108,379, an increase of 1,195 points, showing strong rebound strength, but it has not yet broken through the previous high of 109,240. The MACD short-term bullish momentum is weakening, and the daily line shows signs of forming a golden cross. The EMA indicates a bullish short-term trend but significant long-term pressure. If the previous high resistance level of 109,240 cannot be broken, the bearish trend will continue. Li Ying believes it is most prudent to wait for the market to clarify before deciding on a long or short position.
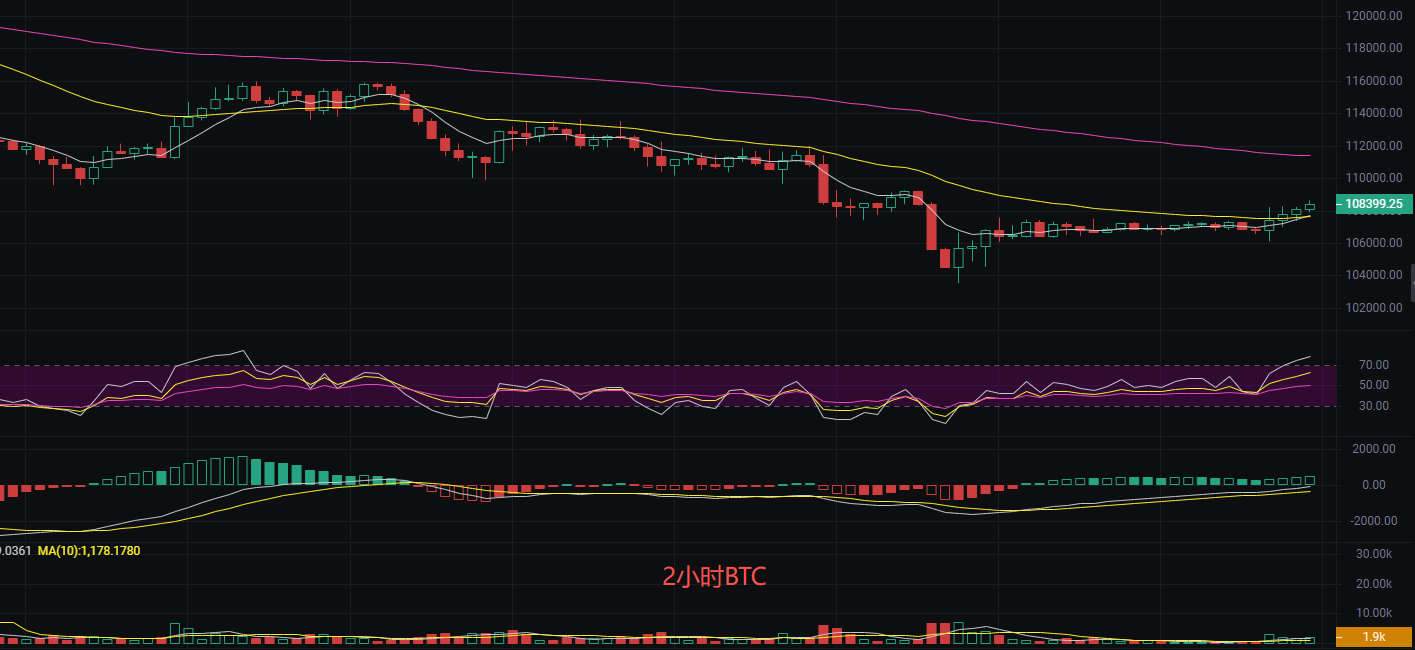
Short-term Strategy Reference:
- Long Entry Point: 107,000, Stop Loss: 106,500, Stop Loss Distance: 500 points, Target: 108,500
- Short Entry Point: 109,000, Stop Loss: 109,500, Stop Loss Distance: 500 points, Target: 107,500
Ethereum Latest Market Analysis
Before publication, the current price of Ethereum is 3,918. Li Ying observes that the current Ethereum price is close to the strong support level of 3,950, but trading volume continues to shrink, indicating insufficient upward momentum in the short term. The engulfing pattern provides a bullish reversal signal, but the price-volume relationship is unhealthy, with moving averages entangled and the trend flat, further confirming the market's lack of clear direction. The effectiveness of the key support level of 3,950 has become crucial for the short-term market trend. The K-line's upward trend has gradually risen from the low of 3,955 to 3,979, forming a small bullish candle. The daily line has closed bullish for two consecutive days, indicating strong bullish power in the short term. The MACD is in a bullish trend on the 2-hour chart, and the daily bullish momentum is strengthening. The EMA on the 2-hour chart shows a strong bullish trend, indicating that the bulls have not yet finished, but there is significant resistance in terms of space. There is potential to capture upward movement, but Li Ying observes that the risks are higher, so it is temporarily recommended to wait and see before entering the market.
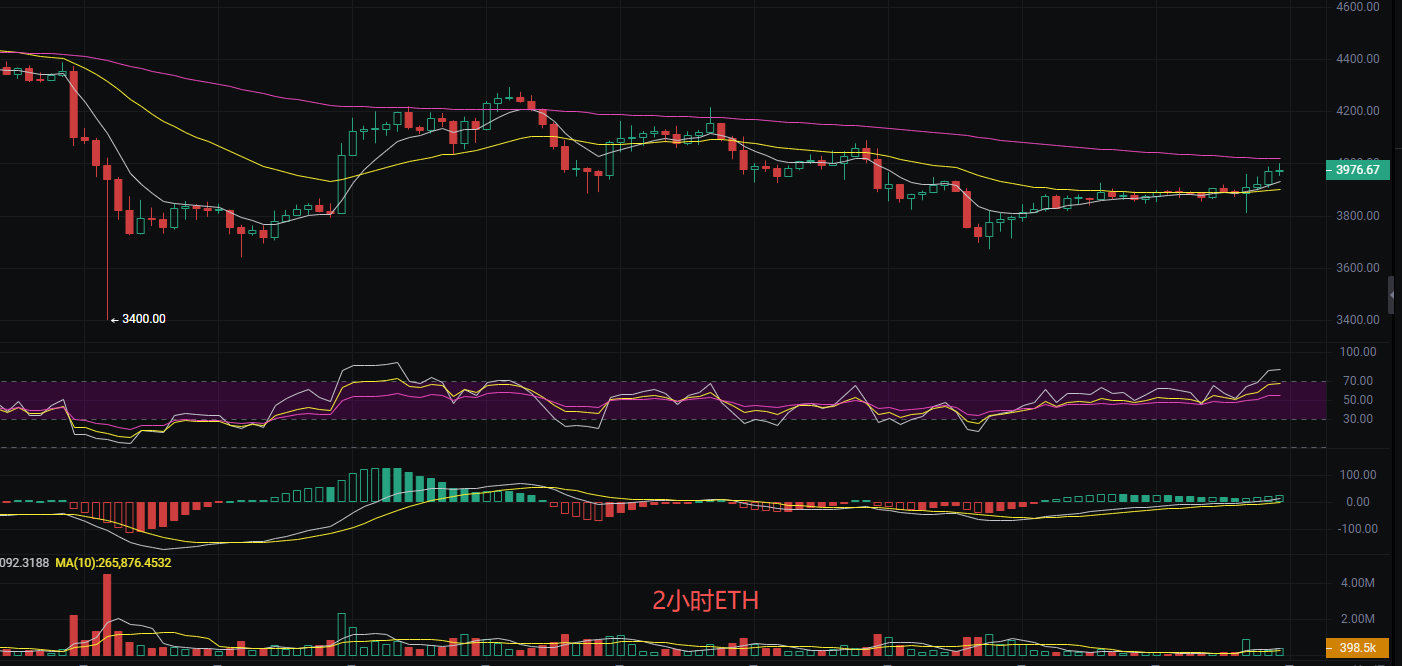
Short-term Point Reference:
- Short Entry Point: 4,020, Stop Loss: 4,060, Stop Loss Distance: 50 points, Target: 3,920
- Long Entry Point: 3,900, Stop Loss: 3,885, Stop Loss Distance: 50 points, Target: 4,000
The above content is exclusively original by Li Ying. Please indicate the source when reprinting! Article publication review has a delay, and market conditions change rapidly. The above suggestions are for reference only, and risks are borne by the reader. I hope Li Ying's insights will be helpful to you!

The content of the article is time-sensitive and for reference only; risks are borne by the reader.
免责声明:本文章仅代表作者个人观点,不代表本平台的立场和观点。本文章仅供信息分享,不构成对任何人的任何投资建议。用户与作者之间的任何争议,与本平台无关。如网页中刊载的文章或图片涉及侵权,请提供相关的权利证明和身份证明发送邮件到support@aicoin.com,本平台相关工作人员将会进行核查。


