Yesterday we mentioned that we do not recommend excessive trading. Today, the market has seen a slight rebound, but it is not significant. Here, whether bullish or bearish, the returns are not high. Currently, we see a bullish candle, and after consecutive rebounds over the weekend, both bulls and bears should remain vigilant, as there are valid reasons for both bullish and bearish sentiments.
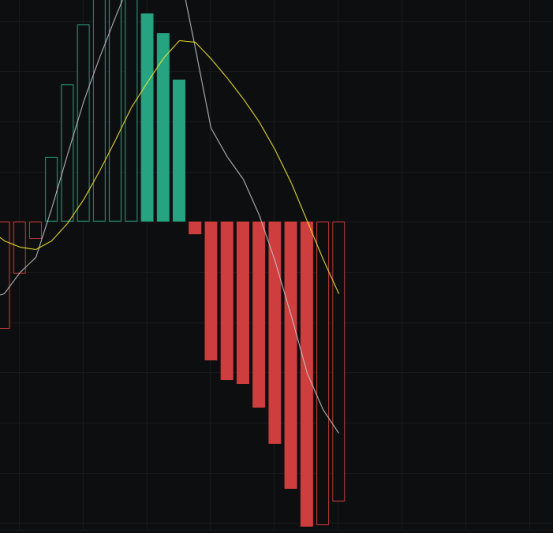
From the MACD perspective, the energy bars have shown a rebound for two consecutive days. Even if this is not the bottom, at least it has acted as a brake on the downward trend. Whether this brake will be successful still needs to be observed over the next few days.
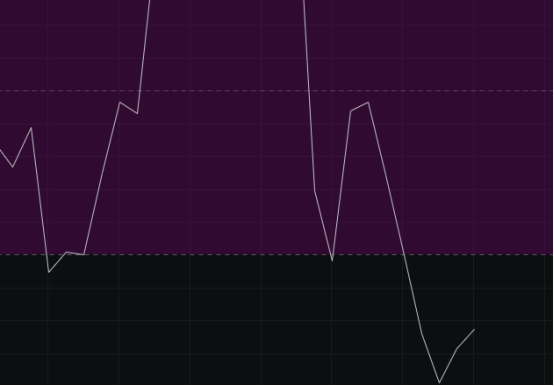
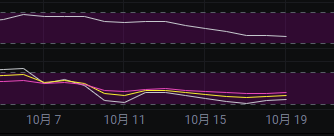
Looking at the CCI, it is still below the zero line, so even if there is an increase, it won't be substantial unless the bulls exert more force. To be bullish here, we need consecutive bullish candles to bring the CCI closer to the zero line.
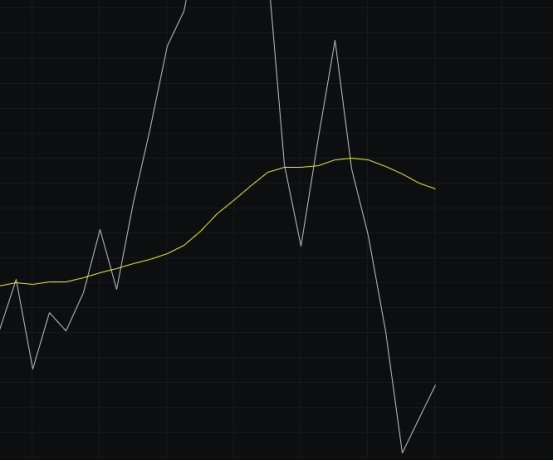
From the OBV perspective, there has been a certain rebound, but it is not enough, as the slow line is still moving downward. To be bullish, we need at least consecutive bullish candles to see a significant rebound in the OBV.
Looking at the KDJ, it is currently around 30, in a flat state, and is quite close to 20. Whether it will continue to approach 20 or form a bottom around 30 needs to be observed over the next few days.
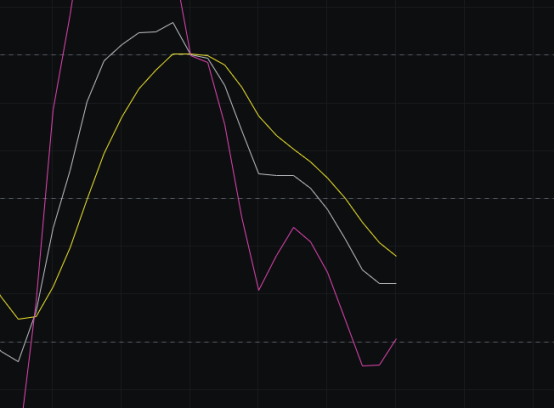
In terms of MFI and RSI, the MFI continues to decline, while the RSI has shown a slight rebound, but both are still in a weak zone. For the market to recover, the indicators need to move out of the weak zone, at least into the neutral range.
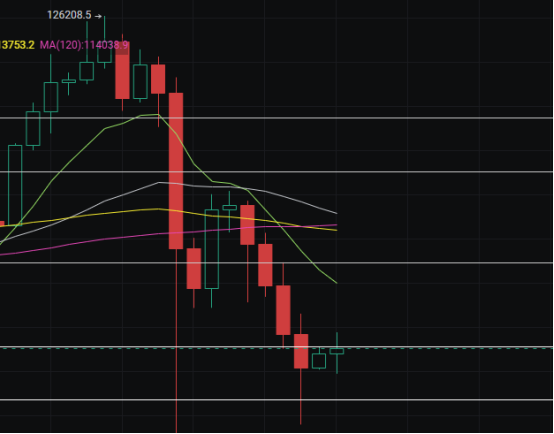
From the moving averages perspective, several moving averages are currently pressing down, indicating a bearish trend. We still maintain a bearish outlook here.
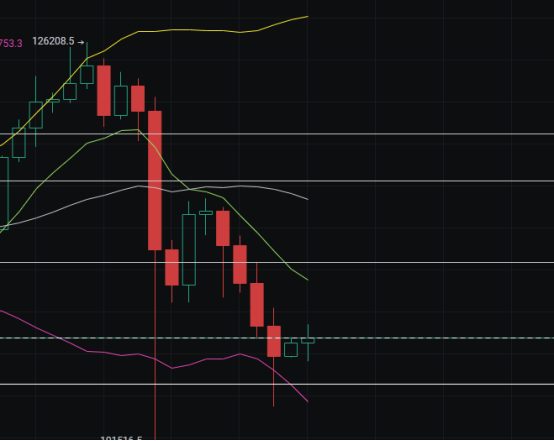
Looking at the Bollinger Bands, they continue to open. If the market continues to close bullish, the Bollinger Bands will enter a wide range, which could indicate a temporary bottom. If the market closes bearish, it will develop into a downward channel, and the market will continue to look bearish. The next step is to observe when the Bollinger Bands' trend changes and what kind of trend it will change to; we expect to see this in a couple of days.
In summary: With the declines over the past few days, the market has reached near previous lows, and with the bullish candles over the last two days, some may see this as a double bottom. However, it is still too early to consider this a bottom. Currently, there is a divergence between bulls and bears, so whether going long or short, it is essential to set stop losses. 107500 will be a key battleground. Resistance is seen at 109000-112000, and support is at 105000-101500.
免责声明:本文章仅代表作者个人观点,不代表本平台的立场和观点。本文章仅供信息分享,不构成对任何人的任何投资建议。用户与作者之间的任何争议,与本平台无关。如网页中刊载的文章或图片涉及侵权,请提供相关的权利证明和身份证明发送邮件到support@aicoin.com,本平台相关工作人员将会进行核查。


