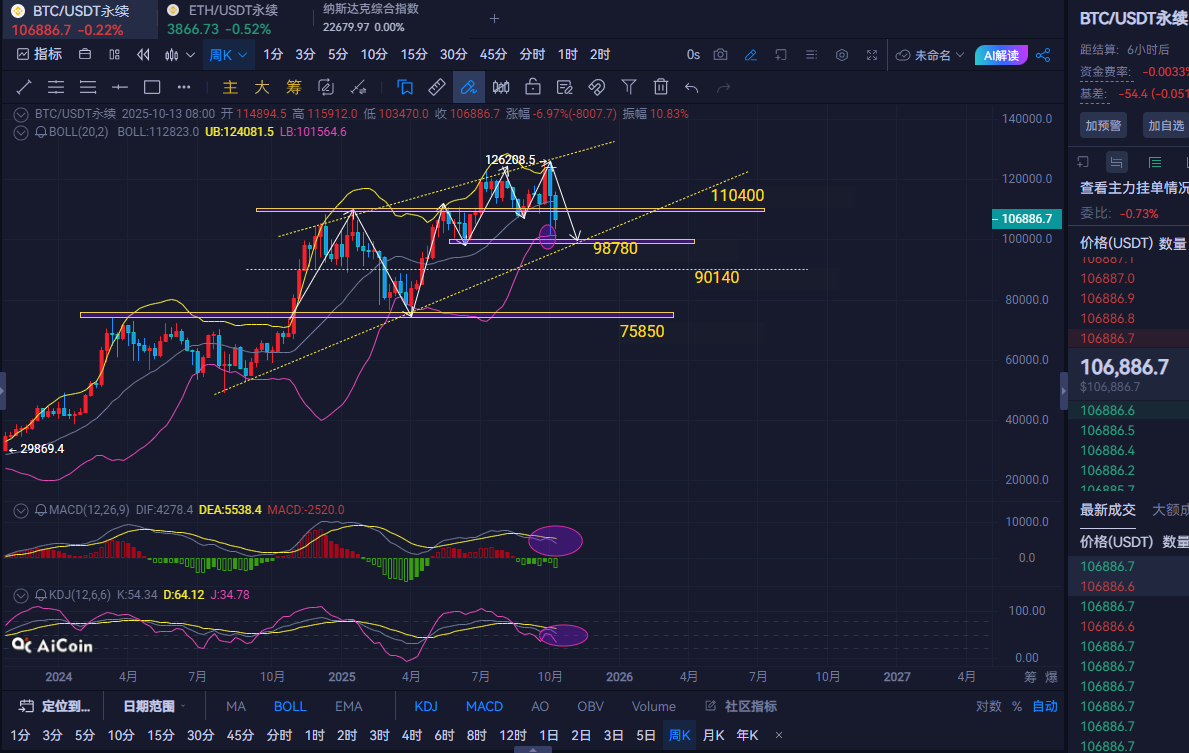
Cycle Analysis: From the 4-hour chart of Bitcoin, the market is still consolidating below the middle band of the Bollinger Bands, with alternating bullish and bearish movements but not breaking out of a significant range. The MACD indicator shows the two lines converging below the zero axis, and the overall trend remains weak. Additionally, the duration of the low-level consolidation is gradually extending, indicating a significant volatility ahead. From the weekly perspective, the Bollinger Bands, MACD, and KDJ indicators are all trending downwards simultaneously, making the bearish sentiment quite evident. If the market cannot quickly break through the resistance in the 110000-110400 area next week, it is highly likely to test the support around 98780.
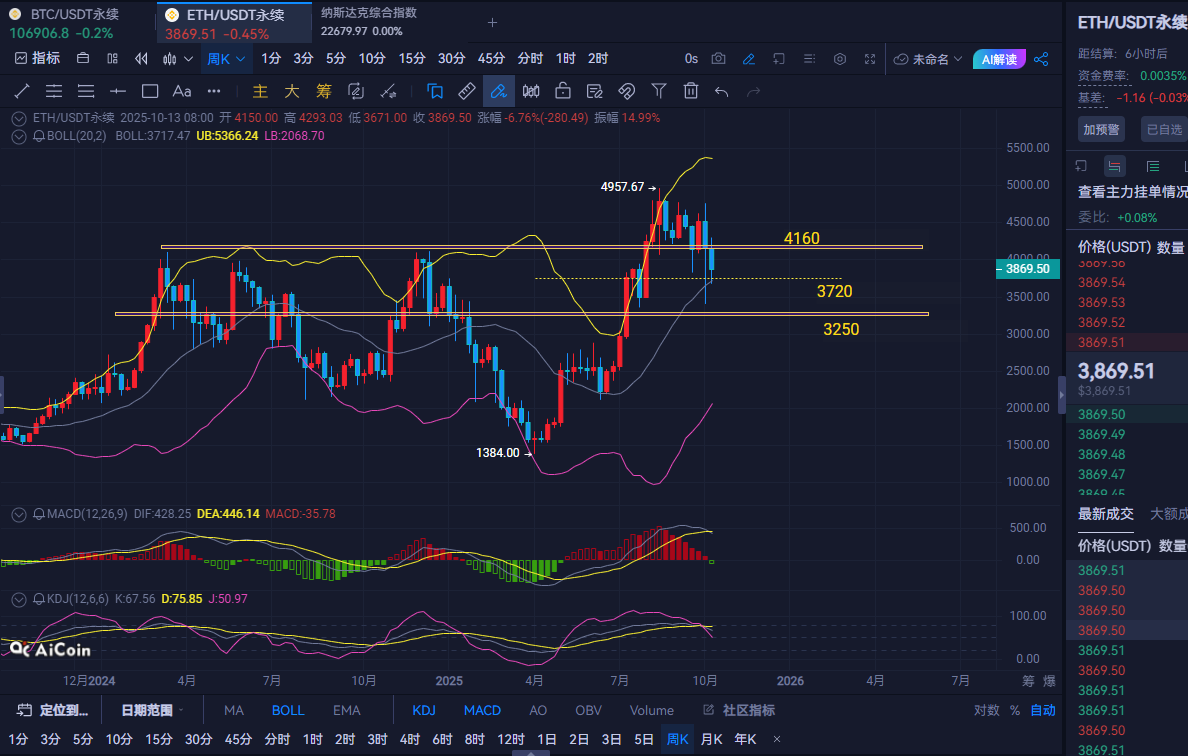
Ethereum has shown a downward trend in the K-line over the past few days, with consecutive bearish candles from October 16 to 19, as the price gradually fell from a high of 4086 to around 3870. After a surge on October 12, a long upper shadow was formed, indicating heavy selling pressure above; subsequently, there were multiple unsuccessful attempts to break through the 4000 psychological level. On the weekly technical indicators, the MACD histogram has turned negative, and the K-line has shown two consecutive weeks of large bearish candles, piercing the middle band of the Bollinger Bands twice before rebounding, indicating support near the middle band (3720). If it can break through the 4110-4160 area next week, the market trend may change.
The strategy is for reference only; please invest cautiously. The market is highly volatile, so observe more and act less, securing profits when possible (for real-time updates, follow the public account: Ethereum Kai).
免责声明:本文章仅代表作者个人观点,不代表本平台的立场和观点。本文章仅供信息分享,不构成对任何人的任何投资建议。用户与作者之间的任何争议,与本平台无关。如网页中刊载的文章或图片涉及侵权,请提供相关的权利证明和身份证明发送邮件到support@aicoin.com,本平台相关工作人员将会进行核查。


